Closing the urban water loop: lessons from Singapore and Windhoek
M.
Lafforgue
*a and
V.
Lenouvel
b
aSuez Environnement Consulting, Le Bruyère 2000 - Bâtiment 1, Zone du Millénaire, 650 Rue Henri Becquerel, CS79542, 34961 Montpellier Cedex 2, France. E-mail: michel.lafforgue@safege.fr; Tel: +33 4 67 81 63 44
bSuez Environnement Consulting, Parc de l'Ile, 15-27 rue du Port, 92022 Nanterre cedex, France
First published on 27th August 2015
Abstract
More and more cities are dealing with the concurrent trends of water scarcity and growth in water demand. It has thus become imperative to find alternative resources. Both Singapore and Windhoek – two very different cities in terms of the context in which they have to provide water and the options available to them – have addressed this problem by developing efficient operational solutions for supplying water to their populations. It is therefore instructive to compare their approaches, similarities and differences as a means of identifying the possibilities that might be put to use elsewhere in the world. Water reuse, rainwater harvesting, dual reticulation systems, limitation of water losses, and water saving policies are some of the solutions identified as having the potential to significantly improve the water balance in cities. In practice, one quarter of the water used in Singapore and Windhoek is derived from recycled wastewater. In Singapore, most of this reclaimed water is used for industrial needs, whereas in Windhoek, it is used for drinking purposes. However, other potential problems need to be addressed such as energy consumption and the population's ability to pay for their water supply. Indeed, in Singapore, the energy consumption for water production is on the rise, mainly on account of the treatment processes used, and it is imperative to halt this trend. In Windhoek, on the other hand, a critical issue – potentially affecting the sustainability of the water supply system – is the population's ability to pay. There is every indication therefore that water reuse may be part of the solution for supplying water in water-stressed contexts. A comparative study of the urban water cycles in Windhoek and Singapore sheds light on the importance of addressing the issue of water reuse within a framework that is broader than a strictly technical approach. Closing the water loop is always undertaken along with water demand reduction policies combining education, information and financial incentives, and with urban planning and land use control in order to protect water resources and expand storage capacities.
Water impactMore and more cities are dealing with the concurrent trends of water scarcity and growth in water demand. Both Singapore and Windhoek, two very different cities, have addressed this problem by developing efficient operational solutions for supplying water to their populations. These solutions are applicable in a diverse range of contexts: rich and poor cities, temperate and tropical climates, as well as uniformity and diversity of population and housing. In the context of global warming, water reuse has emerged alongside water demand management as one of the key solutions for meeting water needs going forward, and Singapore and Windhoek have some valuable lessons to offer when it comes to implementing such solutions. |
A Introduction
As water demand rises around the world, water resources are becoming increasingly overexploited. In many parts of the world – in the summer months if not all year round – global warming is set to exacerbate the problem of water availability. One of the main concerns is the water demand in urban areas. Indeed, the global trend of population concentration in cities in tandem with an expanding global middle class is set to drive up urban water demand, with the domestic demand predicted to rise by 50% between 2010 and 2030.1Against this background, a critical issue is to identify how to reduce water demand and how to limit the abstraction of water from conventional natural sources such as lakes, rivers and aquifers. One of the options often considered is desalination. However, two factors may potentially preclude the use of this technology.
The first factor is the distance between the points of consumption and the sea.2 For cities located a long way from the sea, the cost of transferring water may lead to other options being adopted. This also holds true for other supply sources. In California, for example, energy requirements for water transfer systems can be as great as 4 kW h m−3.3
The second factor that may potentially rule out the use of desalination is the cost and availability of energy. Where energy is expensive or less available, desalination may not be a viable option, for, despite having decreased significantly, the amount of energy required to produce one cubic metre of drinking water from seawater is still in the 2.5–8 kW h m−3 range – around 4 kW h m−3 on average, as compared to 0.5 kW h m−3 for water produced from lakes, rivers or underground sources.3–5
Indeed, the energy requirements of desalination make it one of the most expensive sources of freshwater, which is why many research programmes are looking for ways to minimize the energy costs. One way of achieving energy savings is the cogeneration of energy and water,2 while research centres in Singapore and elsewhere are looking at producing membranes with lower energy requirements.6 Further opportunities for energy savings are to be found within the urban water cycle itself.5 With global energy prices set to increase over the long term, the issue of cost will be even more critical going forward.
As a consequence, other options have to be considered such as a small-loop approach to the water cycle and the demand-side management of water.7–11 The cities of Singapore and Windhoek have many lessons to offer in this respect. Both have limited water resources of their own and both have developed their own unique solutions to address water scarcity. The fact that these solutions are being implemented in completely different contexts opens up a wide range of possibilities for adapting water management solutions to the specifics of other cities around the world.
This paper presents the specific characteristics of water management in the two cities and then goes on to look at the lessons that can be learned in each instance. This approach has also been adopted in the Syracuse project,11 with the aim of identifying the potential for small loops and synergies in the water, energy and waste cycles.
B Singapore
Singapore is an island city-state situated close to the Malaysian border. With 5.4 million people12 concentrated in an area of 716 square kilometres, its population density is high. At the time of its independence in 1965, most of Singapore's water was supplied by the state of Johor in Malaysia under a bilateral agreement (which capped the volume of water provided at 141 Mm3 per year in the first stage, then 415 Mm3 per year up to 2061). But with memories of the catastrophic situation faced during the Japanese invasion in 1942, it has long been Singapore's wish to avoid dependency on water from a foreign source. Moreover, the continuous economic and population growth since its independence has led to a concomitant growth in the demand for water and energy. But whereas the supply of energy is ensured by a home-grown petroleum industry and the city's status as the world's second busiest commercial port, there are no such factors to ensure water security. This has long been a critical issue for the government and for the country's Public Utilities Board (PUB),6,13 as a result of which Singapore has striven to develop its own water resources since its independence.14–17 But such has been the rise in water demand that the task has been a massive one. Indeed, with the population, per capita water consumption and industrial demand growing all at the same time, the total demand rose from 100 Mm3 per year in 1962 to 455 Mm3 per year in 2000 and around 600 Mm3 per year in 2010 (see Fig. 1).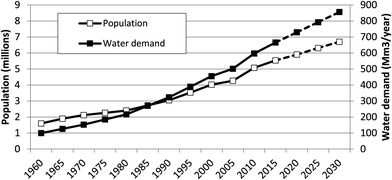 | ||
| Fig. 1 Population and water demand in Singapore.18 | ||
Against this background, Singapore has adopted a water policy with two main objectives: reducing the water demand and increasing the availability of water.
Reductions in water demand have been achieved by means such as incentive-based billing, communication campaigns and water-saving devices.17 These actions have been successful in stemming the rise of per capita domestic water consumption (Fig. 2), which peaked at 175 l per capita per day in 1994 before dropping steadily to 152 l per capita per day in 2012. The current objective is to stabilize the consumption at around 140 l per capita per day by 2030.17,19
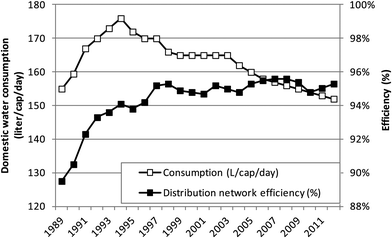 | ||
| Fig. 2 Per capita domestic water consumption and distribution network efficiency in Singapore.18 | ||
When it comes to reducing water losses, the distribution network efficiency has been stabilised at around 95% – an impressive result compared to levels found in other cities of the world. Singapore is accordingly on a par with Paris20 and Phnom-Penh21 on this parameter, whereas average water losses worldwide (as estimated by the World Bank in 2006) are in the 35% range and 15% in developed countries.22 By way of comparison, Non-Revenue Water (NRW) levels were estimated at 42% in Manila in 2011,23 25% in Bangkok in 2012,24 and 39% in Jakarta in 2014.25
Singapore's four main supply sources of water, known as the Four National Taps, are detailed below (Fig. 3).
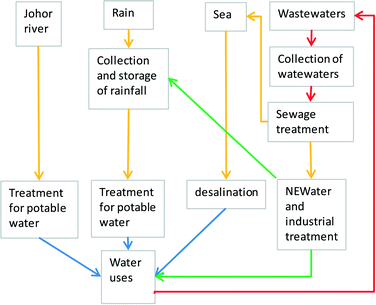 | ||
| Fig. 3 The urban water cycle in Singapore (red: wastewater, yellow: raw water, green: treated water for non-potable uses, blue: drinking water). | ||
The first source of water is imported water from Johor. A supply source used by Singapore for many years now, the raw water imported from Malaysia meets roughly 40% of Singapore's current needs (250 Mm3 per year). The government's objective is to minimize the amount of water supplied from this source by 2061.
The second source of water is rainwater harvesting. Singapore receives roughly 2400 mm of rainfall per year. A harvesting policy covering a large part of the watershed has led to some major urban planning adjustments (involving rebuilding parts of the city and relocating residents and industries to improve the collection of water), as well as measures such as storing water in purpose-built reservoirs (17 in 2013), protecting water bodies to prevent the deterioration of supply sources and building new water treatment plants. Strict regulations and controls have also been introduced to support these measures.15,17,26,27 With the recent addition of the Marina, Punggol and Serangoon reservoirs, the amount of water supplied by this source has increased to 150 Mm3 per year for water collected from two-thirds of the total watershed area, the long-term target being to harvest rainwater from 90% of the catchment area.
The third source of water is reclaimed water. Going by the name of NEWater, this consists of water produced by a combination of microfiltration, reverse osmosis and UV treatment.28 In 2012, the total NEWater production was 110 Mm3 per year, catering for roughly 18% of the total water demand and 32% of industrial and commercial needs.12 2% of this reclaimed water is sent to rainwater storage tanks for treatment to drinking water standards. Municipal effluent is also reused (at a rate of 25 Mm3 per year), more specifically to supply the petrochemical industry in Jurong Island.
The fourth source of water is seawater desalination. Two desalination plants were built in 2005 and 2013 and used microfiltration and reverse osmosis with production capacities of 50 Mm3 and 115 Mm3 of water per year, respectively. As this process is highly energy-consuming, the plants are used essentially as backup facilities to handle spikes in demand.
The following are examples of prices charged for a cubic metre of drinking water produced from each of the four supply sources:29,30 S$ 0.78–US$ 0.49 (indexed to the price of oil and the inflation rate) for water from the Tuas desalination Plant in 2003; S$ 0.45–US$ 0.35 for water from the Tuas II desalination Plant in 2013; S$ 0.3 for water from the Ulu Pandan NEWater Plant in 2007; and S$ 0.3 for water supplied by the Changi NEWater Plant in 2009. Moreover, the price of raw water from Johor as established under the 1961–1962 agreement between Singapore and Malaysia was US$ 0.0026 per m3 (at the 2012 exchange rate).
Against this background, estimates suggest that increasing the share of local resources in the water balance will drive up energy consumption in the water cycle from 0.66 kW h m−3 in 2012 to 1.31 kW h m−3 by 2030.6 For this reason, Singapore is looking for ways to reduce the energy footprint of water at each stage of the water cycle.
Replacing part of the activated sludge process (aeration and final clarification) and the RO pre-treatment process (microfiltration or ultrafiltration) with a membrane bioreactor (MBR) in the NEWater production process will reduce the energy requirement of wastewater reclamation.6,31 The ongoing rehabilitation of the wastewater system and current research on ways of improving the sludge digestion process are also factors that will help the wastewater sector to reduce its energy footprint.32
Yet another solution adopted is to increase the overall rainwater catchment area to up to 90% of the total land area through the use of Variable Salinity Plants. The average energy consumption of these plants, which treat brackish water from undammed estuaries, is 1.9 kW h m−3, and eight suitable sites have already been identified by Singapore's national water agency.33
In the longer term, Singapore is counting on biomimetic technologies to achieve energy consumption levels of 0.75 kW h m−3 in desalination.6,34
Lastly, the city-state is moving in the direction of greater integration of the water and energy sectors. The new Tuas desalination plant houses a 411 MW power plant whose capacity exceeds that required for water production. Although the facility does not actually reduce the energy footprint of desalination, it may, by generating surplus energy, help reduce the energy costs associated with desalination.35 Additional energy sources for desalination such as geothermal energy are also being considered.36
C Windhoek
Windhoek is the capital city of Namibia, a country which borders with South Africa. The city lies at an altitude of 1500 m, with a 2012 population of 300![[thin space (1/6-em)]](https://www.rsc.org/images/entities/char_2009.gif) 000 (up from 100
000 (up from 100![[thin space (1/6-em)]](https://www.rsc.org/images/entities/char_2009.gif) 000 in the 1980s) and a surface area close to that of Singapore, and has a population density 20 times lower than that of the latter. From a social standpoint, the city still reflects the legacy of apartheid, with suburbs classified by housing typology. The low-income population thus tends to be concentrated in the northern and western parts of the city, while the high-income neighbourhoods are located in the south and east. Against this background, water demand is continually escalating (up from 6 Mm3 per year in 1968 to 27 Mm3 per year in 2012) but there are very few local resources to cope with this trend: groundwater sources contribute only 1.7 Mm3 per year to the water supply, annual rainfall is low (360 mm), evaporation levels are high (up to 50% of the dam storage capacity), while the city has no perennial rivers. In the 1960s, the city embarked on a drive to expand its supply sources, which today consist of surface and underground resources, as well as water reuse (Fig. 4).
000 in the 1980s) and a surface area close to that of Singapore, and has a population density 20 times lower than that of the latter. From a social standpoint, the city still reflects the legacy of apartheid, with suburbs classified by housing typology. The low-income population thus tends to be concentrated in the northern and western parts of the city, while the high-income neighbourhoods are located in the south and east. Against this background, water demand is continually escalating (up from 6 Mm3 per year in 1968 to 27 Mm3 per year in 2012) but there are very few local resources to cope with this trend: groundwater sources contribute only 1.7 Mm3 per year to the water supply, annual rainfall is low (360 mm), evaporation levels are high (up to 50% of the dam storage capacity), while the city has no perennial rivers. In the 1960s, the city embarked on a drive to expand its supply sources, which today consist of surface and underground resources, as well as water reuse (Fig. 4).
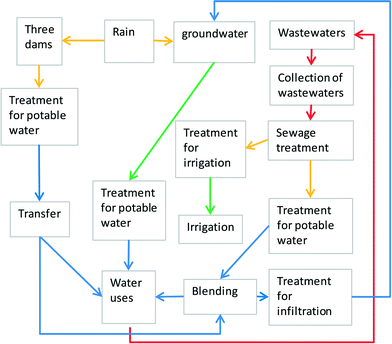 | ||
| Fig. 4 The urban water cycle in Windhoek (red: wastewater, yellow: raw water, green: treated water for non-potable uses, blue: drinking water). | ||
The city's surface water sources consist of the Omatako, Swakoppoort and Von Bach dams, located 60 km to 200 km away from the city, which provide roughly 20 Mm3 of water a year, of which 17 Mm3 is available for Windhoek.37,38 This source of supply is totally dependent on meteorological conditions (explaining the year-to-year variations as seen in Fig. 5). Moreover, the price of the m3 of water supplied by NamWater has increased in recent years, up from N$ 8.29 in 2011–2012 to N$ 9.03 in 2012–2013, N$ 12.94 in 2013–2014 and N$ 14.23 in 2014–2015.39–42
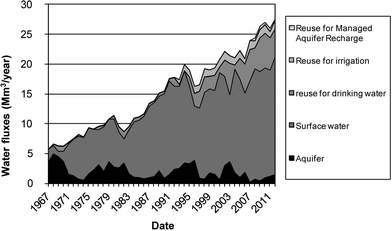 | ||
| Fig. 5 Trends in water production in Windhoek as a function of supply source.18 | ||
The aquifer, which may contribute anything from 0 Mm3 to 5 Mm3 a year to the city's water supply, is located beneath the city (Fig. 5). This source has been improved by the Managed Aquifer Recharge programme recently introduced in the southern part of the city – an initiative in which human activity is controlled to prevent the contamination of groundwater.
In the sphere of water reuse, domestic effluent is treated in activated sludge and biofilter systems before being sent to:
• The old Goreangab water reclamation plant (“old GWRP”) built in 1968 with a capacity of 3300 m3 per day and expanded to a capacity of 7500 m3 per day in 1997. The plant was originally used for drinking water purposes, but now produces semi-purified water for the irrigation of the city's parks and gardens (at 1.3 Mm3 per year, the plant's current output accounts for only 8% of total water needs43).
• The new Goreangab water reclamation plant (NGWRP), a 21![[thin space (1/6-em)]](https://www.rsc.org/images/entities/char_2009.gif) 000 m3 per day facility built in 2002,44 incorporates the treatment process shown in Fig. 6. The reclaimed water, which is blended with treated surface water in a ratio of one-third to two-thirds,45 accounted for 26% of the total amount of water produced in 2003.38
000 m3 per day facility built in 2002,44 incorporates the treatment process shown in Fig. 6. The reclaimed water, which is blended with treated surface water in a ratio of one-third to two-thirds,45 accounted for 26% of the total amount of water produced in 2003.38
In rainy years, the surplus potable water is injected into boreholes south of the city after an additional Granular Activated Carbon (GAC) filtration and disinfection treatment to prevent bacterial growth and clogging.
Alternative supply sources considered by the end of the 1990s included pumping from the Tsumeb aquifer (located 490 km from the city), pumping from the Okavango river (750 km from the city), Managed Aquifer Recharge (MAR) in the southern part of Windhoek (offering storage possibilities of up to 11 Mm3 per year), and additional treatment to increase the proportion of reclaimed water in the treated water mix. Table 1 presents water treatment costs and energy consumption per m3. MAR clearly emerges as the optimal solution, providing, for a relatively low cost, an aquifer-based storage capacity of between 33 Mm3 and 60 Mm3.43,46,47 Ideally, these processes should be improved to address groundwater quality issues (salinity, nitrate and Dissolved Organic Carbon levels, among others),38,45 a possible solution being the use of membrane technologies.
| Options | Distance (km) | Energy consumption (kW h m−3) | Treatment cost (euro per m3) |
|---|---|---|---|
| NB: Energy consumption is given for water treatment and conveyance up to the entrance of the water distribution system. | |||
| Current supply sources | 0 to 200 | 0.8 to 1.5 | 0.35 to 0.95 |
| Okavango river | 750 | 4.94 | 3.33 |
| Tsumeb aquifer | 490 | ND | 2.22 |
| Reclaimed water with additional water treatment process | 0 | 1.8 | 1.26 |
| Managed Aquifer Recharge at Windhoek | 0 | 1.78 | 1.2 |
D Comparison of the situations in Singapore and Windhoek
Table 2 sums up the main lessons that can be drawn from the study of the two cities. The context in which water is supplied differs considerably. Singapore has a high population density, whereas Windhoek has a low one (an important factor when it comes to the financial viability of capital investments and to the efficiency of the distribution system, given the impact on Non-Revenue Water and energy consumption levels as well as the cost of distributed water and the viability of installing alternative systems such as dual reticulation systems, for example). Singapore is close to the sea (facilitating desalination), whereas Windhoek is located inland, precluding the use of this technology. Singapore has a high level of rainfall and a dependable supply of water via the Straits of Johor, whereas Windhoek is located in a semi-desert environment.| Singapore | Windhoek | |
|---|---|---|
| Objective | To be self-sufficient | To meet the needs of the population |
| Water sector organisation | Entire urban water cycle managed by the PUB, presence of a top-class private and academic water sector | Entire urban water cycle managed by the CoW, high level of expertise within the municipality |
| Economic constraints | An increasingly wealthy population, thus strong capacity to invest | Limited capacity to invest in conjunction with growing CAPEX and OPEX requirements |
| Cost of feasible solutions | On the rise because the water produced today is more expensive to produce (in both CAPEX and OPEX terms) | On the rise because the water produced today is more expensive to produce (in both CAPEX and OPEX terms) |
| Impacts on energy consumption | Increasing because of desalination and water reuse needs | Increasing because of the need to increase water treatment and pumping |
| How the problem has been/is being solved | Improving energy efficiency in the technologies used | Developing alternative local resources |
| Possible improvements | Promotion of synergies between water and energy cycles | Reduction of water losses in the informal suburbs |
| Greater energy efficiency at wastewater treatment plants | ||
| Limitations | Energy dependency | Changes in water quality in reuse loops that necessitate the use of membrane technologies to increase reuse capacities |
| Capacity to improve technologies at the same time as water needs increase | Need to consider long-distance transfers if the population continues to grow | |
| Capacity to finance water services in the event of continuing growth of the poorest segment of the population |
In both cities, the water authority is responsible for water supply, wastewater collection and treatment, and rainwater and resource management. Although an integrated organizational structure of this kind is not essential in closing the water loop, its simplicity facilitates a joined-up approach to the urban water conundrum. Singapore has also been successful in forging a dynamic private water sector in which domestic and foreign companies work with local universities to drive innovation and the development of best-available-technologies.
As a city-state, Singapore provides a setting conducive to uniform policies when it comes to water management, urban planning, regulation and pricing, while rising GDP facilitates water management through higher capital investment and water tariffs. In Windhoek however, although the CoW (City Of Windhoek) has a substantial degree of autonomy, the decision-making process is in part constrained by central government policies and social acceptance in a post-apartheid context. A key issue is the supply of water to people in low-income areas. In these areas, the population has tended to grow, in part due to migration from rural areas. So with low-income people accounting for a growing share of water demand, there is a growing risk of financial instability in the system – a risk that is all the more critical in the context of the rising price of water supplied by NamWater, as mentioned above.
The solutions adopted are a consequence of these contextual factors. Since its independence, Singapore has embarked on a huge programme of resizing its urban infrastructure in order to collect, store and protect rainwater, and to collect and treat wastewater. The creation of estuary dams is just one example of such infrastructure projects. As a rich city with a wealthy population, Singapore has the resources needed to finance these huge capital work programmes.
Windhoek faces a more complicated situation. Its sole options are to bring in water from distant locations (500 km to 800 km away) and foot the associated transfer bill or to increase the reclaimed portion of the treated water (necessitating increasingly complex and costly treatment processes). To make water more affordable, the CoW has continually striven to optimize the urban water cycle. Since roughly 50% of the water stored in dams is lost through evaporation, it has made sense to store part of this water in an aquifer. This type of storage was found to be feasible beneath the city of Windhoek, which is why the CoW took the decision to recharge the aquifer with the surplus water obtained in rainy years and to store it for use during the dry years. The result is a low-investment solution to the water demand equation for the coming 5 to 10 years.
The second part of the solution has involved reducing water losses and water demand. When it comes to water losses, the CoW has initiated a programme of leak detection, resulting in a distribution system efficiency of currently around 89–90%, an impressive level given the city's low population density. The CoW's aim is to improve the efficiency by a further 4%, with the focus on the poorest parts of the city where losses are likely to be higher. The third part of the solution is the use of membrane technologies for water reuse purposes. This will indeed be necessary if the plan is to increase the share of reclaimed water in the water mix – an area in which Singapore can be considered a precursor.
While Singapore can be considered a precursor in the field of membrane treatment processes, Windhoek merits attention as a precursor in the reuse of wastewater for drinking purposes. Whereas in most cities the possibility of using wastewater for drinking water production runs into problems of acceptability among the population,48 the CoW has been reusing wastewater for some 40 years now with the approval of its citizens. Singapore, for example, reuses a huge part of its wastewater but only 2% of this is used as drinking water at present, the rest being sent to industrial facilities. Over time, Singapore is planning to increase the proportion of reused water in its distribution system as a key route to meeting its objective of water self-sufficiency.
Despite the significant differences between the two cities in terms of the context in which water is supplied and the approaches adopted for water management, there are many areas in which similarities can be identified.
Both cities are developing and using efficient technologies for treating and reusing wastewater
In the case of Singapore, such technologies make it possible to meet the demand of a thriving industrial sector (which accounts for half of all water needs). In the case of Windhoek, the reclaimed water is used mainly for drinking purposes (Fig. 4 and 5). In both cases, membrane technologies are targeted (both in wastewater treatment plants and as a final stage of drinking water treatment). With the aim of reducing the risk of pathogen transfer (helminth eggs and chlorine-resistant pathogens, for example), some critical issues (emerging toxicants and water salinity) will need to be addressed over the long term. Indeed, the increase in dissolved ion concentrations in the water may result in non-compliance with drinking water standards. To address this risk, membrane technologies (nanofiltration, inverse osmosis) must be included in the treatment process but this has the effect of increasing energy consumption in the water cycle. Lenouvel et al.6 demonstrated that both desalination and NEWater processes would drive up energy usage in the water treatment process in Singapore, on a like-for-like basis in terms of the technologies used. The PUB is aware of this trend, which is why Singapore is investing heavily in technology improvements and breakthroughs, with the aim of reducing energy usage in desalination from the current level of 4 kW h m−3 to 1.5 kW h m−3, 20 years from now.19 Another possible option is to produce energy at wastewater treatment plants. At present, the energy needs for water production in Windhoek are in the 1.8 kW h m−3 range. This requirement will grow once more membrane technologies are added into the equation (only ultrafiltration is used at present, as shown in Fig. 6), but Windhoek will most certainly have the opportunity to take advantage of the improvements in membrane technologies to limit the associated energy consumption.Both cities use a dual reticulation system to handle treated water streams of different qualities
Since 1992, Windhoek has had a reticulation system used specifically for the irrigation of parks and for cement plant needs. This uses treated effluent from the old Goreangab water reclamation plant. Singapore, on the other hand, has a NEWater distribution system mainly designed for industrial uses, and an industrial water distribution system in Jurong Island. At the same time, Singapore has managed to limit the footprint of these industrial networks by concentrating its industrial activities in specific parts of the city. These dual reticulation systems make it possible to adapt water quality and treatment processes to water uses, as well as to maximise the benefits of reuse.Both cities are aiming to reduce water losses
With efficiency levels of around 95%, Singapore has performed impressively on distribution system efficiency over the past 15 years. With levels close to 90%, Windhoek has also performed well but there is room for improvement of 3% to 4% – a target that the city is working hard to achieve.Both cities are seeking to reduce household water consumption
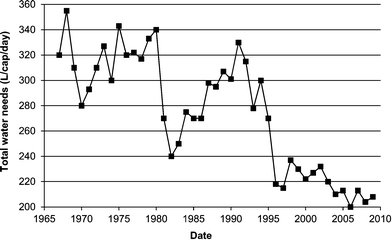
This is achieved by a combination of measures. First, the use of an incentive water pricing policy, which entails investing in meters at the household level (household metering also helps reduce water usage, due to people's awareness of the direct link between their consumption and their bill). Second, the use of communication campaigns encouraging restraint among users in the context of water scarcity. Such campaigns tend to be more effective when there is a real and present risk of water shortage, with people going back to their old habits once the crisis is over. Windhoek is no exception in this respect as can be seen in Fig. 7. The strong decline in per capita water consumption in the early 1980s occurred during a dry-weather episode but water demand rose again with the return of the wet weather. For this reason, communication campaigns must be frequently renewed as is the practice in Singapore. Singapore has even been an innovator when it comes to raising public awareness,17 for instance by organizing a water-rationing exercise involving the interruption of the water supply to 30![[thin space (1/6-em)]](https://www.rsc.org/images/entities/char_2009.gif) 000 households for 14 hours a day. The third sphere of action is pricing policy. This is used effectively in Windhoek in the form of a progressive water tariff and monthly billing, and by adjusting tariff thresholds in the case of low water availability. This system is highly flexible and can be easily adjusted in the event of a water crisis. Singapore's pricing policy tools have included the Water Conservation Tax (levied between 1991 and 1997) followed by the integration of the marginal cost of water.17 Because water tariffs have stayed the same since 2000 in conjunction with a rise in GDP, the city has had the possibility of raising tariffs if necessary.
000 households for 14 hours a day. The third sphere of action is pricing policy. This is used effectively in Windhoek in the form of a progressive water tariff and monthly billing, and by adjusting tariff thresholds in the case of low water availability. This system is highly flexible and can be easily adjusted in the event of a water crisis. Singapore's pricing policy tools have included the Water Conservation Tax (levied between 1991 and 1997) followed by the integration of the marginal cost of water.17 Because water tariffs have stayed the same since 2000 in conjunction with a rise in GDP, the city has had the possibility of raising tariffs if necessary.
Both cities have adjusted their regulations and standards to fit their needs
It is indeed imperative that regulations be compatible with needs. In many countries, the reuse of reclaimed water for drinking purposes is prohibited for instance. Moreover, the use of water-saving devices must be promoted or imposed. In Singapore, the introduction of dual-flush low-capacity toilets in 1994 has strongly contributed to the reduction of household water consumption.17 Singapore has also promoted the use of devices to limit the flow rates at water fittings in homes. In Windhoek, the regulation of outdoor uses (e.g. garden irrigation, swimming pool filling and car washing) is one of the main mechanisms imposed by CoW for reducing water consumption.37It is through a combination of these measures that the cities of Singapore and Windhoek have brought their per capita water usage down to 152 l per day and 155 l per day, respectively – in both cases achieving roughly a 20% to 30% reduction in the total water consumption (Fig. 7 covers all water uses including municipal and commercial uses (roughly 20%) and water losses (10%), whereas Fig. 2 includes only domestic consumption).
A key issue is the need to reduce energy consumption in the water cycle. Singapore's goal of water self-sufficiency has indeed pushed up its energy requirements as demonstrated clearly by Lenouvel et al.6 Reducing energy consumption in the water cycle has thus become imperative for Singapore, and the city has embarked on a huge programme of energy savings (achieved by means such as improved membrane technologies and energy recovery in wastewater treatment plants). Reducing energy usage is also a key objective for CoW, since it directly impacts the cost of water as seen in Table 1. Most cities that have adopted water reuse technologies have to address the need to optimise energy usage in the water cycle, and both Singapore and Windhoek have made substantial progress in this direction.
E Conclusion
The cities of Singapore and Windhoek have been dealing with water scarcity for more than 50 years now, even as their populations and, by extension, water requirements have been increasing. The methods that the two cities have adopted to address this conundrum are highly instructive for other cities facing water supply issues and/or having to deal with water crises in the context of global warming. Key strategies consist of curbing the demand (by reducing losses, curbing luxury demand and promoting the use of water-saving equipment), employing reused water loops (rainwater harvesting, water reuse, etc.), optimising the use of water resources (by conventional or alternative methods), promoting underground storage (as in Windhoek) or aboveground storage (as in Singapore) to ensure the supply of water in dry years, developing appropriate regulations (governing aspects like tariff structures and the use of alternative resources, and wastewater and rainwater reuse in particular) and running communication campaigns targeting the general public.Windhoek's approach to water management is particularly insightful as it demonstrates that even in a stressed environment and with a large poor population, there are indeed feasible solutions to meet the population's water needs, flexibility and pragmatism being the bywords for effective water management. Singapore is a leading light when it comes to technological research, while providing a good example of how urban planning and water management can be interlinked.
These two complementary cases provide some valuable insights and demonstrate the need to adapt solutions to local contexts and constraints. Although very different in terms of their economic, social, urban and water contexts, Singapore and Windhoek show that success in closing the water loop is not only a technical matter, but that water reuse has to be integrated in a more comprehensive policy, involving a savvy mix of urban planning and land use control, water demand reduction and development of investment capacities.
Acknowledgements
Our special thanks go to the people of PUB in Singapore and to the CoW and NamWater in Windhoek for their constructive input and help. We would also like to thank the partners in the SYRACUSE project (LATTS, Science Po, CIRSEE, EXPLICIT, Plaine de France Development Corporation, and SAFEGE), and in particular Morgan Mouton for his insights into political, social and organisational issues in Windhoek.Notes and references
-
2030 Water resources group, Charting our water future. Economic frameworks to inform decision making, 198 pages, http://www.google.fr/url?url=http://www.mckinsey.com/~/media/mckinsey/dotcom/client_service/sustainability/pdfs/charting%2520our%2520water%2520future/charting_our_water_future_full_report_.ashx&rct=j&frm=1&q=&esrc=s&sa=U&ved=0CBQQFjAAahUKEwicuuSX-6LHAhXDvRQKHR17AaE&usg=AFQjCNEZm0aVYg_KUOyTIswgV3icv6z-eA, 2009 Search PubMed
.
- WWAP (United Nations World Water Assessment Programme), The United Nations World Water Development Report 2014: Water and Energy, 230 pages, UNESCO, Paris, 2014 Search PubMed.
-
G. Olson, Water and energy: Threats and Opportunities, IWA Publishing, London, 2012 Search PubMed
.
-
WBCSD, Water, energy and climate change: A contribution from the business community, WBCSD, Geneva, 20 pages, http://www.wbcsd.org/pages/edocument/edocumentdetails.aspx?id=40&nosearchcontextkey=true, 2009 Search PubMed
.
-
M. Lafforgue, Water and energy in the city: the inseparable resources. Presented at the European utility week, Amsterdam, 4–6th November, 2014, http://www.engerati.com/on-demand/water-and-energy-city-inseparable-resources/7023 Search PubMed
.
- V. Lenouvel, M. Lafforgue, C. Chevauché and P. Rhétoré, The energy cost of water independence: the case of Singapore, Water Sci. Technol., 2014, 70(5), 787–794 CrossRef PubMed
.
-
P. R. Brown, AICP, The importance of water infrastructure and the environment in tomorrow's cities, in Cities of the future – Towards integrated sustainable water and landscape management, ed. V. Novotny and P. Brown, IWA publishing, 2007, pp. 2–7 Search PubMed
.
-
A. Speers, Water and cities – overcoming inertia and achieving a sustainable future, in Cities of the future – Towards integrated sustainable water and landscape management, ed. V. Novotny and P. Brown, IWA publishing, 2007, pp. 18–31 Search PubMed
.
-
G. Daigger, Integrating water and resource management for improved sustainability, in Cities of the future – Water infrastructure for sustainable communities, ed. X. Hao, V. Novotny and V. Nelson, IWA publishing, 2010, pp. 11–21 Search PubMed
.
-
W. P. Lucey, C. L. Barraclough and S. E. Buchanan, Closed loop water and energy systems: implementing nature's design in cities of the future, in Cities of the future – Water infrastructure for sustainable communities, ed. X. Hao, V. Novotny and V. Nelson, IWA publishing, 2010, pp. 59–70 Search PubMed
.
- M. Lafforgue, V. Lenouvel and C. Chevauche, The Syracuse Project: a global approach to the management of water uses in a urban ecosystem, Gas-Wasserfach, Wasser-Abwasser, 2013, 154-S1, 72–78 Search PubMed
.
- SingStat, Key Indicators, http://www.singstat.gov.sg, Last accessed on 31 July 2014
.
- M. Lafforgue, V. Lenouvel, C. Chevauche and P. Rethore, Towards water energy symbiosis in urban networks: the case of Singapore, (11 pages), Proceedings of the 7th IWA international conference on Efficient Use and Management of Water, Paris, 2013 Search PubMed.
-
D. Segal, Singapore's Water Trade with Malaysia and Alternatives, Masters Thesis, submitted to John F. Kennedy, School of Government, Harvard University Press, 2004 Search PubMed
.
- P. O. Lee, Water Management Issues in Singapore. Proceedings of the conf. Water In Mainland Southeast Asia, Siem Reap, Cambodia, 2005 Search PubMed.
-
C. Tortajada, Singapore: an Exemplary Case For Urban Water Management, Case Study for the 2006 HDR, http://waterwiki.net/images/c/cb/UrbanWaterMSingapore.pdf, 2006 Search PubMed
.
-
C. Tortajada, Y. Joshi and A. K. Biswas, The Singapore water story. Sustainable development in an urban city state, Routledge, Taylor and Francis group, 2013 Search PubMed
.
- M. Lafforgue and V. Lenouvel, Comment Singapour et Windhoek adaptent les cycles urbains de l'eau pour surmonter leur dépendance hydrique, Tech., Sci., Methodes, 2015, 5, 66–85 Search PubMed
.
- A. K. Puah, Smart water – Singapore case study, smart water cluster workshop. Presented at the IWA-ASPIRE conference, Tokyo, 2011 Search PubMed.
- B. Nguyen, Sustainable and efficient use of Non-Potable water in Paris (10 pages). Proceedings of the 7th IWA International conference on Efficient Use and Management of Water (efficient 2013), Paris, France, 2013 Search PubMed.
- M. Vermersch, E. Sonn Chan and P. Vaughan, Are we going to win the war against NRW?, Water, 2012, 21, 57–59 Search PubMed
.
-
B. Kingdom, R. Liemberger and P. Marin, Non-Revenue Water (NRW) in Developing Countries. How the Private Sector Can Help: A Look at Performance-Based Service Contracting (52 pages), Water supply and sanitation sector board discussion paper series,
paper n°8, The World Bank, http://siteresources.worldbank.org/INTWSS/Resources/WSS8fin4.pdf, 2006 Search PubMed
.
-
J. Horovitz, Miya urban water efficiency. Performance based contracts for NRW: The case study of Manilad Water Services Manila. Presented at the conference on Promoting PPPs in the water sector, Nairobi, 7th–8th November, 2012, http://www.snvworld.org/sites/www.snvworld.org/files/documents/performance_based_contracts_for_non_revenue_water_by_joel_horovitz_business_dev._director_emea.pdf Search PubMed
.
-
Y. Arpaichiratana, Management of water quality issues in the recent floods in Bangkok, http://www.wsportal.org/uploads/IWA%20Toolboxes/WSP/Asia%20pacific/MWA%20Flood%20___(__)%20Philippines.pdf, 2012 Search PubMed
.
- Palyja, Palyja in figures, http://en.palyja.co.id/profile/key-figures/, 2014
.
- L. S. Chia, K. Habibullah and L. M. Chou, The coastal environmental profile of Singapore (92 pages), Technical Report 21, International Center for Living Aquatic Resources Management publishing, Manila, 1988 Search PubMed.
-
B. Harley, Singapore's marina barrage and reservoir – changing mindsets in urban solutions, in Cities of the future - Water Sensitive Cities, ed. C. Howe and C. Mitchell, IWA publishing, 2012, ch. 11, pp. 147–154 Search PubMed
.
-
L. Mong-Hoo and H. Seah, NEWater: A key element of Singapore's water sustainability, in Milestones in water reuse, the best success stories, ed. V. Lazarova, T. Asano, A. Bahri and J. Anderson, IWA publishing, 2013, ch. 3, pp. 53–62 Search PubMed
.
- D. Sanmuganathan, PUB Singapore's Experience in Public-Private Partnership (PPP) Projects (30 pages). Proceedings of the conference on Public-Private Partnership in Enhancing Service Delivery, CAPAM Biennial Conference 19 – 22 Oct 2008, 2009 Search PubMed.
-
GWI, Market Leading Analysis of the International Water Industry (7 pages), http://www.globalwaterintel.com/pinsent-masons-yearbook/2012-2013/part-ii/28/, 2013 Search PubMed
.
- G. Tao, K. Kekre, B. Visvanath, M. H. Oo and H. Seah, Membrane bioreactor for water reclamation in Singapore, Water Pract. Technol., 2008, 3(2) DOI:10.2166/wpt.2008.040
.
- PUB, Putting the power of used water to work. Innovation in water, An R&D publication of PUB, Singapore's national water agency, Singapore, 2012 Search PubMed.
- PUB, Shoring up a sustainable water supply. Innovation in water, An R&D publication of PUB, Singapore's national water agency, Singapore, 2012 Search PubMed.
- PUB, Water for all, conserve, value, enjoy. Meeting our water needs for the next 50 years, PUB, Singapore, 2013 Search PubMed.
-
GWI, The influence of power over water, Global Water Intelligence online, 12(3), http://www.globalwaterintel.com/global-water-intelligence-magazine/archive/12/3/general/influence-power-over-water.html, 2011 Search PubMed
.
- L. S. Z. Michelle, A. Palmer, G. Oliver and H. Tjiawi, Geothermal desalination in Singapore, The Institution of Engineers, Singapore, Journal Part A: Civil & Structural Engineering, 2013, 6(1), 42–50 Search PubMed
.
- B. Van der Merwe, Implementation of integrated water resource management in Windhoek, Namibia (9 pages). Proceedings of the 4th Conference of the IAHR, Namibia, 1999 Search PubMed.
-
B. Van der Merwe, Closing the urban water cycle integrated approach towards water reuse in Windhoek, Namibia, in Urban Water security: managing risks, Urban water series –UNESCO-IHP, ed. B. Jimenez and J. Rose, Taylor and Francis, 2009, pp. 221–236 Search PubMed
.
-
COW, Tariff booklet 2011–2012 (68 pages), http://www.windhoekcc.org.na/documents/505_tariff_booklet_2010-2011.pdf, 2011 Search PubMed
.
-
COW, Tariff booklet 2012–2013 (67 pages), http://www.windhoekcc.org.na/documents/266_tariff_booklet_2012-2013.pdf, 2012 Search PubMed
.
-
COW, Tariff booklet 2013–2014 (90 pages), http://www.windhoekcc.org.na/documents/4e6_cow_-_000589_-_df_-_costing_&_budgeting_-_tariffs_2013-14.pdf, 2013 Search PubMed
.
-
COW, Tariff booklet 2014–2015 (72 pages), http://www.windhoekcc.org.na/documents/0e5_tariff_booklet_2014_2015.pdf, 2014 Search PubMed
.
- B. Van der Merwe, H. Drews and I. Peters, Securing water supply to Windhoek through unconventional resources, 9th IWA water reuse conference, Windhoek, 2013 Search PubMed.
-
J. Lahnsteiner, P. Du Pisani, J. Menge and J. Esterhuizen, More than 40 years of direct potable reuse experience in Windhoek, in Milestones in water reuse, the best success stories, ed. V. Lazarova, T. Asano, A. Bahri and J. Anderson, IWA publishing, 2013, ch. 29, pp. 351–364 Search PubMed
.
- B. Van der Merwe, J. Haarhoff and J. Menge, Wastewater treatment and reuse: a potential source for potable water supply augmentation (17 pages). Proceedings of the National Water Forum/Conference on Water Resources Management, Gaborone, Botswana, 2006 Search PubMed.
-
R. Murray, B. Van der Merwe, D. Louw and J. Menge, The Windhoek Managed Aquifer Recharge Scheme: Conception, implementation, operation and expansion, Presented at the 9th IWA water reuse conference Windhoek, October 2013, pp. 27–31 Search PubMed
.
- I. Peters, Windhoelk managed aquifer recharge. Presented at the 9th IWA water reuse conference Windhoek, 2013 Search PubMed.
-
M. Po, J. D. Kaercher and B. E. Nancarrow, Literature review of factors influencing public perceptions of water reuse, Land and Water Technical Report 54, CSIRO publisher, 2003 Search PubMed
.
| This journal is © The Royal Society of Chemistry 2015 |

