O,S-Chelated bis(pentafluorophenyl)boron and diphenylboron-β-thioketonates: synthesis, photophysical, electrochemical and NLO properties†‡
Anna Chandrasekar
Murali
 a,
Rudrashish
Panda
b,
Ramkumar
Kannan
 a,
Ritwick
Das
 *bc and
Krishnan
Venkatasubbaiah
 *a
*a
aSchool of Chemical Sciences, National Institute of Science Education and Research (NISER), an OCC of Homi Bhabha National Institute, Bhubaneswar-752050, Odisha, India. E-mail: krishv@niser.ac.in
bSchool of Physical Sciences, National Institute of Science Education and Research (NISER), an OCC of Homi Bhabha National Institute, Bhubaneswar-752050, Odisha, India
cOptics and Photonics Centre, Indian Institute of Technology Delhi, Hauz Khas, New Delhi-110060, India
First published on 24th September 2024
Abstract
Boron-β-diketonates are classical emissive materials that have been utilized in various fields, however, boron monothio-β-thioketonates, where one oxygen atom is exchanged for a sulphur atom, have not been explored in detail. To gain a better understanding of this class of materials, we synthesised various aryl substituted monothio-β-diketonate boron complexes with two different aryl substitutions on the boron center and studied their structural, optical and electrochemical properties. Single crystal X-ray analysis revealed that there is considerable deviation in B–O and B–S bond lengths for bis(pentafluorophenyl)boron complexes against diphenyl boron complexes. The bis(pentafluorophenyl)boron complexes have a relatively high absorption coefficient over diphenyl boron complexes. More importantly, a striking difference was observed for the emission behaviour of these compounds. The bis(pentafluorophenyl)boron complexes exhibit weak emission in the solution as well as in the solid state, whereas diphenyl boron complexes do not show any emission in either solution or the solid state. Further, the electrochemical study reveals that diphenyl boron complexes show a reduction potential that is more negative compared to the bis(pentafluorophenyl)boron complexes. The high absorption coefficient of the compounds pointed towards the possibility of high first order hyperpolarizability upon optical excitation, which motivated us to ascertain the nonlinear optical coefficients in the near infrared range, towards applicability of such compounds in optical limiting and switching. The open aperture Z-scan measurements at ultrashort time scales elucidated a few critical features of such compounds towards optical limiting applications.
Introduction
Tetra-coordinated boron based molecules have attracted significant attention in different research areas such as photovoltaics, organic light-emitting diodes, sensors, and organic field-effect transistors.1–20 Owing to their high quantum yields and high molar absorption co-efficient, boron-β-diketonates have been explored as sensors, photochromic materials, multiphoton materials, semiconductors, and polymers.21–36 A minor alteration of boron-β-diketonates culminates in a large variation in the properties.37,38 As a consequence, different strategies have been followed to alter the photophysical properties of boron-β-diketonates; exchange of one oxygen or two oxygen atoms in the β-diketonates with different heteroatoms has been explored by different groups. For example, the Chujo group and Gardinier group explored the photophysical properties of boron-β-ketoiminate and/or diiminates.39,40 Recently, we reported the synthesis of boron-monothio-β-diketonates, and their non-linear optical properties and semiconducting behaviour.17,41 The effect of substituents on the monothio-β-diketonate was explored, keeping bis(pentafluorophenyl)boron as the chelating motif. It was realized that variation of the R-group on the boron-centre (R2B-) also influences the HOMO and LUMO levels of the molecules, and thus helps to tune the photophysical properties.42 This encouraged us to investigate boron monothio-β-diketonates by varying the pentafluorophenyl group with a phenyl group. Herein, we report O,S-chelated bis(pentafluorophenyl) and diphenyl organoboranes of monothio-β-diketonates, their linear and non-linear optical properties and also electrochemical properties.Results and discussion
The bis(pentafluorophenyl)boron monothio-β-diketonates 1 to 4 and diphenylboron monothio-β-diketonates 5 to 8, were synthesized by refluxing tris(pentafluorophenyl)borane and triphenylborane with respective starting materials L1–L4 in dry toluene at 110 °C (Scheme 1). The starting materials L1–L4 were prepared via Claisen ester condensation using NaH in DMF; a methodology similar to the one previously reported in the literature.17,41 All the starting materials (L1–L4) and the boron complexes 1–8 were analysed using NMR spectroscopy, HRMS and X-ray studies (in the case of 1 to 5). The 1H-NMR analysis of starting materials L1–L4, show a singlet for the enolic proton in the chemical shift region of 15–16 ppm. The absence of this enolic proton peak in 1–8 suggests the emergence of the boron chelated compounds. All the bis(pentafluorophenyl)boron complexes 1–4 showed a signal attributed to 11B{1H} at ∼1–2 ppm, and di(phenyl)boron complexes 5–8 at ∼6–7 ppm, corroborating the formation of tetra-coordinated boron. The 19F{1H} NMR spectra of complexes 1–4 revealed three sets of peaks from ∼−163.0 to −134.0 ppm, owing to the distinct environment of fluorine atoms (ortho, meta, and para) associated with –B(C6F5)2.X-ray diffraction structural analysis
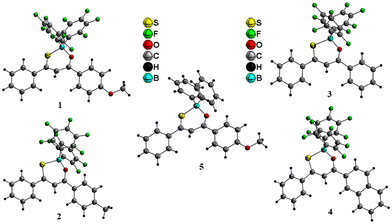
Crystallization of 1–4 from a dichloromethane/n-hexane mixture and 5 from a chloroform/n-hexane mixture provided O,S-chelated boron complexes. Suitable crystals of 1–4 were crystallized in the P![[1 with combining macron]](https://www.rsc.org/images/entities/char_0031_0304.gif) space group whereas 5 was crystallized in the P21/c space group. Representative structural parameters (bond angles and bond lengths) are presented in Table 1 (Tables S3 and S4‡ for optimized DFT structure). The B–O and B–S bond length observed for complexes 1–4 are notably shorter over the bond lengths realized in complex 5 (Fig. 1 and Table 1); which suggests that the electron-withdrawing –C6F5 motif plays a vital role for the observed bond distance variation. A similar trend was realized for the DFT optimized structures of the boron complexes, that is, the B–S and B–O bond lengths are shorter for 1–4 and were elongated in 5–8. The coordination geometry around the boron center is distorted tetrahedral and the six membered ring (C3SOB) formed by the boron chelation adopts a twisted confirmation with a boron atom deviation of 0.62 Å for 1, 0.55 Å for 2, 0.49 Å for 3, 0.49 Å for 4, and 0.57 Å for 5.
space group whereas 5 was crystallized in the P21/c space group. Representative structural parameters (bond angles and bond lengths) are presented in Table 1 (Tables S3 and S4‡ for optimized DFT structure). The B–O and B–S bond length observed for complexes 1–4 are notably shorter over the bond lengths realized in complex 5 (Fig. 1 and Table 1); which suggests that the electron-withdrawing –C6F5 motif plays a vital role for the observed bond distance variation. A similar trend was realized for the DFT optimized structures of the boron complexes, that is, the B–S and B–O bond lengths are shorter for 1–4 and were elongated in 5–8. The coordination geometry around the boron center is distorted tetrahedral and the six membered ring (C3SOB) formed by the boron chelation adopts a twisted confirmation with a boron atom deviation of 0.62 Å for 1, 0.55 Å for 2, 0.49 Å for 3, 0.49 Å for 4, and 0.57 Å for 5.
| 1 | 2 | 3 | 4 | 5 | |
|---|---|---|---|---|---|
| S1–C3 | 1.718(1) | 1.715(2) | 1.706(2) | 1.704(4) | 1.706(2) |
| O1–C5 | 1.301(2) | 1.295(3) | 1.301(2) | 1.299(4) | 1.298(2) |
| B1–S1 | 1.940(2) | 1.941(2) | 1.949(2) | 1.962(4) | 1.968(2) |
| B1–O1 | 1.492(2) | 1.488(3) | 1.491(2) | 1.496(4) | 1.508(2) |
| B1–C1 | 1.616(2) | 1.624(3) | 1.627(2) | 1.633(5) | 1.603(2) |
| B1–C2 | 1.640(2) | 1.641(3) | 1.634(3) | 1.620(5) | 1.614(2) |
| C3–C4 | 1.384(2) | 1.388(3) | 1.387(4) | 1.377(5) | 1.384(2) |
| C4–C5 | 1.408(2) | 1.400(3) | 1.399(2) | 1.397(5) | 1.409(2) |
| S1–B1–O1 | 105.9(9) | 106.6(1) | 107.2(1) | 107.1(2) | 106.7(1) |
| S1–B1–C1 | 113.8(1) | 112.9(1) | 111.7(1) | 108.6(2) | 106.8(1) |
| O1–B1–C1 | 112.9(1) | 113.3(2) | 112.2(1) | 105.7(3) | 110.9(1) |
| C1–B1–C2 | 108.4(1) | 109.8(2) | 111.9(1) | 109.4(3) | 112.5(1) |
| C3–C4–C5 | 123.20(1) | 123.6(2) | 123.5(1) | 123.1(3) | 124.5(1) |
| B-atom deviation from C3SOB plane (Å) | 0.62 | 0.55 | 0.49 | 0.49 | 0.57 |
Photophysical properties and DFT analysis
The optical properties of complexes 1–8 (Table 2 and Table S5‡) were studied in various solvents such as toluene, dichloromethane (DCM), tetrahydrofuran (THF), and acetonitrile (ACN). The results pertaining to DCM are presented in the manuscript and the data related to other solvents is given in the ESI.‡ All the boron complexes 1–8 showed two absorption bands in the range 334–467 nm with extinction coefficients ranging from 10![[thin space (1/6-em)]](https://www.rsc.org/images/entities/char_2009.gif) 000–30
000–30![[thin space (1/6-em)]](https://www.rsc.org/images/entities/char_2009.gif) 000 M−1 cm−1 (Fig. 2).
000 M−1 cm−1 (Fig. 2).
| Complexes |
λ
abs![[thin space (1/6-em)]](https://www.rsc.org/images/entities/char_2009.gif) a(nm) (ε × 104 (M−1 cm−1)) a(nm) (ε × 104 (M−1 cm−1)) |
λ
ems![[thin space (1/6-em)]](https://www.rsc.org/images/entities/char_2009.gif) b (nm) b (nm) |
ϕ
F![[thin space (1/6-em)]](https://www.rsc.org/images/entities/char_2009.gif) c (%) c (%) |
τ (ns) |
|---|---|---|---|---|
| a Absorption maximum (conc. = 0.35 × 10⁻⁴ M). b excited at λmax. c quantum yield measured using integrating sphere module. d emission lifetime. | ||||
| 1 | 353 (1.5), 458 (3.0) | 534 | 0.12 | 0.23 |
| 2 | 345 (1.8), 448 (2.2) | 551 | 0.11 | 0.41 |
| 3 | 344 (1.9), 445 (1.9) | 557 | 0.10 | 0.59 |
| 4 | 348 (1.8), 463 (2.7) | 549 | 0.14 | 0.35 |
| 5 | 346 (1.6), 465 (2.1) | — | — | — |
| 6 | 336 (1.7), 455 (1.3) | — | — | — |
| 7 | 334 (1.5), 455 (1.0) | — | — | — |
| 8 | 337 (1.6), 467 (1.6) | — | — | — |
The absorption maxima of 3 is blue-shifted as compared to 1, 2, and 4; and also 7 is blue-shifted as compared to 5, 6, and 8 owing to the extended conjugation present in 4 and 8 and electron donating nature of –CH3 and –OCH3 realized in 1, 2, 5 and 6. In general, the longer wavelength band of complexes with –B(C6F5)2 showed blue-shift over complexes with –B(C6H5)2 owing to the electron withdrawing nature of perfluorinated phenyl groups. Complexes with –B(C6F5)2 motif (1–4) did not show any solvatochromism, however, complexes with –B(C6H5)2 motif (5–8) exhibit positive solvatochromism. This result reveals that there is effective interaction between polar solvents and complexes 5–8. As discussed in the previous section, the interaction between sulphur and boron in complexes 1–4 is strong compared to 5–8, which plays a major role for the observed absorption maxima with change of solvent polarity in 5–8.
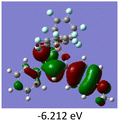
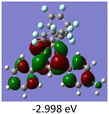
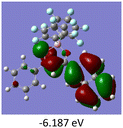
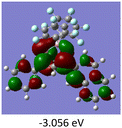
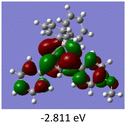
To gain a better understanding of the optical properties of 1–8, we performed time-dependent density functional theory (TD-DFT) calculations after optimizing the structures at the B3LYP/6-31g(d,p). The lowest and highest occupied molecular orbitals (LUMOs and HOMOs) of the boron complexes 1–8 are presented in Table 3. The HOMOs of 1–8 are mainly distributed over the aromatic ring attached to the keto side and the thioketonate skeleton; whereas LUMOs are distributed on both the aryl moieties and the central thioketonate ring. In general, both HOMOs and LUMOs are stabilized for –B(C6F5)2 complexes over their respective –BPh2 substituted complexes, which suggests that the electron withdrawing nature of the “pentafluorophenyl” group plays a major role for the observed values. The low LUMO values justify the observed lower reduction potential observed in 1–4 which will be discussed in the following section.
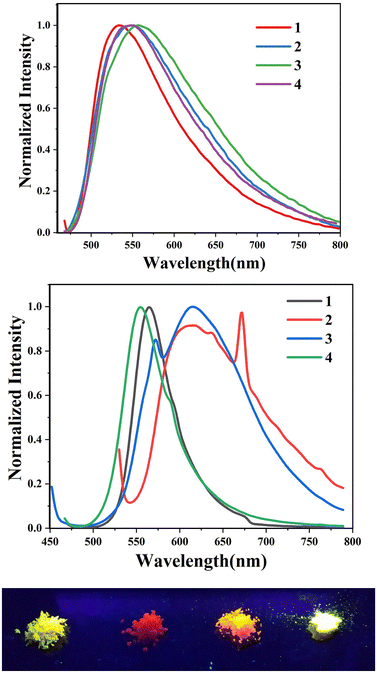
We further analysed the complexes 1–8 using fluorescence spectroscopy, which revealed that complexes 5–8 are non-fluorescent (ϕF ≤ 0.01%), however, complexes 1–4 exhibit weak fluorescence (ϕF = 0.1 to 0.14%). This result suggests that substituents on the boron atom (C6F5vs. C6H5) play a major role in the detected luminescence. The photoluminescence decay of the boron complexes 1–4 exhibited an average lifetime of 0.2–0.6 ns in dichloromethane (Table 2). Further evaluation of the DFT reveals that the lowest energy excitation for complexes 1–4 is largely HOMO to LUMO transitions, however, for complexes 5–8 it is HOMO-2 to LUMO transitions. The HOMO-2 of complexes 5–8 localized on the “phenyl” group attached to the boron center (Tables S7–S10‡). This difference may be the reason for the detected luminescence in the case of complexes 1–4. In a similar fashion, complexes 1–4 showed solid state photoluminescence from 554–617 nm (Fig. 3), however, complexes 5–8 did not show any emission in the solid-state.
Electrochemical studies
The electrochemical properties of the complexes 1–8 were studied in N2 bubbled dichloromethane at 298 K using cyclic voltammetry. All the complexes 1–8 showed one reversible reduction in the range −1.09 to −1.32 V (Fig. 4 and Table 4). The reduction potential was altered by switching the groups on the boron atom. The diphenylboron complexes (5–8) showed more negative potential over the bis(pentaflurophenyl)boron complexes (1–4). Among the four bis(pentaflurophenyl)boron complexes (1–4) studied, 1 exhibited a more negative value of −1.19 V owing to the presence of the –OMe group, whereas complex 4 exhibited the less negative value of −1.09 V because of the stabilized LUMO level. A similar pattern was detected for the diphenylboron complexes 5–8 (E1/2 for 5 is −1.32 V and for 8 is −1.22 V). | ||
| Fig. 4 Cyclic voltammogram of boron complexes 1–8 at a scan rate of 50 mV s−1 in dichloromethane (0.1 M of nBu4N[PF6] as the supporting electrolyte, vs. Fc/Fc+). | ||
| Complexes | E pc |
E
g![[thin space (1/6-em)]](https://www.rsc.org/images/entities/char_2009.gif) a a |
LUMOb | HOMOc |
E
g![[thin space (1/6-em)]](https://www.rsc.org/images/entities/char_2009.gif) d d |
|---|---|---|---|---|---|
| a Absorption onset determined from UV low energy band. b Calculated from Epc with reference to Fc/Fc+. c Calculated from Eg and LUMO. d Obtained from DFT calculations. Epc = cathodic peak potential. Eg = HOMO to LUMO gap. | |||||
| 1 | −1.19 | 2.48 | −3.44 | −5.92 | 3.30 |
| 2 | −1.15 | 2.49 | −3.46 | −5.95 | 3.44 |
| 3 | −1.11 | 2.50 | −3.51 | −6.01 | 3.49 |
| 4 | −1.09 | 2.43 | −3.52 | −5.95 | 3.13 |
| 5 | −1.32 | 2.41 | −3.39 | −5.80 | 3.32 |
| 6 | −1.28 | 2.40 | −3.39 | −5.79 | 3.41 |
| 7 | −1.23 | 2.40 | −3.38 | −5.78 | 3.42 |
| 8 | −1.22 | 2.34 | −3.43 | −5.77 | 3.18 |
Nonlinear optical measurements
The lack of exploration of substituent variation on the boron centre, motivated us to investigate the nonlinear optical properties of the boron-β-thioketonate moieties for applications in photonic limiting and switching. The nonlinear optical measurements for complexes 1–8 were carried out using the open-aperture (OA) as well as closed-aperture (CA) single-beam Z-scan technique, with an optimally focused ultrashort pulsed laser beam. A fiber laser emitting linearly polarized ultrashort pulses at 370 fs at a central wavelength of 1030 nm was used for the experiment. The measurements were carried out at a laser pulse repetition rate of 100 kHz that results in an on-axis peak intensity of approximately 42 GW cm−2 at the focus (z = 0). The detailed experimental configuration and the measurement method is elaborated in the ESI.‡Fig. 5a presents the measured OA normalized transmittance and Fig. 5b shows the CA transmittance, for complex 1. The OA measurement curve has a valley in the transmission signifying the nonlinear absorption which is primarily led by a two-photon absorption (TPA) process at 1030 nm excitation wavelength. On the other hand, the CA transmittance exhibits a pre-focal maximum followed by a post-focal minimum which depicts a negative sign for the nonlinear refractive index. The OA and CA Z-scan transmission curves for complexes 2–8 are shown in Fig. S1 and S2 in the ESI,‡ the transmittance variation for each resembles that observed in Fig. 5a and b, except for complex 6.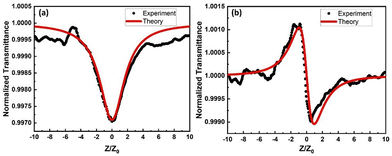 | ||
| Fig. 5 Measured normalized transmittance (black dotted curve) as a function of sample position for (a) open-aperture (OA) and (b) closed-aperture (CA) Z-scan experiment for complex 1. The red solid curves are theoretical fits as per eqn (S6) and (S7)‡. | ||
The estimated values of β and n2 are tabulated in Table 5 for all the complexes. It is apparent that most of the compounds exhibit weak saturable absorption (SA) behaviour except for complexes 1, 6, and 8. The UV-visible optical absorption spectrum (see Fig. 5) indicates that there should be a predominant contribution of two-photon absorption (TPA) in the reverse saturable absorption (RSA) signature for 1, 6, and 8. In general, a smaller HOMO–LUMO gap renders a molecular configuration that is more susceptible to an external (exciting) electromagnetic field. In other words, the strength of hyperpolarizability would be higher for a molecule with a smaller HOMO–LUMO gap.43,44 Amongst all the complexes, 8 exhibits the smallest HOMO–LUMO gap and consequently, the nonlinear coefficient (β) is the highest for 8. In line with this argument, 2 and 3 are expected to exhibit weak nonlinear optical absorption (NLA) owing to a high HOMO–LUMO gap for the S0 → S1 transition. This is indeed observed except for a negative sign which represents saturable absorption (SA) behaviour. It is surprising to observe that a majority of the complexes exhibit a weak SA signature at 1030 nm excitation wavelength. A plausible attribution could be a bulky ligand architecture that reduces the charge carrier mobility at ultrashort pulse (<400 fs) time scales. Due to this phase lag in electronic response from the molecules (2–5, and 7), the nonlinear optical absorption peaks when the excitation laser intensity maximizes (z = 0). Additionally, the presence of an electron withdrawing pentafluorophenyl group in complexes 2–4 manifests as a weakened NLA. It is worth noting that the conjugation length (bond length) and the dihedral angle play a crucial role in determining hyperpolarizability in molecules. Dihedral angles close to zero or π provide a low hindrance mobility for intramolecular charge transfer and hence, this could lead to stronger hyperpolarizability in molecules.45 It could be observed from Tables S3 and S4,‡ that complex 8 exhibits the lowest dihedral angle which manifests through a strong NLO response. It is crucial to point out that the excitation ultrashort pulses are incident at a repetition rate of approximately 100 kHz. At such a high pulse incidence rate, the impact of thermo-optic effects could be substantial in comparison with the electronic contribution to optical nonlinearity. This is apparent from the refractive optical nonlinearity (Table 5) where it could be observed that most of the complexes exhibit a self-defocusing (negative n2) effect for the 1030 nm excitation laser.
| Complexes | β (cm W−1) | n 2 (cm2 W−1) |
|---|---|---|
| 1 | 1.99 × 10⁻¹² | −2.01 × 10⁻¹⁷ |
| 2 | −0.61 × 10⁻¹² | −3.19 × 10⁻¹⁷ |
| 3 | −0.95 × 10⁻¹² | 1.37 × 10⁻¹⁷ |
| 4 | −1.15 × 10⁻¹² | −2.67 × 10⁻¹⁷ |
| 5 | −1.12 × 10⁻¹² | −4.22 × 10⁻¹⁷ |
| 6 | 1.34 × 10⁻¹² | −1.65 × 10⁻¹⁷ |
| 7 | −1.60 × 10⁻¹² | −3.91 × 10⁻¹⁷ |
| 8 | 6.37 × 10⁻¹² | −4.35 × 10⁻¹⁷ |
Conclusion
In conclusion, we have prepared different O,S-chelated B(C6F5)2 and B(C6H5)2 substituted monothio-β-diketonates (1–8). Structural analysis of 1–5 realised that the B–S and B–O bond distances of the bis(pentafluorophenyl)boron complexes are notably shorter than the diphenyl boron complexes. The optical and electrochemical properties along with DFT studies of the boron complexes 1–8 were studied in detail. The diphenyl boron complexes (5–8) displayed red shifted absorption compared to bis(pentafluorophenyl)boron complexes (1–4). Further, diphenyl boron complexes exhibited a high negative potential over the bis(pentafluorophenyl)boron complexes. TD-DFT studies further showed that the HOMO–LUMO gap altered with changing moiety on the boron centre, that is phenyl vs. pentaflurophenyl. The nonlinear optical absorption properties of the synthesized complexes vary from a TPA-led RSA signature to an SA signature by virtue of the bulky ligand architecture. Most of the monothio-β-diketonate derivatives exhibit a self-defocusing effect owing to the strong thermo-optic contribution.Experimental section
The starting materials L1–L4, the bis(pentafluorophenyl)boron monothio-β-diketonates 1–4 and diphenylboron monothio-β-diketonates 5–8 were synthesized using previously reported procedures.17,41The details of the quantities involved, yields and other data are given below.
Synthesis of L1
4-Methoxyacetophenone (8.9 mmol, 1.30 g), methyl benzodithioate (10.7 mmol, 1.80 g), and NaH (19.6 mmol, 0.47 g). Yield: 60.0% (1.40 g). 1H NMR (400 MHz, CDCl3) δ 3.90 (s, 3H), 6.99 (d, J = 8.8 Hz, 2H). 7.39–7.52 (m, 4H), 7.81 (d, J = 8.0 Hz, 2H), 8.01 (d, J = 8.0 Hz, 2H), 15.42 (s, 1H). 13C NMR (101 MHz, CDCl3) δ 55.7, 110.3, 114.4, 126.9, 127.9, 128.6, 129.6, 131.0, 145.8, 163.6, 179.6, 202.0. ESI (HR-MS). Calcd for C16H14O2S ([M + Na]+): m/z 293.0612, found: 293.0603.Synthesis of L2
4-Methylacetophenone (8.9 mmol, 1.20 g), methyl benzodithioate (10.7 mmol, 1.80 g), and NaH (19.7 mmol, 0.47 g). Yield: 58.0% (1.30 g). 1H NMR (400 MHz, CDCl3) δ 2.43 (s, 3H), 7.30 (d, J = 8.0 Hz, 2H), 7.36–7.53 (m, 4H), 7.81 (d, J = 8.0 Hz, 2H), 7.92 (d, J = 8.0 Hz, 2H), 15.38 (s, 1H). 13C NMR (101 MHz, CDCl3) δ 21.8, 110.5, 126.9, 127.4, 128.6, 129.7, 131.1, 132.9, 143.8, 145.7, 179.9, 203.5. ESI (HR-MS). Calcd for C16H14OS ([M + H]+): m/z 255.0838, found: 255.0819.Synthesis of L3
Acetophenone (8.9 mmol, 1.10 g), methyl benzodithioate (10.7 mmol, 1.80 g), and NaH (23.6 mmol, 0.57 g). Yield: 47.0% (1.50 g). 1H NMR (400 MHz, CDCl3) δ 7.61–7.40 (m, 7H), 7.79–7.89 (m, 2H), 8.02 (d, J = 8.0 Hz, 2H), 15.24 (s, 1H). 13C NMR (101 MHz, CDCl3) δ 110.7, 126.9, 127.3, 128.6, 129.0, 131.2, 132.7, 135.8, 145.6, 179.8, 203.6. ESI (HR-MS). Calcd for C15H12OS ([M + H]+): m/z 241.0682, found: 241.0649.Synthesis of L4
2-Acetylnaphthalene (8.8 mmol, 1.50 g), methyl benzodithioate (10.7 mmol, 1.80 g), and NaH (19.4 mmol, 0.46 g). Yield: 62.0% (1.60 g). 1H NMR (400 MHz, CDCl3) δ 7.44–7.64 (m, 6H), 7.84–8.06 (m, 6H), 8.58 (s, 1H), 15.41 (s, 1H). 13C NMR (101 MHz, CDCl3) δ 111.0, 123.2, 127.0, 127.0, 127.9, 128.5, 128.6, 128.7, 128.8, 129.5, 131.2, 132.9, 132.9, 135.4, 145.7, 179.5, 204.0. ESI (HR-MS). Calcd for C19H14OS ([M + H]+): m/z 291.0844, found: 291.0822.Synthesis of 1
L1 (1.5 mmol, 0.40 g) and B(C6F5)3 (1.7 mmol, 0.90 g). Yield: 56.0% (0.50 g). 1H NMR (700 MHz, CDCl3) δ 3.96 (s, 3H), 7.08 (d, J = 8.0 Hz, 2H), 7.51 (t, J = 7.8 Hz, 2H), 7.59–7.64 (m, 2H), 7.89 (d, J = 8.0 Hz, 2H), 8.26 (d, J = 8.0 Hz, 2H). 11B NMR (128 MHz, CDCl3) δ 1.7. 13C NMR (176 MHz, CDCl3) δ 56.0, 110.4, 115.0, 126.1, 128.5, 129.2, 132.9, 133.6, 136.5, 137.3 (d = 262 Hz), 139.7, 140.3 (d, J = 250 Hz), 147.8 (d, J = 236 Hz), 166.2, 181.4, 188.4. 19F NMR (376 MHz, CDCl3) δ −163.3 (t, 4F, Pf), −156.6 (t, 2F, Pf), −134.2 (d, 4F, Pf). ESI (HR-MS). Calcd for C28H13BF10O2S ([M]+): m/z 614.0606, found: 614.0568.Synthesis of 2
L2 (1.9 mmol, 0.50 g) and B(C6F5)3 (2.3 mmol, 1.20 g). Yield: 67.0% (0.78 g). 1H NMR (700 MHz, CDCl3) δ 2.51 (s, 3H), 7.41 (d, J = 8.1 Hz, 2H), 7.53 (t, J = 8.0 Hz, 2H), 7.64 (t, J = 8.0 Hz, 1H), 7.69 (s, 1H), 7.91 (d, J = 8.0 Hz, 2H), 8.18 (d, J = 8.0 Hz, 2H). 11B NMR (128 MHz, CDCl3) δ 1.7. 13C NMR (176 MHz, CDCl3) δ 22.1, 110.7, 128.5, 129.2, 130.3, 131.0, 133.9, 137.2 (d, J = 253 Hz), 139.5, 140.4 (d, J = 250 Hz), 147.7, 147.8 (d, J = 246 Hz), 182.4, 190.4. 19F NMR (376 MHz, CDCl3) δ −163.2 (t, 4F, Pf), −156.4 (t, 2F, Pf), −134.2 (d, 4F, Pf). ESI (HR-MS). Calcd for C28H13BF10OS ([M − H]+): m/z 597.0579, found: 597.0650.Synthesis of 3
L3 (3.1 mmol, 0.75 g) and B(C6F5)3 (3.7 mmol, 1.90 g). Yield: 79.0% (1.45 g). 1H NMR (700 MHz, CDCl3) δ 7.54 (t, J = 8.0 Hz, 2H), 7.61 (t, J = 8.0 Hz, 2H), 7.66 (t, J = 8.0 Hz, 1H), 7.69 (s, 1H), 7.74 (t, J = 8.0 Hz, 1H), 7.92 (d, J = 8.0 Hz, 2H), 8.26 (d, J = 8.0 Hz, 2H). 11B NMR (128 MHz, CDCl3) δ 1.8. 13C NMR (176 MHz, CDCl3) δ 76.9, 77.1, 77.3, 110.9, 128.6, 129.3, 129.5, 130.1, 133.6, 134.1, 135.7, 137.3 (d, J = 250 Hz), 139.4, 140.4 (d, J = 252 Hz), 147.8, 182.4, 191.8. 19F NMR (376 MHz, CDCl3) δ −163.1 (t, 4F, Pf), −156.3 (t, 2F, Pf), −134.2 (d, 4F, Pf). ESI (HR-MS). Calcd for C27H11BF10OS ([M + H]+): m/z 584.0500, found: 584.0539.Synthesis of 4
L4 (1.7 mmol, 0.50 g) and B(C6F5)3 (2.1 mmol, 1.10 g). Yield: 69.0% (0.75 g). 1H NMR (400 MHz, CDCl3) δ 7.56 (t, J = 8.0 Hz, 2H), 7.60–7.74 (m, 3H), 7.83 (s, 1H), 7.91–8.04 (m, 4H), 8.08 (d, J = 8.0 Hz, 1H), 8.20 (d, J = 8.0 Hz, 1H), 8.85 (s, 1H). 11B NMR (128 MHz, CDCl3) δ 1.8. 13C NMR (176 MHz, CDCl3) δ 111.2, 124.4, 127.6, 128.1, 128.6, 129.3, 129.3, 130.2, 130.4, 130.9, 132.7, 132.9, 134.1, 136.8, 137.3 (J = 271 Hz), 139.6, 140.4 (d, J = 260 Hz), 147.9 (d, J = 246 Hz), 182.1, 191.2. 19F NMR (377 MHz, CDCl3) δ −163.1 (t, 4F, Pf), −156.3 (t, 2F, Pf), −134.1 (d, 4F, Pf). ESI (HR-MS). Calcd for C31H13BF10OS ([M − H]+): m/z 633.0657, found: 633.0659.Synthesis of 5
L1 (1.5 mmol, 0.40 g) and B(C6H5)3 (1.7 mmol, 0.43 g). Yield: 81.0% (0.52 g). 1H NMR (400 MHz, CDCl3) δ 3.94 (s, 3H), 7.05 (d, J = 8.0 Hz, 2H), 7.16–7.30 (m, 6H), 7.43–7.50 (m, 3H), 7.58 (d, J = 8.0 Hz, 5H), 7.89 (d, J = 8.0 Hz, 2H), 8.27 (d, J = 8.0 Hz, 2H). 11B NMR (128 MHz, CDCl3) δ 6.3. 13C NMR (101 MHz, CDCl3) δ 55.9, 111.4, 114.7, 126.5, 127.2, 128.1, 128.9, 131.8, 132.2, 132.8, 140.6, 165.2, 180.7, 189.3. ESI (HR-MS). Calcd for C28H24BO2S ([M + H]+): m/z 435.1626, found: 435.1591.Synthesis of 6
L2 (1.9 mmol, 0.50 g) and B(C6H5)3 (0.57 g, 2.4 mmol). Yield: 65.0% (0.54 g). 1H NMR (400 MHz, CDCl3) δ 2.49 (s, 3H), 7.15–7.31 (m, 6H), 7.37 (d, J = 8.0 Hz, 2H), 7.48 (d, J = 8.0 Hz, 2H), 7.53–7.63 (m, 6H), 7.88–7.95 (m, 2H), 8.18 (d, J = 8.0 Hz, 2H). 11B NMR (128 MHz, CDCl3) δ 6.1. 13C NMR (101 MHz, CDCl3) δ 22.1, 111.6, 126.6, 127.2, 128.1, 128.9, 129.3, 130.1, 132.2, 133.0, 140.5, 146.2, 181.4, 191.0. ESI (HR-MS). Calcd for C28H23BOS ([M]+): m/z 418.1677, found: 418.1649.Synthesis of 7
L3 (2.0 mmol, 0.50 g) and B(C6H5)3 (2.5 mmol, 0.60 g). Yield: 54.0% (0.46 g). 1H NMR (700 MHz, CDCl3) δ 7.22 (d, J = 8.0 Hz, 2H), 7.24–7.29 (m, 4H), 7.48 (t, J = 7.8 Hz, 2H), 7.53–7.63 (m, 8H), 7.69 (d, J = 8.0 Hz, 1H), 7.91 (d, J = 8.0 Hz, 2H), 8.26 (d, J = 8.0 Hz, 2H). 11B NMR (128 MHz, CDCl3) δ 5.0. 13C NMR (176 MHz, CDCl3) δ 111.7, 126.7, 127.3, 128.2, 129.0, 129.1, 129.3, 132.2, 133.2, 134.6, 134.9, 140.4, 181.4, 192.2. ESI (HR-MS). Calcd for C27H22BOS ([M + H]+): m/z 405.1521, found: 405.1511.Synthesis of 8
L4 (1.7 mmol, 0.50 g) and B(C6H5)3 (2.0 mmol, 0.5 g). Yield: 67.0% (0.52 g). 1H NMR (400 MHz, CDCl3) δ 7.21–7.37 (m, 6H), 7.54 (t, J = 7.6 Hz, 2H), 7.61–7.75 (m, 8H), 7.95–8.05 (m, 4H), 8.09 (d, J = 8.0 Hz, 1H), 8.27 (d, J = 8.0 Hz, 1H), 8.90 (s, 1H). 11B NMR (128 MHz, CDCl3) δ 5.2. 13C NMR (101 MHz, CDCl3) δ 112.1, 124.1, 126.7, 127.3, 127.4, 128.0, 128.2, 129.0, 129.1, 129.5, 130.1, 131.3, 132.1, 132.3, 132.9, 133.1, 136.3, 140.5, 181.1, 191.8. ESI (HR-MS). Calcd for C31H24BOS ([M + H]+): m/z 455.1677, found: 455.1630.Author contributions
The manuscript was written through contributions from all authors. All authors have given approval to the final version of the manuscript.Data availability
Crystallographic data for 1–5 have been deposited at the CCDC under 2380850–2380854. All other data supporting this article have been included as part of the ESI.‡Conflicts of interest
There are no conflicts to declare.Acknowledgements
KV thanks the Department of Atomic Energy (DAE) and Science and Engineering Research Board (SERB) (CRG/2023/000085) for financial support. ACM thanks NISER for the fellowship. This manuscript is adapted from Dr Anna Chandrasekar Murali's dissertation, National Institute of Science Education and Research (NISER), an OCC of Homi Bhabha National Institute, India, 2023.References
- K. Liu, R. A. Lalancette and F. Jäkle, J. Am. Chem. Soc., 2017, 139, 18170–18173 CrossRef CAS PubMed.
- J. Huang and Y. Li, Front. Chem., 2018, 6, 341–363 CrossRef PubMed.
- C. C. Vidyasagar, B. M. Munoz Flores, V. M. Jimenez-Perez and P. M. Gurubasavaraj, Mater. Today Chem., 2019, 11, 133–155 CrossRef CAS.
- D. Franz and S. Inoue, Chem. – Eur. J., 2019, 25, 2898–2926 CrossRef CAS PubMed.
- K. Liu, R. A. Lalancette and F. Jäkle, J. Am. Chem. Soc., 2019, 141, 7453–7462 CrossRef CAS PubMed.
- S. Bellinger, M. Hatamimoslehabadi, R. E. Borg, J. La, P. Catsoulis, F. Mithila, C. Yelleswarapu and J. Rochford, Chem. Commun., 2018, 54, 6352–6355 RSC.
- M. Hayakawa, M. Kameda, R. Kawasumi, S. Nakatsuka, N. Yasuda and T. Hatakeyama, Angew. Chem., Int. Ed., 2023, 62, e202217512 CrossRef CAS PubMed.
- J. Shi, Z. Ran and F. Peng, Dyes Pigm., 2022, 204, 110383 CrossRef CAS.
- A. C. Murali, P. Nayak and K. Venkatasubbaiah, Dalton Trans., 2022, 51, 5751–5771 RSC.
- X. Chen, D. Tan and D.-T. Yang, J. Mater. Chem. C, 2022, 10, 13499–13532 RSC.
- J. Gong and X. Zhang, Coord. Chem. Rev., 2022, 453, 214329 CrossRef CAS.
- V. Mukundam, S. Sa, A. Kumari, T. Teja Ponduru, R. Das and K. Venkatasubbaiah, Chem. – Asian J., 2022, 17, e202200291 CrossRef CAS PubMed.
- P. Nayak, A. C. Murali, V. Chandrasekhar and K. Venkatasubbaiah, Mater. Adv., 2022, 3, 5893–5899 RSC.
- S. Sa, A. Sahoo, S. Mukherjee, A. Perumal and K. Venkatasubbaiah, Dyes Pigm., 2022, 206, 110585 CrossRef CAS.
- X. Li, G. Zhang and Q. Song, Chem. Commun., 2023, 59, 3812–3820 RSC.
- R. Kannan, P. Nayak, R. Arumugam, D. Krishna Rao, K. R. Mote, A. C. Murali, K. Venkatasubbaiah and V. Chandrasekhar, Dalton Trans., 2023, 52, 16829–16840 RSC.
- A. C. Murali, P. Nayak, S. Nayak, S. Das, S. P. Senanayak and K. Venkatasubbaiah, Angew. Chem., Int. Ed., 2023, 62, e202216871 CrossRef CAS PubMed.
- A. C. Murali, P. Pratakshya, P. Patel, P. Nayak, S. Peruncheralathan and K. Venkatasubbaiah, New J. Chem., 2023, 47, 17835–17842 RSC.
- C. Jin, X. Yang, W. Zhao, Y. Zhao, Z. Wang and J. Tan, Coord. Chem. Rev., 2024, 513, 215892 CrossRef CAS.
- P. Nayak, S. Mukherjee, D. Patel, A. A. Mahapatra, A. C. Murali, A. Perumal and K. Venkatasubbaiah, ACS Appl. Opt. Mater., 2024, 2, 1523–1532 CrossRef CAS.
- P.-Z. Chen, L.-Y. Niu, Y.-Z. Chen and Q.-Z. Yang, Coord. Chem. Rev., 2017, 350, 196–216 CrossRef CAS.
- M. V. Filippov, Y. N. Kononevich, D. S. Ionov, A. A. Safonov, A. I. Karnaeva, V. A. Sazhnikov, M. V. Alfimov and A. M. Muzafarov, ChemPhotoChem, 2024, 8, e202300317 CrossRef.
- S. Ito, M. Gon, K. Tanaka and Y. Chujo, Natl. Sci. Rev., 2021, 8, nwab049 CrossRef CAS PubMed.
- P. Xue, X. Wang, W. Wang, J. Zhang, Z. Wang, J. Jin, C. Zheng, P. Li, G. Xie and R. Chen, ACS Appl. Mater. Interfaces, 2021, 13, 47826–47834 CrossRef CAS PubMed.
- M. L. Daly, C. Kerr, C. A. DeRosa and C. L. Fraser, ACS Appl. Mater. Interfaces, 2017, 9, 32008–32017 CrossRef CAS PubMed.
- C. A. DeRosa, M. Kolpaczynska, C. Kerr, M. L. Daly, W. A. Morris and C. L. Fraser, ChemPlusChem, 2017, 82, 399–406 CrossRef CAS PubMed.
- C. Kerr, C. A. DeRosa, M. L. Daly, H. Zhang, G. M. Palmer and C. L. Fraser, Biomacromolecules, 2017, 18, 551–561 CrossRef CAS PubMed.
- F. Wang, C. A. De Rosa, M. L. Daly, D. Song, M. Sabat and C. L. Fraser, Mater. Chem. Front., 2017, 1, 1866–1874 RSC.
- C.-L. Wong, C.-T. Poon and V. W.-W. Yam, Organometallics, 2017, 36, 2661–2669 CrossRef CAS.
- T. Butler, M. Zhuang and C. L. Fraser, J. Phys. Chem. C, 2018, 122, 19090–19099 CrossRef.
- T. Liu, G. Zhang, R. E. Evans, C. O. Trindle, Z. Altun, C. A. De Rosa, F. Wang, M. Zhuang and C. L. Fraser, Chem. – Eur. J., 2018, 24, 1859–1869 CrossRef PubMed.
- J. Sun, C. Qian, S. Xu, X. Jia, L. Zhai, J. Zhao and R. Lu, Org. Biomol. Chem., 2018, 16, 7438–7445 RSC.
- R. Jimenez, F. Duarte, S. Nuti, J. A. Campo, C. Lodeiro, M. Cano and C. Cuerva, Dyes Pigm., 2020, 177, 108272 CrossRef.
- P. Li, Q. Liang, E. Y.-H. Hong, C.-Y. Chan, Y.-H. Cheng, M.-Y. Leung, M.-Y. Chan, K.-H. Low, H. Wu and V. W.-W. Yam, Chem. Sci., 2020, 11, 11601–11612 RSC.
- M. Zhuang, S. Joshi, H. Sun, T. Batabyal, C. L. Fraser and J. Kapur, Sci. Rep., 2021, 11, 1076 CrossRef PubMed.
- X. Wang, G. Wang, J. Li, X. Li and K. Zhang, Polymer, 2022, 239, 124449 CrossRef.
- D.-H. Kim, A. D'Aléo, X.-K. Chen, A. D. S. Sandanayaka, D. Yao, L. Zhao, T. Komino, E. Zaborova, G. Canard, Y. Tsuchiya, E. Choi, J. W. Wu, F. Fages, J.-L. Brédas, J.-C. Ribierre and C. Adachi, Nat. Photonics, 2018, 12, 98–104 CrossRef.
- R. Aoki, R. Komatsu, K. Goushi, M. Mamada, S. Y. Ko, J. W. Wu, V. Placide, A. D'Aléo and C. Adachi, Adv. Opt. Mater., 2021, 9, 2001947 CrossRef.
- K. Tanaka, M. Gon, S. Ito, J. Ochi and Y. Chujo, Coord. Chem. Rev., 2022, 472, 214779 CrossRef.
- F. P. Macedo, C. Gwengo, S. V. Lindeman, M. D. Smith and J. R. Gardinier, Eur. J. Inorg. Chem., 2008, 20, 3200–3211 CrossRef.
- A. C. Murali, P. Nayak, R. Panda, R. Das and K. Venkatasubbaiah, ACS Appl. Opt. Mater., 2023, 1, 1033–1042 CrossRef.
- A. Nagai, K. Kokado, Y. Nagata, M. Arita and Y. Chujo, J. Org. Chem., 2008, 73, 8605–8607 CrossRef CAS PubMed.
- M. Rodríguez, R. Castro-Beltrán, G. Ramos-Ortiz, J. L. Maldonado, N. Farfán, O. Dománguez, J. Rodríguez, R. Santillan, M. A. Meneses-Nava, O. Barbosa-García and J. Peon, Synth. Met., 2009, 159, 1281–1287 CrossRef.
- Z. Yuan, N. J. Taylor, R. Ramchandran and T. B. Marder, Appl. Organomet. Chem., 1996, 10, 305–316 CrossRef CAS.
- V. Mukundam, S. Sa, A. Kumari, R. Das and K. Venkatasubbaiah, J. Mater. Chem. C, 2019, 7, 12725–12737 RSC.
Footnotes |
| † This article is dedicated to Professor V. Chandrasekhar on the occasion of his 65th birthday. |
| ‡ Electronic supplementary information (ESI) available: General information, experimental details, NMR spectra, X-ray data and DFT studies. CCDC 2380850–2380854. For ESI and crystallographic data in CIF or other electronic format see DOI: https://doi.org/10.1039/d4dt02471k |
| This journal is © The Royal Society of Chemistry 2024 |


