
Mechanochromic luminescence in copper nanoclusters: resolving structural transitions through microcrystal electron diffraction†‡
Harshita
Nagar
 ab,
Subrata
Duary
ab,
Vivek
Yadav
ab,
Amoghavarsha Ramachandra
Kini
ab,
Sudhadevi
Antharjanam
c,
Tomas
Base
*d,
Anirban
Som
*ab,
Brent L.
Nannenga
*e and
Thalappil
Pradeep
*ab
ab,
Subrata
Duary
ab,
Vivek
Yadav
ab,
Amoghavarsha Ramachandra
Kini
ab,
Sudhadevi
Antharjanam
c,
Tomas
Base
*d,
Anirban
Som
*ab,
Brent L.
Nannenga
*e and
Thalappil
Pradeep
*ab
aDST Unit of Nanoscience (DST UNS) and Thematic Unit of Excellence (TUE), Department of Chemistry, Indian Institute of Technology, Madras, Chennai – 600036, India. E-mail: pradeep@iitm.ac.in; asomchem@gmail.com
bInternational Centre for Clean Water, Chennai-600113, India
cSophisticated Analytical Instruments Facility (SAIF), Indian Institute of Technology, Madras, Chennai – 600036, India
dDepartment of Synthesis, Institute of Inorganic Chemistry, The Czech Academy of Science, 1001 Husinec-Rez, 25068, Czech Republic. E-mail: tbase@iic.acs.cz
eSchool of Engineering of Matter, Transport and Energy, Arizona State University, Tempe, Arizona, USA. E-mail: brent.nannenga@asu.edu
First published on 11th June 2025
Abstract
MicroED reveals insights into mechanochromic luminescence in copper nanoclusters, demonstrating structural transitions from crystalline to amorphous state upon grinding, with restoration of crystallinity following solvent exposure. Luminescence switching occurs due to reversible amorphization-recrystallization rather than chemical changes, providing critical design principles for such stimuli-responsive materials.
Noble metal nanoclusters (NCs) occupy a unique position between atomic and nanoparticle regimes of matter, exhibiting quantum-confined properties that depend critically on their precise atomic arrangements.1,2 Accurate structural insight enables the building of structure–property relationships, identification of active sites for catalysis,3 optimization of functionalities,4 and doping of heteroatoms5,6 for various applications in energy, medicine, and nanotechnology.7–9 Detailed structural information also helps to understand stability, growth mechanisms, and ligand–cluster and cluster–cluster interactions, which are essential for tailoring the performance of NCs.10 Among NCs, copper nanoclusters (Cu NCs) have emerged as useful materials due to their mechanochromic luminescence11–13 and reversible emission changes upon mechanical grinding and solvent exposure, making them promising for sensing and anti-counterfeiting applications. Despite their emerging importance, the structural mechanisms underlying reversible luminescence remain poorly understood, primarily due to analytical limitations.
Conventional structural methods face significant challenges when investigating mechanochromic transitions. Single-crystal X-ray diffraction (SC-XRD), gold-standard for structure determination, fails when crystal size reduces to submicron dimensions after mechanical processing, while powder XRD provides limited atomic-level detail. This analytical gap has hindered mechanistic understanding of how grinding-induced structural changes correlate with altered luminescence properties, leaving fundamental questions about structural integrity and solvent interactions unresolved.
Microcrystal electron diffraction (MicroED) addresses these limitations by enabling atomic-resolution structure determination from submicron-sized crystals.14 While used extensively for biomolecules15 and previously applied to a single gold NC,16 MicroED's potential for investigating mechanochromic phenomena in NCs remain unexplored. This technique is particularly suited for studying Cu NCs’ complex behaviors given their distinctive coordination chemistry and cuprophilic interactions that fundamentally influence their photoluminescent properties.
Here, we demonstrate MicroED's capabilities through progressive investigation of three 4-atom Cu NC systems: first showcasing its accuracy through structural analysis of Cu4(MNA)2(DPPE)2, then revealing solvent molecules in Cu4(m9-CBT)4 undetectable by SC-XRD, and finally providing direct structural evidence of the amorphization-recrystallization mechanism in mechanochromic Cu4(o9-CBT)4 (MNA, DPPE, o9-CBT and m9-CBT are 2-mercaptoni-cotonic acid, 1,2-bis-(diphenylphosphino) ethane, ortho carborane-9-thiol and meta carborane-9-thiol, respectively). Our findings establish that mechanical grinding disrupts long-range order without altering the structure of individual NCs, while solvent exposure facilitates recrystallization and restoration of luminescence, insights previously inaccessible through conventional techniques.
Previously reported by our group, these three Cu NCs serve as ideal candidates for MicroED investigations, exhibiting assembly-induced emission wherein their non-emissive solution behavior transforms to bright solid-state luminescence through molecular ordering.17,18 Their distinctive mechanochromic response provides a perfect platform for elucidating structure–property relationships at the nanoscale. The synthesis and crystallization protocols for these NCs are described in the Experimental section (ESI‡). These were fully characterized using UV-vis spectroscopy and ESI-MS (Fig. S1, ESI‡). For MicroED, microcrystals were deposited onto lacey carbon grids, clipped into autogrid-rings, and loaded into a Krios G4 Cryo-EM equipped with an X-FEG source operating at 300 kV (Fig. S2, ESI‡). Data were collected using EPU-D (ThermoFisher), with the overall procedure illustrated in Fig. S3 (ESI‡). An atlas preset at low magnification provided a global map, followed by a grid square preset to image a single region, then a search/auto eucentric preset to locate and center the crystals of interest, and finally a diffraction preset for the collection of continuous rotation electron diffraction data at a dose rate of 0.01 e− Å−2 s−1 using the smallest spot size (11) and a 1 s exposure, in nanoprobe mode. Samples were maintained at liquid nitrogen temperature, and diffraction data were recorded on a Ceta D CMOS camera and exported in SMV format. All diffraction datasets were indexed and integrated using XDS, scaled with XSCALE, and then converted to SHELX format through XDSCONV. Structures were subsequently solved with SHELXT and refined in SHELXL. Notably, the entire MicroED data collection and structure determination process required only a few hours, underscoring the rapid and efficient nature of this technique.
We first investigated Cu4(MNA)2(DPPE)2 NC as a benchmark system to validate MicroED's capability for accurate structure determination of copper clusters. Microcrystals (Fig. 1A) suspended in DMF were deposited directly onto lacey carbon grids and analyzed using the continuous rotation methodology. Data collection from −50° to +50° in 1° increments at 1° s−1 achieved exceptional subatomic resolution (0.8 Å, Fig. 1B), comparable to high-quality SC-XRD data but from significantly smaller crystals. TEM images of the microcrystal at various tilt angles are shown in Fig. S4 (ESI‡).
 | ||
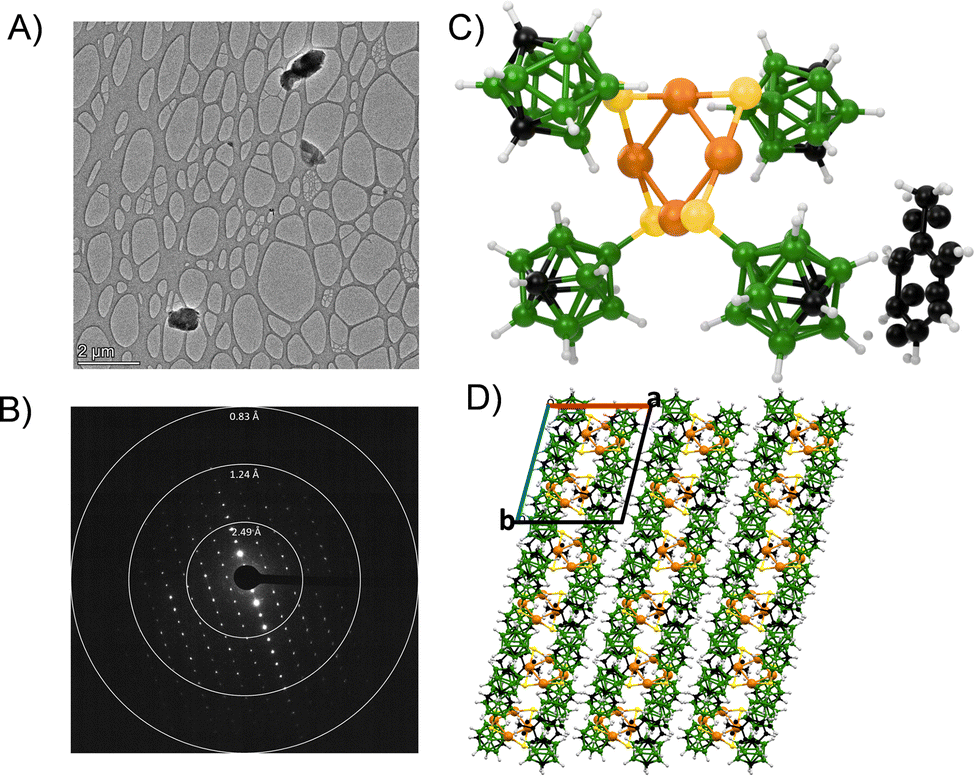
| Fig. 1 MicroED enables subatomic resolution structure determination of Cu4(MNA)2(DPPE)2. (A) TEM image of microcrystals on lacey carbon grids. (B) Initial diffraction frame showing high resolution reflections. (C) Resolved molecular structure revealing Cu4S2 core with distinct coordination environments. (D) 3 × 3 × 3 crystal packing along b-axis. Color code: Cu (orange), S (yellow), O (red), N (blue), P (pink), C (black), H (white). | ||
The resulting structure revealed a Cu4S2 core formed by two Cu2 units connected through bridging sulfur atoms (Fig. 1C). Each Cu2 unit exhibited distinctive coordination environments: one copper center adopted tetrahedral coordination (μ3-S, P, O, and Cu), while the other displayed pentacoordination (two μ3-S, P, N, and Cu). This arrangement suggests cuprophilic interactions between copper centers. The DPPE ligands coordinated through phosphorus, while MNA was bound via nitrogen and oxygen atoms, creating a stable structural framework. Packing of the structure (3 × 3 × 3 along the b-axis) is shown in Fig. 1D and unit cell molecular packing along different axes are shown in Fig. S5 (ESI‡). Notably, all the geometric parameters determined through MicroED, including bond lengths, angles, and intermolecular distances matched well with the SC-XRD data (Table S1, ESI‡) validating MicroED's reliability for Cu NC characterization. These findings match perfectly with the SC-XRD structure (Fig. S6 ESI‡).
Building upon the successful structure determination of Cu4(MNA)2(DPPE)2, we next examined Cu4(m9-CBT)4, where MicroED revealed critical structural insights beyond those accessible through conventional methods. Gently crushed crystals deposited on lacey carbon grids (Fig. 2A) were analyzed using MicroED with 1° continuous tilt increments over a −40° to +40° rotation range, achieving 0.9 Å resolution (Fig. 2B). The most significant finding was the detection of a disordered toluene (solvent) molecule within the unit cell (Fig. 2C), a critical structural feature not observed from SC-XRD (Fig. S7, ESI‡). This discovery necessitated reassignment of the space group from P21/c (SC-XRD) to P![[1 with combining macron]](https://www.rsc.org/images/entities/char_0031_0304.gif) (MicroED), with corresponding adjustments to cell parameters (Table S2, ESI‡). MicroED-derived packing (3 × 3 × 3 along the c-axis) is shown in Fig. 2D and views along different axes are shown in (Fig. S8, ESI‡). The stronger interaction of electrons with matter makes MicroED particularly sensitive to lighter atoms and disordered structures, providing a more complete picture of the molecular environment within the crystal lattice. This finding highlights a distinctive advantage of MicroED: its capacity to resolve subtle structural features that might be missed by SC-XRD. It is important to note that geometric parameters observed through MicroED in the individual clusters were largely similar to that known from SC-XRD.
(MicroED), with corresponding adjustments to cell parameters (Table S2, ESI‡). MicroED-derived packing (3 × 3 × 3 along the c-axis) is shown in Fig. 2D and views along different axes are shown in (Fig. S8, ESI‡). The stronger interaction of electrons with matter makes MicroED particularly sensitive to lighter atoms and disordered structures, providing a more complete picture of the molecular environment within the crystal lattice. This finding highlights a distinctive advantage of MicroED: its capacity to resolve subtle structural features that might be missed by SC-XRD. It is important to note that geometric parameters observed through MicroED in the individual clusters were largely similar to that known from SC-XRD.
 | ||
| Fig. 2 MicroED reveals solvent inclusion in the Cu4(m9-CBT)4 structure. (A) TEM image of microcrystals. (B) Initial diffraction frames showing high-resolution data. (C) Resolved structure highlighting the disordered toluene molecule undetectable by SC-XRD. (D) 3 × 3 × 3 crystal packing along c-axis. Color code: Cu (orange), S (yellow), B (green), C (black), H (white). | ||
Previous studies on copper clusters have demonstrated that solvent molecules can modify intermolecular interactions and affect emission properties.19 Perruchas et al. observed that changes in crystal packing and cuprophilic interactions directly influence luminescence behavior.13 The ability to detect these previously invisible structural elements provides crucial insights into structure–property relationships in luminescent copper clusters.
This enhanced structural information proves valuable for understanding the factors that influence luminescence properties and mechanochromic behavior, which were explored further. The Cu4(o9-CBT)4 cluster exhibits a shift in emission from green to yellow upon mechanical grinding (∼20 min), with restoration of the original emission following exposure to solvent vapor (DCM, ∼30 min),18 shown in Fig. 3A. Similar mechanochromic luminescence has been observed in various copper complexes, particularly copper iodide clusters with cubane geometry [Cu4I4L4].13 However, the underlying structural mechanism has remained elusive due to the inability to obtain high-quality diffraction data from mechanically processed materials.
 | ||
| Fig. 3 MicroED directly visualizes the structural basis of mechanochromic luminescence in Cu4(o9-CBT)4. (A) Photographic images demonstrating reversible emission switching: (i) initial green emission, (ii) yellow emission after grinding (20 min), and (iii) restored green emission following DCM vapor exposure (30 min). (B) Corresponding diffraction patterns revealing: (i) initial crystallinity, (ii) complete amorphization after grinding, and (iii) restored crystallinity after solvent exposure. Crystallite sizes are visible in the inset TEM images. (C) MicroED structure from initial crystalline state. (D) Amorphous state with no resolvable structure after grinding. (E) Recovered structure from nanometer-sized recrystallized particles after solvent exposure, confirming structural restoration without molecular alteration. | ||
We conducted systematic MicroED analysis at three critical stages: before grinding, after grinding, and following solvent vapor exposure. The diffraction patterns clearly demonstrated: (i) well-defined crystallinity in the initial state, (ii) complete loss of diffraction following prolonged grinding, indicating amorphization, and (iii) restored crystallinity upon solvent vapor exposure (Fig. 3B). High-quality diffraction data enabled sub-atomic resolution (0.9 Å) structure determination (Fig. 3C) of the NC. Most remarkably, MicroED successfully resolved the structure from nanometer-sized regrown crystals after solvent exposure, confirming restoration of the original structural arrangement (Fig. 3E). The ground powder yielded no structure due to unresolvable diffraction (Fig. 3D).
This observation aligns with previous studies of copper iodide clusters, where mechanochromic properties have been attributed to distortions in crystal packing affecting cuprophilic interactions. As reported by Perruchas et al., grinding-induced structural disorder can modify Cu–Cu interactions without altering the fundamental molecular structure, directly influencing emission properties.20 The structural insights from our observations find strong theoretical support in the mechanochemical principles outlined by Yan et al. in their work on sterically controlled reactions under hydrostatic pressure.21 Their demonstration that isotropic compression induces anisotropic strain in metal–organic chalcogenides, particularly through ligand-mediated deformation of compressible Cu4S4 cores (Fig. S9, ESI‡) directly parallels our observation of amorphization-recrystallization cycles in Cu4(o9-CBT)4. They showed that rigid ligands (carboranes) act as “molecular anvils”, transmitting stress to bend Cu–S–Cu bond angles. This aligns with our findings that grinding-induced loss of long-range order without Cu–S bond rupture drives luminescence switching, while solvent exposure enables structural recovery through ligand reorganization. Our direct structural evidence confirms that mechanochromic luminescence in Cu4(o9-CBT)4 arises from disruption of long-range order followed by recrystallization, rather than chemical transformation or degradation. Fig. S10 (ESI‡) displays unit cell packing of Cu4(o9-CBT)4 in both initial crystalline state and after solvent-induced recrystallization along various axes. Comparative analysis of geometric parameters like bond lengths, angles, and intermolecular distances, from structures before grinding and after solvent vapor exposure showed remarkable consistency (Table S3, ESI‡). This confirms that individual Cu NCs maintain their molecular integrity throughout the mechanochromic cycle, with changes occurring primarily in their arrangement and long-range order. The emission shift correlates directly with the loss of crystallinity, while recovery of the original emission coincides with recrystallization.
In conclusion, the ability to directly observe this relationship through MicroED analysis of submicron crystallites provides unprecedented insights into the structure–property relationship underlying mechanochromic behavior. Unlike previous studies that relied on indirect spectroscopic evidence or theoretical calculations, our approach provides direct structural confirmation of the mechanochromic mechanism. This represents a significant advancement in understanding stimuli-responsive luminescent materials and demonstrates MicroED's exceptional utility for studying mechanical transformations of functional materials.
H. N. acknowledges UGC, Government of India for her fellowship. MicroED data were acquired at the National Facility for Cryo-Electron Microscopy at IIT Madras, supported by the Anusandhan National Research Foundation (ANRF), Government of India. T. P. thanks ANRF for funding through the grant, SPR/2021/000439 and a J. C. Bose Fellowship. T. P. thanks the Centre of Excellence on Molecular Materials and Functions under the Institution of Eminence scheme of IIT Madras.
Conflicts of interest
There are no conflicts to declare.Data availability
The data supporting this article have been included in the ESI.‡Notes and references
- I. Chakraborty and T. Pradeep, Chem. Rev., 2017, 117, 8208–8271 CrossRef CAS PubMed.
- R. Jin, C. Zeng, M. Zhou and Y. Chen, Chem. Rev., 2016, 116, 10346–10413 CrossRef CAS PubMed.
- Y. Du, H. Sheng, D. Astruc and M. Zhu, Chem. Rev., 2020, 120, 526–622 CrossRef CAS PubMed.
- Nonappa, Chem. Commun., 2023, 59, 13800–13819 RSC.
- S. Hossain, Y. Niihori, L. V. Nair, B. Kumar, W. Kurashige and Y. Negishi, Acc. Chem. Res., 2018, 51, 3114–3124 CrossRef CAS PubMed.
- A. Ghosh, O. F. Mohammed and O. M. Bakr, Acc. Chem. Res., 2018, 51, 3094–3103 CrossRef CAS PubMed.
- M. F. Matus and H. Häkkinen, Nat. Rev. Mater., 2023, 8, 372–389 CrossRef CAS.
- K. S. Sugi, A. Maier and M. Scheele, Chem. Commun., 2022, 58, 6998–7017 RSC.
- Y. Tao, M. Li, J. Ren and X. Qu, Chem. Soc. Rev., 2015, 44, 8636–8663 RSC.
- K. R. Krishnadas, A. Ghosh, A. Baksi, I. Chakraborty, G. Natarajan and T. Pradeep, J. Am. Chem. Soc., 2016, 138, 140–148 CrossRef CAS PubMed.
- A. Baghdasaryan and T. Bürgi, Nanoscale, 2021, 13, 6283–6340 RSC.
- A. Ghosh, A. Sagadevan, K. Murugesan, S. A. F. Nastase, B. Maity, M. Bodiuzzaman, A. Shkurenko, M. N. Hedhili, J. Yin, O. F. Mohammed, M. Eddaoudi, L. Cavallo, M. Rueping and O. M. Bakr, Mater. Horiz., 2024, 11, 2494–2505 RSC.
- Q. Benito, X. F. Le Goff, S. Maron, A. Fargues, A. Garcia, C. Martineau, F. Taulelle, S. Kahlal, T. Gacoin, J.-P. Boilot and S. Perruchas, J. Am. Chem. Soc., 2014, 136, 11311–11320 CrossRef CAS PubMed.
- B. L. Nannenga and T. Gonen, Curr. Opin. Struct. Biol., 2014, 27, 24–31 CrossRef CAS PubMed.
- X. Mu, C. Gillman, C. Nguyen and T. Gonen, Annu. Rev. Biochem., 2021, 90, 431–450 CrossRef CAS PubMed.
- S. Vergara, D. A. Lukes, M. W. Martynowycz, U. Santiago, G. Plascencia-Villa, S. C. Weiss, M. J. De La Cruz, D. M. Black, M. M. Alvarez, X. López-Lozano, C. O. Barnes, G. Lin, H.-C. Weissker, R. L. Whetten, T. Gonen, M. J. Yacaman and G. Calero, J. Phys. Chem. Lett., 2017, 8, 5523–5530 CrossRef CAS PubMed.
- S. Duary, A. Jana, A. Das, S. Acharya, A. R. Kini, J. Roy, A. K. Poonia, D. K. Patel, V. Yadav, P. K. S. Antharjanam, B. Pathak, A. Kumaran Nair Valsala Devi and T. Pradeep, Inorg. Chem., 2024, 63, 18727–18737 CrossRef CAS PubMed.
- A. Jana, M. Jash, W. Ahmed Dar, J. Roy, P. Chakraborty, G. Paramasivam, S. Lebedkin, K. Kirakci, S. Manna, S. Antharjanam, J. Machacek, M. Kucerakova, S. Ghosh, K. Lang, M. M. Kappes, T. Base and T. Pradeep, Chem. Sci., 2023, 14, 1613–1626 RSC.
- A. Jana, S. Duary, A. Das, A. R. Kini, S. Acharya, J. Machacek, B. Pathak, T. Base and T. Pradeep, Chem. Sci., 2024, 15, 13741–13752 RSC.
- S. Perruchas, X. F. Le Goff, S. Maron, I. Maurin, F. Guillen, A. Garcia, T. Gacoin and J.-P. Boilot, J. Am. Chem. Soc., 2010, 132, 10967–10969 CrossRef CAS PubMed.
- H. Yan, F. Yang, D. Pan, Y. Lin, J. N. Hohman, D. Solis-Ibarra, F. H. Li, J. E. P. Dahl, R. M. K. Carlson, B. A. Tkachenko, A. A. Fokin, P. R. Schreiner, G. Galli, W. L. Mao, Z.-X. Shen and N. A. Melosh, Nature, 2018, 554, 505–510 CrossRef CAS PubMed.
Footnotes |
| † Dedicated to Prof. C. N. R. Rao, FRS on his 91st birthday. |
| ‡ Electronic supplementary information (ESI) available. See DOI: https://doi.org/10.1039/d5cc02594j |
| This journal is © The Royal Society of Chemistry 2025 |