
Capturing the sol and gel states of thermoresponsive poly(2-oxazoline)/-(2-oxazine) hydrogels by ambient and subambient solid-state NMR†
Theresa
Zorn
a,
Stephanie
Bachmann
a,
Lando
Polzin
ab,
Johannes
Greiner
 a,
Robert
Luxenhofer
b and
Ann-Christin
Pöppler
*a
a,
Robert
Luxenhofer
b and
Ann-Christin
Pöppler
*a
aCenter for Nanosystems Chemistry & Institute of Organic Chemistry, Department of Chemistry and Pharmacy, Julius-Maximilians-University Würzburg, Am Hubland, 97074 Würzburg, Germany. E-mail: ann-christin.poeppler@uni-wuerzburg.de
bSoft Matter Chemistry, Department of Chemistry, Helsinki Institute of Sustainability Science, Faculty of Science, University of Helsinki, 00014 Helsinki, Finland
First published on 10th March 2025
Abstract
Recently it was shown that ABA-type triblock copolymers with pPheOzi as central B-block undergo a cooling induced order–order transition from spherical to worm-like micelles accompanied by inverse thermogelation. Previous attempts to modulate the chemical structure of the pPheOzi block prevented worm-formation or even thermogelation. Here, two novel polymer variants were synthesized bearing -CH3 or –OCH3 at the para-position of the phenyl group of pMeOx-b-pPheOzi-b-pMeOx. Rheological, μDSC and AFM analyses proved thermogelation and formation of worm-like micelles of pMeOx-b-pMeOPheOzi-b-pMeOx, while pMeOx-b-pMePheOzi-b-pMeOx remains a sol of spherical micelles. To understand the macroscopic phenomena at the molecular level, a detailed NMR study has been carried out. NMR spectroscopy in solution was used to visualize the subset of mobile polymer moieties in the corona, whereas rigid moieties were analysed by solid-state NMR spectroscopy. Intermediate motions can interfere with classical solid-state NMR analyses, but freezing the samples successfully improved the visibility of moieties in this dynamic regime. Combining solid-state NMR spectroscopy of frozen samples with DSC revealed three types of water—non-freezable bound, freezable-bound, and free water—with indications for water in the core of micelles and worms. Based on the frozen sol- and gel-state NMR experiments, the –OCH3 within the B-block could also be identified to stabilize the core–water interaction leading to prolonged thermal stability for the new pMeOx-b-pMeOPheOzi-b-pMeOx gels. This was complemented by successful loading of the hydrogel network with hydrophobic guest molecules.
Introduction
Aqueous solutions of polymers that undergo a sol–gel transition when triggered by a change in temperature are known as thermoresponsive hydrogels.1 Thermogelation of multi-block copolymers is well known in the literature and is usually induced by the combination of a hydrophilic polymer block and at least one hydrophobic or intrinsically thermoresponsive polymer block.2 Thermoresponsive polymers with reduced solubility above a certain temperature are known as lower critical solution temperature (LCST) type polymers. Heating-induced gelation is therefore referred to as LCST-type thermogelation.3 In turn, reduced solubility below a critical temperature and gelation upon cooling is referred to as upper critical solution temperature and the corresponding gelation is sometimes referred to UCST-type gelation, even though there is typically not an actual phase transition involved. More generically, the cooling induced gelation can be referred to as inverse thermogelation.4A precise sol–gel transition temperature (Tsol→gel) and rapid gelation resulting in a gel with defined and ideally tuneable macroscopic properties is desirable for the successful application as smart biomaterials, e.g. for bioprinting.5 Systematic tuning of gelation remains a challenge because of the many factors that influence it. It is reported that with increasing degree of polymerization, gelation can be achieved at lower temperatures and lower critical gelation concentrations (CGC).6 In the case of multiblock copolymers, not only the total length of a polymer chain but also the ratio between hydrophilic, hydrophobic and/or thermoresponsive blocks can be varied. In particular, increasing the ratio of the hydrophobic polymer block can shift Tgel→sol and CGC to lower values and induce higher gel strength.5,7 In both cases, increasing the block length and increasing the hydrophobic ratio can reach an upper limit where precipitation or phase separation occurs instead of gelation.5 Since the gelation process is usually accompanied by the arrangement of the polymer strands into an organized structure, changing the design of a polymer from a block copolymer to less ordered random or gradient copolymers may result in no gelation or weak gels.5,8 Predicting how changes in the chemical composition of a polymer will affect its gelation is certainly more complex.
Previously, Hahn et al. described the first ABA-type triblock copolymer based on poly(2-oxazoline) (pOx) – poly(2-oxazine) (pOzi) undergoing inverse thermogelation in water, namely poly(2-methyl-2-oxazoline)-block-poly(2-phenyl-2-oxazine)-block-poly(2-methyl-2-oxazoline) (pMeOx-b-pPheOzi-b-pMeOx = A-pPheOzi-A, Fig. 1).9 The gel–sol transition was observed to occur rapidly upon heating to around 32 °C, while a sphere-to-worm, order–order transition upon cooling results in relatively slow gelation with a considerable hysteresis between Tgel→sol and Tsol→gel. Already small variations of the hydrophilic blocks (Fig. 1, blue box), e.g. by introducing an additional methylene unit in the side chain using poly(2-ethyl-2-oxazoline) (pEtOx) or in the backbone using poly(2-methyl-2-oxazine) (pMeOzi) were shown to significantly affect its aggregation behaviour and gelation.10 Both polymers, like A-pPheOzi-A, undergo inverse thermogelation in a similar temperature range, accompanied by a sphere-to-worm transition upon cooling.11 Nevertheless, these modified polymers differ in their macroscopic properties like gel strength and persistence from the original A-pPheOzi-A polymer, whereas the overall gelation mechanism appears to remain the same. Replacing pMeOx by the chemically rather different polyethylene glycol (PEG) as hydrophilic A-block results in a triblock copolymer, which also shows sphere-to-worm transition-based thermogelation, albeit much faster, resulting in thermogels with high gel strengths.8
 | ||
| Fig. 1 Overview of the A-block (blue box) and B-block (orange and grey box) modifications of the original ABA-type triblock copolymer pMeOx-b-pPheOzi-b-pMeOx (white box) with the modifications investigated here indicated by a dotted black box. Additional chemical moieties compared to pMeOx-pPheOzi-pMeOx are highlighted in red while blue bonds indicate a missing methylene unit in between. | ||
Fascinatingly, similar changes in the hydrophobic B-block by reducing the pPheOzi backbone by a methylene unit (poly(2-phenyl-2-oxazoline)), shifting a methylene unit from the pPheOzi backbone to the side-chain (poly(2-benzyl-2-oxazoline)), or adding an additional methylene unit to the side-chain (poly(2-benzyl-2-oxazine)) resulted in non-gelling aqueous solutions of these polymers (Fig. 1, grey box).9 However, poly(2-phenethyl-2-oxazoline) as well as poly(2-benzhydryl-2-oxazine) as hydrophobic B-blocks in combination with pMeOx as hydrophilic A-blocks again show inverse thermogelation of 20 wt% aqueous solutions albeit not accompanied by the morphological change from spherical micelles to worm-like structures in its gel state (Fig. 1, red box).10,12 This led to the hypothesis that chemical modifications, which change the flexibility or steric demand of the hydrophobic B-block interfere with the underlying gelation mechanism. Certainly, more modifications are conceivable for testing this hypothesis. Additionally, more detailed insights on the arrangement and interaction of the components on a molecular level would help to enable targeted tuning of the thermoresponsive aggregation and macroscopic properties of resulting hydrogels through structure–property relations.
A variety of NMR spectroscopic techniques is available for achieving insights into hydrogels on a nanoscale level.13,141H NMR based investigations including relaxometry and diffusion measurements of hydrogels in H2O can provide valuable insights into water structuring and mobility.15 A closer look at the polymer network itself can be obtained by performing 1H and 13C NMR spectroscopy on the hydrogel in D2O. This offers details on cross-linking16 and the resulting mesh size, aggregation changes during the sol–gel transition,14 and network inhomogeneities and defects.17 NMR has already proven to be a valuable tool for understanding the molecular-level processes of the aggregation of the A-pPheOzi-A polymer and its A-block homologues, namely the pEtOx-B-pEtOx and pMeOzi-B-pMeOzi polymers.11 Given the limitations of NMR in solution being only feasible for the subset of mobile polymer moieties and that solid-state NMR has a markedly limited applicability for polymer sol samples due to fast isotropic tumbling of micelles,18 an alternative approach is required for a detailed analysis of polymer sol samples by NMR spectroscopy.
Changes in temperature have a strong effect on molecular motion, in addition to the inherently higher sensitivity of NMR at low-temperatures due to Curie's law.19 At high temperatures, when molecular motions are fast, NMR linewidths are sharp due to motional narrowing.19 However, motions on intermediate timescales, which are in a range similar to the MAS frequency or the decoupling field, cause strongly broadened linewidths.20,21 By lowering the measurement temperature molecular motion can be slowed down or even frozen. The effect of freezing molecular motion is well understood for small molecules and can lead either to line sharpening if the molecule is trapped in its most stable conformation or to line broadening if the molecule is frozen in numerous conformations with slightly different chemical shifts.19,22 Certainly, the situation is more complex for low-temperature NMR measurements of macromolecules in a frozen aqueous environment. Nevertheless, NMR investigations on frozen aqueous solutions of proteins are used to study exchange processes or out-of-equilibrium states, for example during protein folding.23,24 However, NMR investigations on frozen hydrogels are rare in literature. The literature is mainly based on the use of dynamic nuclear polarization (DNP) NMR at 100 K to investigate polymers or hydrogels, taking advantage of the signal enhancement provided by DNP without focusing on the effects of freezing the sample.25 For example, Dwivedi et al. used DNP NMR performed at 100 K to investigate glycosaminoglycan (GAGs) and collagen proteins located in cartilage.26 Moreover, polyacrylamide hydrogels were used as DNP matrices (DNP jelly) providing efficient signal enhancements for embedded inorganic nanoparticles measured at 100 K. Nevertheless, the effect of freezing on the DNP jelly has not been studied.27 Besides that, Colquhoun et al. measured 13C CP MAS NMR of amylose hydrogels at room temperature and at −43 °C. At the lower temperature, a previously mobile sample fraction was ‘frozen’ and thus made visible in the NMR spectrum.28 Here, we exploit the immobilization effect of freezing aqueous polymer aggregates to facilitate solid-state NMR investigations on the molecular level of both polymer gels and sols. Poly(2-oxazoline) based polymers were chosen as a platform due to being easily chemically modified, promising for biomedical applications, e.g. they are discussed as a PEG-alternative, and because from an analytical perspective, they don’t contain hydrogen bond donating functional groups. With two new poly(2-oxazoline) copolymers and a comparative analysis between different hydrogel-forming as well as non-forming polymers in the frozen state, we aim for an improved molecular-level understanding of these materials to explain their different gelling behavior.
Materials and methods
Materials
All chemicals used for monomer synthesis and polymerization were purchased from Sigma-Aldrich (Steinheim, Germany) or TCI-chemicals (Eschborn, Germany) and were used as received unless otherwise stated. All deuterated solvents for NMR analysis were obtained from Euroisotop (St-Aubin Cedex, France) and Deutero GmbH (Kastellaun, Germany). Methyl trifluoromethanesulfonate, 2-methyl-2-oxazoline, 2-(4-methoxyphenyl)-2-oxazine, and 2-(4-methylphenyl)-2-oxazine were refluxed over calcium hydride and distilled prior to usage. Benzonitrile was dried over phosphorus pentoxide and distilled prior to usage, as well. All dried chemicals were stored under dry and inert conditions.Poly(2-methyl-2-oxazoline)-block-poly(2-phenyl-2-oxazine)-block-poly(2-methyl-2-oxazoline) (A-pPheOzi-A = pMeOx-b-pPheOzi-b-pMeOx) was synthesized according to previously published protocols.9,11 Polyethylene glycol-block-poly(2-phenyl-2-oxazine)-block-polyethylene glycol (PEG-b-pPheOzi-b-PEG = PEG-pPheOzi-PEG) was kindly provided by Anna-Lena Ziegler, from the working group of Prof. Luxenhofer, University of Helsinki, Finland.8,11
Synthesis
The two monomers 2-(4-methoxyphenyl)-2-oxazine and 2-(4-methylphenyl)-2-oxazine as well as the resulting triblock copolymers were synthesized according to the literature.9,11,29 A detailed description of the synthesis protocols is given in the ESI.†Size exclusion chromatography (SEC)
Size exclusion chromatography measurements were performed at a Polymer Standard Services PSS (Mainz, Germany) SECurity system with isocratic pump, degasser and autosampler, UV and RI detector. The system was equipped with a precolumn: 50 × 8 mm PSS PFG linear M and 2 columns: 300 × 8 mm PSS PFG linear M (particle size 7 μm; pore size 0.1–1.000 kg mol−1). Hexafluoroisopropanol (HFIP containing 3 g L−1 potassium trifluoroacetate (KTFA), Fisher Scientific) was used as eluent with a flow of 0.8 mL min−1 at a temperature of 40 °C. The system was calibrated by poly(methyl methacrylate) (PMMA, Polymer Standards Service) standards. All samples were dissolved in HFIP and filtered through 0.2 μm GHP filters (Acrodisc) before measurement.Differential scanning calorimetry (DSC)
Glass transition temperatures (Tg) of all synthesized polymers and melting temperatures after freezing of the aqueous polymer solutions were obtained by DSC measurements. DSC measurements were performed on a DSC 8000 (PerkinElmer Inc.) equipped with a Intracooler 2 (PerkinElmer Inc.) and operating under nitrogen atmosphere at constant heating and cooling rates of 5 °C min−1. About 10 mg of each dried polymer powder/aqueous polymer solution were weight into an aluminium crucible with a crimped-on lid. For Tg determination three cycles from −50 °C to 200 °C and subsequent cooling to −50 °C were measured. For ice melting after freezing two cycles from 5 °C to −50 °C and subsequent heating to 93 °C were measured with a rate of 5 °C min−1. For comparison of A-pPheOzi-A gel vs. sol DSC heating curves were measured from −50 °C to 50 °C with a rate of 1 °C min−1 of 20 wt% aqueous solutions of A-pPheOzi-A, which were frozen with a rate of 20 °C min−1 starting from 5 °C (A-pPheOzi-A gel) or 40 °C (A-pPheOzi-A sol). The curves obtained were evaluated with OriginLab. The Tg was defined as the turning points of the stages in the heating curves characteristic of glass transitions and determined from the third heating curve in each case. The melting temperature after freezing is defined as the onset of the endothermal transition.Micro differential scanning calorimetry (μDSC)
μDSC measurements were performed on a Malvern MicroCal PEAQ-DSC system. The heat of the sample was measured relative to pure water and the enthalpy values were normalized to the molar concentration of the aromatic repeat units. The polymers were diluted with ultrapure water to a final concentration of 10 g L−1 and stored for 24 h at 4 °C. Before measuring the samples were degassed at 5 °C for 5 min and subsequently heated to 100 °C with a rate of 1 °C min−1. The samples were equilibrated at different temperatures and varying lengths of times.Rheology
A Modular Compact Rheometer MCR-302 (Anton Paar, Ostfildern, Germany) was used equipped with a solvent trap and a Peltier element H-PTD200 (Anton Paar). The rheometer was equipped with a plate-plate geometry of 25 mm diameter (PP25, Anton Parr). The obtained data was evaluated with RheoCompassTM (Anton Paar). All measured hydrogel samples were stored at 5 °C for at least 24 h before the measurement. Temperature-sweep measurements were performed starting at 5 °C and subsequent heating to 70 °C with a constant rate of 0.05 °C s−1. The measurements were performed in the oscillation mode using a fixed amplitude of 0.1% and angular frequency of 10 rad s−1.Transmission electron microscopy (TEM)
Cryo transmission electron microscopy (cryoTEM) was measured using a Gatan 626 cryo-transfer holder for the vitrified samples in an FEI Tecnau T12 Spirit transmission electron microscope equipped with a LaB6 emitter at 120 kV. Images were obtained with an Eagle CCD camera under low-dose conditions. The micrographs were binned two times, resulting in a pixel size of 4.4 Å per pix or 2.2 Å per pix at the specimen level. Polymer samples were adjusted to a concentration of 20 g L−1 in MilliQ water and 3.5 μL of the aqueous sample were placed on Quantifoil copper grids (400 mesh, R1/2) and plunge-frozen in liquid ethane with a Vitrobot IV (FEI). The humidity was set to 100%, the temperature to 5 °C.Atomic force microscopy (AFM)
AFM measurements were performed under ambient conditions using a Bruker Multimode 8 SPM system operating in tapping mode in air. Silicon cantilevers (OMCL-AC240TS, Olympus) with a resonance frequency of ≈70 kHz and a spring constant of ≈1.7 N m−1 were used. The hydrogels were diluted (20-fold dilution) to get a clear solution. For preparation of AFM samples, the diluted hydrogels were spin-coated onto silicon wafer (SiOx) with 3000 rpm.Fourier transform infrared spectroscopy (FT-IR)
FT-IR was performed using a FT/IR-4600 type A instrument with ATR Pro ONE, A070661809 from JASCO instruments. Polymer samples were measured in a dried state and prepared at 20 wt% solution in D2O. Aqueous polymer samples were kept a specific temperature for at least 24 h before measurement before they were measured.Nuclear magnetic resonance (NMR)
All 1H NMR experiments for reaction control were performed at a Bruker Avance Neo spectrometer operating at 9.4 T with a 5 mm iProbe and z-gradient. 1H NMR experiments were acquired at 295.4 K with a 30° flip angle, 16 scans, relaxation delay of 0.2 s and without spinning. NMR in solution of 20 wt% aqueous sol–gel samples were performed at a Bruker Avance III HD 600 spectrometer operating at 14.1 T equipped with a BBFO 5 mm probe using a BCU-02 temperature control unit. A series of variable temperature 1H NMR experiments was performed in the range from 5 °C to 40 °C (PEG-pPheOzi-PEG) or 90 °C (A-pMeOPheOzi-A, A-pMePheOzi-A) in 5 °C steps. Solid-state NMR of 20 wt% aqueous sol–gel samples was measured using a 4 mm double-channel HX probe and a Bruker Avance Neo spectrometer operating at 9.4 T with 5–8 kHz magic angle spinning (MAS). All samples were measured in Kel-F inserts to prevent leaking of the aqueous samples and at 273 K to ensure a persistent and stable gel (if possible) throughout the measurements. Solid-state NMR of 20 wt% frozen aqueous sol–gel samples was performed using a 3.2 mm double-channel probe and a Bruker Avance III HD spectrometer operating at 14.1 T with 7 kHz magic angle spinning (MAS). The samples were cooled to 245 K to obtain a completely frozen sample throughout the measurements, although temperature calibration demonstrated an increase in temperature of +5 K due to frictional heating. For the 13C cross polarization (CP) MAS experiment, a 1 ms or 2 ms ramp (90 to 100%) on the 1H channel was used during the cross-polarization contact time for all samples. In general, 13C CP MAS with 2 ms contact time for observing rigid polymer moieties and 13C direct excitation (DE) MAS experiments with a short interscan delay of 2 s were acquired to observe mobile species. A more detailed description of the measurement parameters along with additional NMR experiments can be found in the ESI.†Results and discussion
Based on the original pMeOx-b-pPheOzi-b-pMeOx = A-pPheOzi-A triblock copolymer, two novel polymers were obtained by varying the electron density and steric demand of the pPheOzi B-block. This was done through additional methyl- or methoxy group in para position of the phenyl group. Accordingly, poly(2-methyl-2-oxazoline)-block-poly(2-(4-methylphenyl)-2-oxazine)-block-poly(2-methyl-2-oxazoline) (pMeOx-b-pMePheOzi-b-pMeOx = A-pMePheOzi-A) and poly(2-methyl-2-oxazoline)-block-poly(2-(4-methoxyphenyl)-2-oxazine)-block-poly(2-methyl-2-oxazoline) (pMeOx-b-pMeOPheOzi-b-pMeOx = A-pMeOPheOzi-A) were prepared and characterized (Fig. 2). In addition, to better distinguish the hydrophilic and hydrophobic blocks in NMR spectroscopy, we included an A-block substituted polyethylene glycol-block-poly(2-phenyl-2-oxazine)-block-polyethylene glycol (PEG-b-pPheOzi-b-PEG = PEG-pPheOzi-PEG) as a reference polymer for NMR investigations due to its comparable macroscopic thermogel properties to A-pPheOzi-A.8 | ||
| Fig. 2 Overview of the investigated ABA-type triblock copolymers, namely pMeOx-b-pPheOzi-b-pMeOx (black), PEG-b-pPheOzi-b-PEG (grey), pMeOx-b-pMeOPheOzi-b-pMeOx (brown) and pMeOx-b-pMePheOzi-b-pMeOx (orange). The introduced colour code is used for all following figures. The chemical modifications with respect to pMeOx-b-pPheOzi-b-pMeOx are indicated by red dotted circles. | ||
All polymers exhibit a single glass transition temperature (Tg) as measured by DSC of the dried polymer samples (Fig. S8, ESI†). This indicates a homogenous structure without (micro)phase separation (in the solid state) meaning that the individual blocks of the triblock copolymers are miscible.30 Subsequently, 20 wt% aqueous solutions of A-pMeOPheOzi-A and A-pMePheOzi-A were prepared for direct comparison with the A-pPheOzi-A hydrogel.
Analysis of the gel–sol transition by μDSC
μDSC measurements on these aqueous polymer samples showed that A-pMeOPheOzi-A exhibits a broad endothermic transition between 65–85 °C (Fig. 3b). This transition has been identified as a gel–sol transition (Tgel→sol) well above the Tgel→sol of A-pPheOzi-A (35 °C) and PEG-pPheOzi-PEG (34 °C) (both Fig. S9, ESI†). Surprisingly, no endothermic transition can be detected for A-pMePheOzi-A in this temperature range (Fig. 3a). Although both polymers differ by only a methyl or methoxy group compared to A-pPheOzi-A, these groups appear to be highly influential on polymer aggregation. Moreover, it must be noted that for A-pMeOPheOzi-A the Tg is below its Tgel→sol, which is contrary to A-pPheOzi-A and implies a higher mobility of the respective polymer chains even in the gel state.31 | ||
| Fig. 3 Gel–sol transition temperature (Tgel→sol) determination via μDSC and Rheology. μDSC thermograms of the 1 wt% aqueous samples of (a) A-pMePheOzi-A and (b) A-pMeOPheOzi-A. Polymer solutions were held at 4 °C for the time indicated prior to the thermoscan. Temperature sweeps for determination of the storage (G′) and loss modulus (G′′) measured from 5–70 °C with a heating rate of 0.5 °C min−1 of 15 wt% aqueous samples of (c) A-pMePheOzi-A and d) A-pMeOPheOzi-A. All samples were stored at 5 °C for at least 24 h before measurement. Both polymers were measured before and after heating to 105 °C for several minutes and cooling back to 5 °C for 24 h. | ||
Analysis of the macroscopic mechanical properties by rheology
The temperature dependent mechanical properties of the aqueous polymer samples were characterized by rheology after being stored at 5 °C for 24 h, the intention being to facilitate gel formation (Fig. S11 and S14, ESI†) analogous to A-pPheOzi-A. However, the aqueous sample of A-pMeOPheOzi-A showed only a marginally higher storage modulus (G′) than loss modulus (G′′) at 5 °C, contrasting the gel–sol transition observed for this polymer in the μDSC measurements. When we incubated another sample of A-pMeOPheOzi-A well above its Tgel→sol at 105 °C for several minutes and then cooled back to 5 °C for at least 24 h, the sample showed a distinct gel-like character at 5 °C (G′ > G′′). In addition, G′ increased from 9.1·102 Pa to 1.2·104 Pa after heating above its Tgel→sol and cooling back to 5 °C (Fig. 3d). It appears that a certain temperature or energy barrier must first be exceeded to induce reorganization of the polymer strands into a stable gel structure. The actual gel–sol transition of A-pMeOPheOzi-A could not be studied by rheology due to its high temperature. Although a similar approach was tested for A-pMePheOzi-A, both samples before and after heating to 105 °C showed identical rheological properties of a viscous polymer solution at 5 °C and a low G′ of around 5.8 Pa (Fig. 3c). This supports the μDSC measurements, which showed no gel–sol transition of this aqueous polymer solution. Taken together, μDSC and rheology analysis provide evidence that apart from pPheOzi-based triblocks, thermogelation also occurs for the A-pMeOPheOzi-A triblock copolymer, but not for A-pMePheOzi-A. In addition to the significantly higher gel–sol transition temperature compared to the original A-pPheOzi-A polymer, A-pMeOPheOzi-A does not form a mechanically stable hydrogel upon cooling until a certain temperature is exceeded.Analysis of the aggregation morphologies by AFM and cryoTEM
The morphologies of the macroscopically quite different polymer self-assemblies at 5 °C were recorded by AFM snapshots of the diluted (≈1 wt%) and spin-coated polymer samples. Initially, AFM was employed to visualize the known worm-like morphologies of A-pPheOzi-A in the gel state, thereby verifying the applicability of AFM to capture these microstructures. Indeed, an interconnected fiber network with an average diameter of 7–10 nm could be resolved (Fig. 4a). For A-pMePheOzi-A and A-pMeOPheOzi-A, two snapshots were taken at 5 °C before and after heating to 105 °C. For A-pMeOPheOzi-A, snapshots were taken using AFM (Fig. 4c and d) and negative stain transmission electron microscopy (TEM) imaging (Fig. S16a and b, ESI†) to account for method-dependent changes in the visibility of aggregation. Within both methods mixtures of spherical and elongated aggregates were found. | ||
| Fig. 4 Morphologies of the diluted (≈1 wt%) aqueous samples of A-pPheOzi-A (a), A-pMeOPheOzi-A before (b) and after heating to 105 °C (c), A-pMePheOzi-A before (d) and after heating to 105 °C (e) and (≈2 wt%) PEG-pPheOzi-PEG (f). All samples were stored at 5 °C for at least 24 h before measurement. (a)–(e) Height AFM images of spin-coated samples on SiOx. Z scale is 12 nm. (f) cryoTEM image of the vitrified PEG-pPheOzi-PEG sample. | ||
The average diameter varied slightly before (9–11 nm) (Fig. 4c), and after heating (12–16 nm) (Fig. 4d). The aggregates appear to be overall more uniform in length and appearance after heating (Fig. S15, ESI†) although they are generally shorter and somewhat thicker compared to the A-pPheOzi-A polymer. In contrast, only spherical micelles were identified in both A-pMePheOzi-A samples. Notably, the spherical micelles exhibited enhanced uniformity after heating (Fig. 4f and Fig. S15, ESI†), as shown by the observed diameters (2–15 nm) compared to pre-heating (3–36 nm) (Fig. 4e).
Using AFM, we were not able to image the PEG-pPheOzi-PEG morphologies under the conditions chosen, so cryoTEM images were obtained. Interestingly, cryoTEM images of the PEG-pPheOzi-PEG hydrogel, although so far always behaving comparable to A-pPheOzi-A and contrasting the negative stain images published elsewhere,8 show long interconnected helix-like worms (Fig. 4b). A further in-depth investigation of the PEG-pPheOzi-PEG thermogelation mechanism seems therefore warranted to understand the differences in microstructure but is beyond the scope of this manuscript.
In summary (Table 1), 20 wt% aqueous solutions of an ABA-type triblock copolymer with pPheOzi as the hydrophobic B-block undergo UCST-type inverse thermogelation with Tgel→sol around 30 °C. This seems to be independent of the modifications (pMeOx vs. pEtOx, pMeOzi)11 within the hydrophilic block A-block and is maintained even when the A-block is replaced by a chemically rather distinct building block (pMeOx vs. PEG).8 Modifications within the hydrophobic block (A-pPheOzi-A vs. A-pMeOPheOzi-A, A-pMePheOzi-A) have a greater effect on polymer aggregation. Only A-pMeOPheOzi-A still undergoes inverse thermogelation and worm-formation, although with a significantly increased Tgel→sol above 65–85 °C and only after being heated once. This suggests that a greater energy barrier must be surpassed for the initial formation of the worm-like structures, yet this leads to thermodynamically more enduring aggregations afterwards. Conversely, a 20 wt% aqueous solution of A-pMePheOzi-A is present as a highly viscous solution consisting of spherical micelles similar to poly(2-phenyl-2-oxazoline), poly(2-benzyl-2-oxazoline), or poly(2-benzyl-2-oxazine) B-blocks as published previously.9 Considering these observations, a more detailed understanding of how changes within the hydrophobic units alter UCST-type inverse thermogelation of polymers is necessary. For this reason, the aggregation of A-pMeOPheOzi-A and A-pMePheOzi-A polymers was analyzed in detail using different NMR spectroscopic tools. To support the NMR-based investigations, A-pPheOzi-A was used for comparison and extended by PEG-pPheOzi-PEG. This polymer exhibits similar macroscopic, thermogelling properties, but contains hydrophilic A-blocks that can be straightforwardly distinguished from the hydrophobic B-blocks in NMR spectroscopic analyses.
| Polymers | T g | T gel→sol | Aggregate Morphology (5 °C) | G′ (5 °C) | |
|---|---|---|---|---|---|
| A-pPheOzi-A | 77 °C | 35 °C | Long worm-like strands | 2.6·104 Pa | |
| A-pMeOPheOzi-A | 14 °C | 65–85 °C | Short worm-like strands | Before heating | 9.1·102 Pa |
| After heating | 1.2·102 Pa | ||||
| A-pMePheOzi-A | 10 °C | x | Spheres | Before heating | 5.8 Pa |
| - | After heating | 4.8 Pa | |||
| PEG-pPheOzi-PEG | −27 °C | 34 °C | Long helix-like worms | 4.9·104 Pa | |
Analysis of hydrogel by solution-state NMR approaches
It is well known that 1H NMR in solution is an easy and direct method to probe coil-globe transitions of polymers.14 Above the UCST/below LCST temperature, a collapse of well-solvated polymer coils into phase separated polymer globules takes place accompanied by a dehydration and rigidification of the polymer chains. This transition is instantaneously visible as a loss of intensity of the polymer signals due to fast T2 relaxation of rigid polymer moieties.14It must be noted that also at high temperatures, the polymer sol comprises micellar aggregates and therefore the B-block is always located within the core and shielded from the aqueous environment. 1H NMR measurements in solution in the temperature range of the gel–sol transition (5–40 °C/90 °C) were performed to probe changes in mobility of the different polymer moieties. For quantification of the intensity changes of the different polymeric proton signals the p-ratios were calculated (eqn (1)), with p being the fraction of rigidified protons appearing invisible in the 1H NMR spectrum due to fast T2 relaxation.32
 | (1) |
1H NMR measurements of A-pMePheOzi-A (Fig. S17, ESI†) and A-pMeOPheOzi-A were acquired from 5–90 °C. Almost no change of signal intensities for A-pMeOPheOzi-A protons is observed until 60 °C (Fig. 5a). A rather sudden increase of intensity is measured at temperatures above 60 °C, seemingly induced by a softening of the aggregates corresponding well to the Tgel→sol at 65–85 °C found with μDSC. The phenyl protons appear most affected, but also the backbone protons strongly gain signal intensity. During cooling the situation is not simply reversing for A-pMeOPheOzi-A. Instead, a hysteresis is observed with persistently intense signals from 90 °C until 70 °C before a rapid decrease in signal intensity is observed. Armes et al. reported a hysteresis associated with multiple changes in the morphology of the polymer aggregates.31 This may not be the case here, as changes in the aggregation morphology should be associated with transitions observed by μDSC.
 | ||
| Fig. 5 Calculated p-ratios from the different proton peak integrals as a function of temperature from 5–90 °C in steps of 5 °C measured of 20 wt% sample of A-pMeOPheOzi-A (a), A-pMePheOzi-A (b), and PEG-pPheOzi-PEG (c) in D2O. All samples were stored at 5 °C for at least 24 h before the measurement. (d) 1H NMR spectra of a 20 wt% sample of A-pMeOPheOzi-A in D2O measured at different temperatures between 5–90 °C. The peaks between 7.5–6.5 ppm refer to the phenyl group, between 4.0–3.0 ppm to the methylene backbone unit neighboring the amide function, between 2.5–2.0 ppm to the methyl group of the pMeOx side-chains, and between 1.7–1.5 ppm to the central methylene unit of the pPheOzi backbone. The spectra were recorded at 14.1 T, with a 90° flip angle, and a relaxation delay of 25 s to ensure that equilibrium magnetization is recovered (Fig. S19, ESI†). | ||
However, a hysteresis between heating and cooling cycles is also reported for phase transitions of polymers with high Tg values and the resulting reduced mobility of the polymer chains is the cause of the slow and delayed rearrangement of the polymer chains.33 The rather low Tg of 14 °C for A-pMeOPheOzi-A does not support this assumption. Nevertheless, sharp aromatic signals were measured for A-pMeOPheOzi-A at elevated temperatures, having a linewidth only slightly broader than those of non-aggregated polymer strands measured in CDCl3. Moreover, an additional backbone signal corresponding to the hydrophobic B-block appears at 3.1 ppm above 80 °C and is only clearly resolved for A-pMeOPheOzi-A (Fig. 5d). Presumably, at very high temperatures the polymer strands of A-pMeOPheOzi-A are loosely packed and well hydrated, which might be due to the additional methoxy groups providing an additional H-bonding acceptor functionality per repeating unit enhancing interactions with water molecules. These distinctive attributes of A-pMeOPheOzi-A provide a rationale for the high resolution of the phenyl and backbone signals at elevated temperatures and might, despite the low Tg, cause a slow restructuration into worm-like aggregates causing the hysteresis upon cooling. Both observations are exclusively found for A-pMeOPheOzi-A.
A-pMePheOzi-A also exhibits a steadily increasing p-fraction upon cooling (Fig. 5b), although no gelation occurs. Three heating and cooling cycles yielded fully reversible and reproducible results. Here, increasing the temperature leads to a looser aggregation, resulting in steadily decreasing p-fractions. In contrast, the more rigid and thermodynamically stable gel-forming morphologies are characterized by largely invariant p-ratios upon heating and a sudden and very steep decrease until Tgel→sol is reached. This finding is not only supported by the p-ratios of pMeOx-A-pMeOx, as published previously,11 but similarly found for thermogelling PEG-pPheOzi-PEG (Fig. 5c and Fig. S18, ESI†). Making use of the chemically distinct PEG and pPheOzi units shows that the hydrophilic PEG is barely affected by gelation. On the contrary, the entire hydrophobic B-block is equally involved in the stiffening of the system. Analysis of this block copolymer also clearly shows that this includes the backbone protons, which were masked by the hydrophilic pMeOx backbone protons in all other polymers.
Solid-state NMR measurements of the hydrogels
NMR in solution is limited by the massive loss of signal intensity and hence of information upon gelation and rigidification of the polymeric systems. Therefore, solid-state NMR measurements of 20 wt% aqueous samples of the polymers were acquired in their hydrogel state (if a hydrogel is formed). As no changes in the proton spectra of the polymers were observed with increasing MAS rates, it was assumed that MAS does not interfere with gelation (Fig. S21, ESI†).Two different carbon spectra were recorded as they are particularly suitable for distinguishing mobile from immobile polymeric moieties.34 Direct excitation (DE) carbon spectra with short interscan delay show mobile carbon environments, and indeed only hydrophilic A-block carbon signals are observed in the DE spectra of all samples. These spectra can therefore be used to map the mobile corona of the aggregates, which appears to be formed only by the hydrophilic polymer units. As A-pPheOzi-A, A-pMeOPheOzi-A and A-pMePheOzi-A samples all share an identical chemical composition of the hydrophilic A-blocks, similar DE spectra were obtained for those polymers (Fig. 6a). In contrast, the spectrum of the PEG-based triblock copolymer shows only one signal corresponding to hydrophilic PEG.
 | ||
| Fig. 6 Solid-state NMR spectra of 20 wt% aqueous samples of A-pPheOzi-A, PEG-pPheOzi-PEG, A-pMeOPheOzi-A and A-pMePheOzi-A. All samples were stored at 5 °C for at least 24 h before measurement except of the A-pPheOzi-A sol sample, which was measured at 35 °C. All spectra were recorded at 9.4 T and at 0 °C (except A-pPheOzi-A sol) and scaled to matching peak intensities for best comparability. (a) 13C NMR spectra with 5–8 kHz MAS using DE and a short interscan delay of 1 s. (b) 13C NMR spectra with 5–8 kHz MAS using CP MAS with 2 ms contact time. | ||
In contrast, carbon spectra measured with cross-polarization (CP) are predominantly sensitive to rigid moieties.18,35 Therefore, these spectra should show carbon signals located in the densely packed region of the aggregates corresponding to those moieties appearing invisible to NMR in solution. CP spectra can under certain circumstances contain also signals of mobile components, which must also be considered for evaluation.18 All gelling samples show similar CP spectra (Fig. 6b). Compared to the respective DE spectra of the hydrogel samples, carbonyl moieties with a differing chemical shift, phenyl carbon signals and all backbone carbons, including the pPheOzi central backbone unit, are visible in the 13C CP MAS spectra. These signals all correspond to the respective hydrophobic B-block, which seems to be the primary building block of the rigid core of the polymeric aggregates (Fig. S22–S24, ESI†).
Interestingly, an additional backbone signal at lower ppm values (black dotted box Fig. 6b), which was not observed in the DE data, is detected for the A-pMeOPheOzi-A, PEG-pPheOzi-PEG and A-pPheOzi-A polymer aggregates. This backbone signal is not seen for any of the polymers dissolved in an organic solvent, but only when gelled in aqueous solution (Fig. S24, ESI†). Therefore, it might relate to a specific conformation of the backbone, which is either only formed upon gelation or is only observable in a stable gel. Moreover, this signal is not observed for the non-gelling A-pMePheOzi-A (Fig. S23, ESI†) or A-pPheOzi-A in its sol state.
Generally, both A-pMePheOzi-A and the heated A-pPheOzi-A sol lack intensity and good resolution for carbonyl and phenyl moieties. Mainly backbone and methyl group peaks similar to those measured in the DE are visible. The lack of significant CP signal in the polymer sol samples is most likely due to isotropic tumbling of the polymeric micelles averaging molecular-scale anisotropic dynamics and therefore being generally inefficient for CP transfer.18 To overcome the limitations of poorly immobilized sol samples and to make sure that all peaks can be resolved with solid-state NMR, the polymeric samples were frozen in their respective sol or gel state. This slows down the dynamics of the whole system, allowing more efficient CP transfer. Particular attention will be paid to the appearance of new backbone signals, which have previously only been found in gelling polymer samples.
Solid-state NMR measurements of the frozen aqueous polymer solutions
The aqueous polymer samples were transferred to the solid-state NMR rotors in their sol state to achieve a homogeneous filling. Afterwards, all hydrogel samples were stored at 5 °C for at least 24 h to allow complete gel formation, while the A-pPheOzi-A sol sample was stored above its gel–sol transition temperature. Subsequently, each sample was transferred to the NMR spectrometer and immediately cooled to Tset = −28 °C. Due to frictional heating at 8 kHz MAS, the actual sample temperature was −23 °C (Fig. 7). In all cases, freezing was achieved within a few minutes as monitored by a jump in the wobble curve, which we systematically investigated in a separate work.36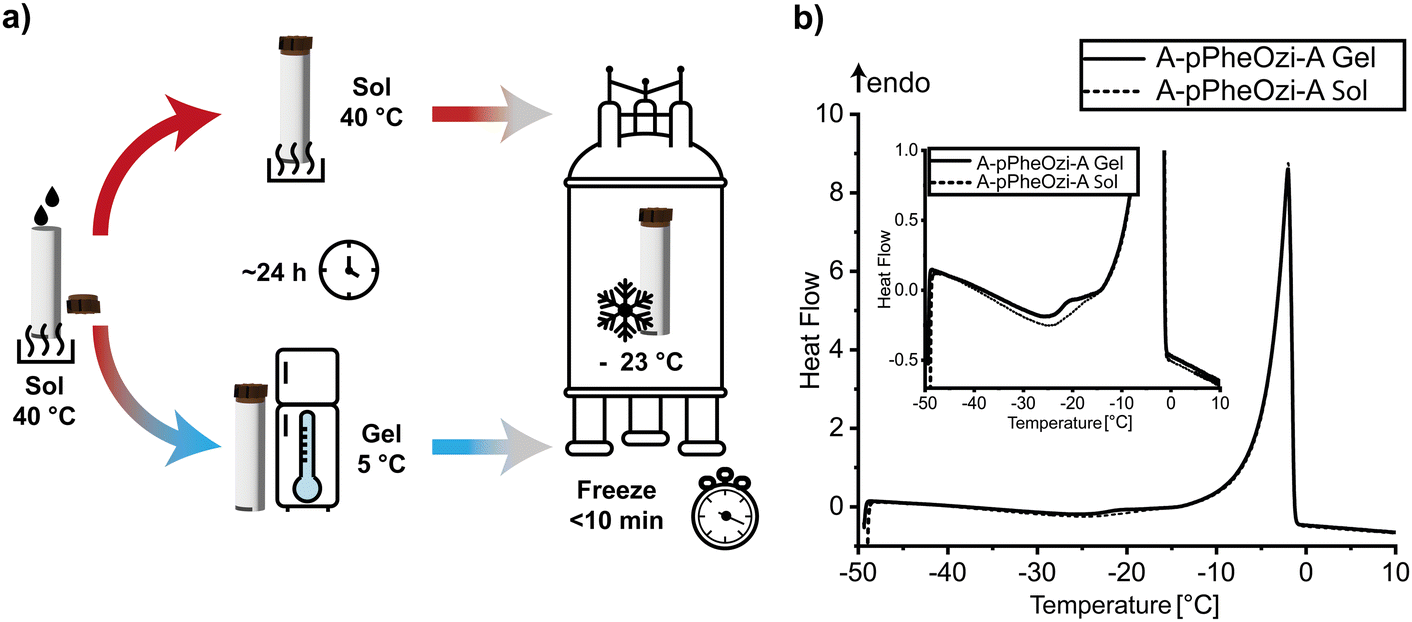 | ||
| Fig. 7 (a) Schematic representation of the freezing process of the aqueous polymer samples, where the clock symbolizes the hold of the temperature for 24 h and the stopwatch symbolizes the reduction of the temperature within 10 min. (b) DSC heating curve from −50 °C to 10 °C with a rate of 1 °C min−1 of 20 wt% aqueous solutions of A-pPheOzi-A, which were frozen with a rate of 20 °C min−1 starting from 5 °C (A-pPheOzi-A gel) or 40 °C (A-pPheOzi-A sol). | ||
Furthermore, DSC measurements were carried out to simulate and monitor the freezing process. It was confirmed that the freezable water of all samples was frozen at −23 °C (Fig. S10, ESI†). Additionally, according to literature, different types of water can be found in aqueous polymer samples. Strong polymer-water interactions result in non-freezable bound water, weakly interacting water is defined as freezable bound water, while bulk water does not interact with the polymer moieties at all.15,37 DSC measurements showed melting of freezable-bound water above −19 °C and melting of bulk water between −5 °C and 0 °C, in close agreement with literature.38 Interestingly, a difference in the amount of freezable-bound water was detected by DSC when A-pPheOzi-A was frozen from either its gel or sol state (inset, Fig. 7b). Although freezing takes a few minutes and the polymer sol is no longer in its equilibrium state of aggregation when the temperature falls below Tgel→sol, these results indicate that freezing of the different stages is generally possible even without special flash-freezing techniques. Moreover, gelation kinetics measured for A-pPheOzi-A by rheometry support that gelation occurs only after 20 minutes, which is significantly longer than the freezing process.9
As the NMR measurement temperature is kept below −19 °C, no melting of the freezable water moieties should have occurred. Nevertheless, a certain amount of water has not formed an immobile ice structure as reflected by a sharp water peak around 5.6 ppm in the 1H NMR spectrum (Fig. 8a). The water peak is shifted to higher ppm values due to the temperature dependent 1H shift.39 This mobile, unfrozen water most likely forms an aqueous layer around the polymer aggregates, preserving some polymer mobility and must refer to non-freezable bound water.24,40 Additional water environments such as weakly associated water were previously identified at smaller ppm values (1.7 ppm).41 Generally, a strong broadening of the 1H NMR peaks of the frozen polymer signals is observed, making the different chemical moieties almost indistinguishable. The effect of signal broadening upon freezing is already known especially for frozen protein samples. Although the reasons for the strong broadening are not fully understood, they could result from inhomogeneously frozen conformations.42 Investigations of the line widths of proteins in frozen aqueous solutions show that the protein moieties that are in close contact with water are particularly influenced by the freezing of the bulk water. In contrast, inner shielded protein moieties experience minimal signal broadening.43
 | ||
| Fig. 8 Solid-state NMR spectra of frozen 20 wt% aqueous samples of A-pPheOzi-A, PEG-pPheOzi-PEG, A-pMeOPheOzi-A and A-pMePheOzi-A. All samples were stored at 5 °C for at least 24 h before measurement except of the A-pPheOzi-A sol sample, which was stored at 35 °C, and subsequently frozen inside the NMR spectrometer by cooling the rotor down to −28 °C. All spectra were recorded at 14.1 T at −28 °C and scaled to matching peak intensities for best comparability. (a) 1H NMR spectra of frozen A-pPheOzi-A sol vs. gel. (c) 13C NMR spectra with 7–8 kHz MAS using DE and a short interscan delay of 2 s. A 13C DE NMR of an unfrozen A-pMeOPheOzi-A sample gel is shown in the dashed black box. | ||
Indeed, polymer signals observed with DE, which form the mobile, water-near corona, undergo pronounced signal broadening (comparison with the box in Fig. 8b). The freezing process has a particularly strong influence on the solvent-exposed corona but freezing and ice crystal growth are dependent on many different variables.44 The differences between the samples as detected by 1H NMR and 13C DE NMR measurements, should therefore not be overestimated due to the limited number of data points, but show potential for future in-depth studies.
In contrast, the rigid polymer moieties, which are detected with the 13C CP experiments (Fig. 9), should not be substantially altered by freezing and can therefore be discussed more straightforwardly. Indeed, less severe signal broadening due to freezing is observed for the CP spectra. In addition, carbonyl and phenyl carbon signals are clearly resolved for all frozen samples, now also including the A-pPheOzi-A sol and the non-gelling A-pMePheOzi-A sample (Fig. 9a). Isotropic tumbling of the micelles and, in general, intermediate motions in a range similar to the MAS frequency or the decoupling field interfere with the detection of the B-block moieties at 5 °C.21 In fact, previously published low-field NMR relaxation data confirm the existence of about 25% A-pPheOzi-A polymer moieties of intermediate mobility in the gel and sol state.11 By lowering the temperature and freezing the samples, the dynamics could be slowed down significantly, thereby allowing a direct comparison of the gel state with the sol state on a molecular level.
 | ||
| Fig. 9 (a) 13C solid-state NMR spectra with 7–8 kHz MAS using CP MAS with 1 ms contact time of 20 wt% aqueous samples of A-pPheOzi-A, PEG-pPheOzi-PEG, A-pMeOPheOzi-A and A-pMePheOzi-A. All samples were stored at 5 °C for at least 24 h before measurement except of the A-pPheOzi-A sol sample, which was stored at 35 °C, and subsequently frozen inside the NMR spectrometer by cooling the rotor down to −28 °C. All spectra were recorded at 14.1 T and at −28 °C and scaled to matching peak intensities for best comparability. (b) Overlay of the 13C aliphatic region (15–55 ppm) of A-pPheOzi-A samples measured in solution dissolved in CDCl3 or as 20 wt% sample in D2O measured in solution or in solid-state frozen and unfrozen. | ||
The 13C CP spectra showed considerable differences between A-pPheOzi-A sol and gel (Fig. 9b). These differences include lower signal intensities of the B-block and overall broader peaks for the sol sample. In addition, a new backbone signal at around 35–40 ppm appears only in the gel sample. It can be assumed that larger amounts of non-freezable water were retained within the core of the A-pPheOzi-A sol micelles. This results in enhanced mobility of the polymeric moieties in the core, thereby producing less distinct, though still observable signals for the phenyl and carbonyl groups. This suggestion is also supported by the increasing 1H NMR signal intensities (Fig. 5) for the B-block moieties at the gel–sol transition as measured by NMR in solution and reflected by the drastically decreasing p-ratios.
Unfortunately, this trend is not clearly represented in 13C T1 (Torchia) relaxation measurements performed for the frozen samples. The T1 values of the different chemical moieties are rather similar (Table S1, ESI†). It seems that the relaxation decay curves, which can easily be fitted by a monoexponential function (Fig. S25, ESI†) are showing an averaged mobility, so that changes of flexibility within the core are not reflected in clearly distinct T1 values. In general, the longitudinal relaxation is more sensitive towards high-frequency molecular motions in the range of the Lamour frequency and might not be sensitive for those changes in mobility occurring within the micellar core.45 To discuss the spectral differences in more detail, the areas of the carbonyl groups and the backbone signals are displayed separately below using the A-pPheOzi-A sample as an example.
Comparison of the backbone peaks
A key objective for recording and analyzing the 13C CP spectra of the various frozen polymer samples was to identify the additional backbone signal, which was not observable in the CP spectrum of the non-gelled and non-frozen samples. Interestingly, in the frozen samples the signal is strongly visible for the A-pPheOzi-A and PEG-pPheOzi-PEG hydrogels, less pronounced for the mechanically somewhat less-stable A-pMeOPheOzi-A gel and now also slightly visible for A-pMePheOzi-A. This peak was not found in the 13C CP MAS spectrum of the non-frozen, non-gelling A-pMePheOzi-A sample and could now only be resolved due to freezing. However, it is still completely invisible for A-pPheOzi-A (Fig. 9b) and A-pMeOPheOzi-A (Fig. S26, ESI†) in their frozen sol states. At this stage there are two possible interpretations for this: (i) there is a distinguishable chemical environment for certain backbone units due to gelation, with the formation of a less stable gel structure leading to a decrease in signal intensity. Alternatively, (ii) the higher residual intermediate mobility associated with less stable gel and sol samples could reduce the visibility of these signal components despite freezing the samples.Comparison of the carbonyl peaks
Due to the ABA-type of the investigated polymers and their tertiary amide motifs, different carbonyl signals for each polymer can be resolved. The carbonyl peak of the PEG-pPheOzi-PEG hydrogel closely matches the carbonyl peak of the A-pPheOzi-A hydrogel when considering the 13C CP spectrum in both their frozen (Fig. 10a) and unfrozen states (Fig. 6b). As only B-block carbonyl groups exist for the PEG-pPheOzi-PEG polymer, this shows that only B-block carbonyls are detected in the 13C CP spectra of the gel samples. No carbonyl group signals were visible in the 13C DE spectrum of the PEG-pPheOzi-PEG polymer (Fig. 6a), which further indicates that all carbonyl group signals measured in the 13C DE spectra of A-pPheOzi-A, A-pMePheOzi-A and A-pMeOPheOzi-A refer to their hydrophilic A-blocks. | ||
| Fig. 10 Overlay of the 13C NMR carbonyl region. B-Block carbonyl regions are labelled beige and A-block carbonyl regions are labelled light-blue. (a) 13C CP solid-state NMR spectra measured of 20 wt% samples in D2O of A-pPheOzi-A as gel and as sol and PEG-pPheOzi-PEG as gel. (b) 13C NMR spectra of A-pPheOzi-A samples measured in solution dissolved in CDCl3 or as 20 wt% sample in D2O measured in solution or by solid-state NMR. | ||
For comparison of B-block carbonyl functionalities aggregated within the rigid core in the sol and gel state, 13C CP measurements in the frozen state must be considered. No rigidified carbonyl peaks could be detected in the 13C CP spectrum for the A-pPheOzi-A sol in its unfrozen state (Fig. 10b). For the frozen A-pPheOzi-A gel a rather symmetric peak is observed in the 13C CP spectrum similar also to the PEG-pPheOzi-PEG gel (Fig. 10a), whereas several peak maxima causing a rather broad carbonyl peak region appear in the frozen A-pPheOzi-A sol spectrum. A reason for this could be that less water is expelled from the rigid core in the sol state, allowing for the detection of carbonyls with slightly varying chemical shifts. In their gel states the polymer assemblies seem to form densely packed and more ordered structures yet still contain water in the core. Conversely, the polymer assemblies in their sol states are less ordered and more loosely packed, allowing more water to enter the core and increasing the overall segmental polymer mobility (Scheme 1).
 | ||
| Scheme 1 Schematic representation of A-pMePheOzi-A and A-pMeOPheOzi-A assemblies in water with a focus on the core-forming, hydrophobic B-blocks and potential interaction sides with the core water. A-pMePheOzi-A forms a less ordered and looser core, which can simultaneously be more easily penetrated by water molecules. Conversely, the methoxy group of A-pMePheOzi-A promotes interaction with the core water, helping to form a more ordered and more densely packed core. The water molecules are depicted as light blue dots, the hydrophilic polymer A blocks by dark blue strands and the hydrophobic polymer B blocks by orange and brown strands. | ||
When measured in CDCl3, the intrinsic chemical shift of the different carbonyl groups can be determined without any distortions due to solvent interactions. However, in an aqueous solution carbonyl groups are capable of undergoing H-bonding with surrounding water molecules, which is usually reflected in a higher chemical shift value.46 Overall, all herein investigated polymers consistently show a shift of approx. 1-2 ppm to higher values for the B-block carbonyl groups (13C CP peak) and a shift of approx. 4 ppm for the A-block carbonyl groups (13C DE peak) in the gel state. This also applies to the non-gelling A-pMePheOzi-A polymer. This indicates the presence of H-bonding also to the core forming B-block carbonyl groups in both sol and gel states. This again points at the existence of water in the core of the aggregates. Core water, which is inevitably in close contact with the polymeric moieties, is most likely to form non-freezing bound water, confirming DSC and NMR measurements. However, the increased mobility of the polymer blocks in the core of the sol state as shown by the solid-state NMR measurements, together with the changing amounts of water species as shown by the DSC measurements, suggest that more water can be found in the core of sol state aggregates than in the core of gel state aggregates. However, the chemical shift of the carbonyl groups of the B-block barely changes in the sol–gel comparison. Similarly, no significant shift of the carbonyl band was observed for the carbonyl shift measured by FT-IR of the 20 wt% polymer solution in D2O measured at different temperatures (Fig. S28, ESI†).47 Therefore, differences in H-bonding to the carbonyl groups do not seem to be the underlying cause of gelation or worm-formation upon gelation.
Further hydrogen bonding of core water to the additional methoxy groups of A-pMeOPheOzi-A would promote the formation of a more rigid, immobilized core, resulting in prolonged kinetic stability of the underlying hydrogel structures. Conversely, the introduction of an additional but non-interacting methyl group of A-pMePheOzi-A disrupts the packing of the core moieties to such an extent that gelation no longer occurs. A schematic of these key interactions responsible for the aggregation of A-pMeOPheOzi-A and A-pMePheOzi-A is shown in Scheme 1. Previously published findings from the investigation of the gelation mechanism of A-pPheOzi-A and other A-block homologues point to non-classical interactions as the cause of the unusual gelation upon cooling accompanied by formation of worm-like aggregates.11 Therefore, it might be assumed that these interactions play a crucial role for gelation of the structurally very similar A-pMeOPheOzi-A polymer, as well.
Guest-loaded hydrogels
In a final step, the hydrogels were tested for their capacity to incorporate hydrophobic guest molecules into their network structure. The natural product curcumin (Cur) serves as a hydrophobic model compound. Loading capacities were determined for the unsubstituted A-pPheOzi-A hydrogel. The samples were prepared by utilizing the thin-film-method as described in the ESI.† Cur-loadings are given as Cur/polymer weight ratio. The maximum loading capacity for the A-pPheOzi-A polymer was found to be ≈70 wt% Cur with respect to the polymer mass (Fig. 11) and gelation was maintained up to a maximum of 8 wt% Cur-loading according to the tube inversion test. Further increase of Cur-loading yielded a Cur-loaded polymer sol. A temperature dependent gel–sol transition at around 35 °C identical to the unloaded A-pPheOzi-A polymer was observed. The sol forming Cur-loaded samples, did not show any sol–gel transition according to the DSC (Fig. S30, ESI†).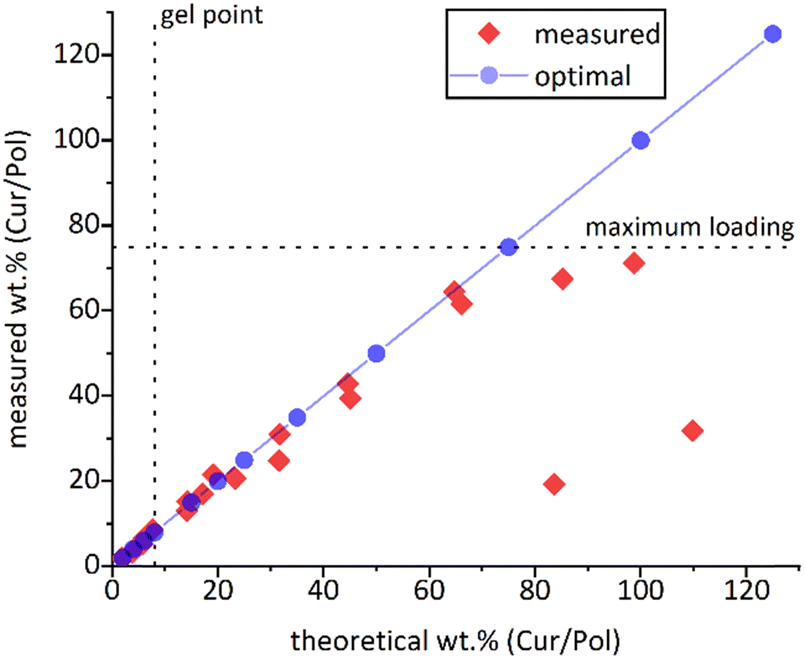 | ||
| Fig. 11 Prepared Cur-loaded A-pPheOzi-A formulations for screening the maximum Cur-loading and the maximum Cur-loading that still allows gelation of A-pPheOzi-A indicated as gel point. Theoretical loading refers to the Cur-loading obtained from the weight of Cur used and the measured loading refers to the actual Cur-loading as detected by UV-vis measurements. | ||
13C solid-state NMR experiments of a 1 wt% Cur-loaded A-pPheOzi-A sample, performed in its frozen aqueous state, showed highly comparable spectra to the unloaded hydrogel (Fig. S31, ESI†). Further structural investigations would be required for an in-depth assessment of the influence of Cur-loading on the polymer self-assembly.
To assess the potential of the hydrogels to serve as drug-delivery system for active pharmaceutical ingredients (APIs), four hydrophobic, water-insoluble APIs - felodipine, efavirenz, danazol, and dolutegravir – were also loaded onto A-pPheOzi-A aiming for a guest molecule loading of 6 wt%. Only felodipine and efavirenz achieved a 6 wt% loading with gel formation being maintained. Precipitation of dolutegravir and danazol was observed, resulting in a maximum loading of only 2.1 wt% and 1.4 wt%, respectively. Although more detailed investigations of these guest-loaded hydrogels are required in the future, these experiments showcase the potential of the hydrogels to serve as matrix for the incorporation of drug molecules into the network structure.
Conclusions
Two novel polymers were obtained by modifying the para-position of the phenyl group of the pPheOzi B-block. Although both polymers differ by only a methyl or methoxy group compared to A-pPheOzi-A, these groups appear to be highly influential on polymer aggregation as shown by rheology. Considering μDSC and AFM, A-pMePheOzi-A only forms a highly viscous aqueous solution consisting of spherical micelles. Conversely, A-pMeOPheOzi-A, similar to pPheOzi-based triblocks, does form worm-like micelles upon cooling accompanied by gelation. However, a certain temperature or energy barrier must first be exceeded to induce reorganization of the polymer strands into a stable gel structure.Due to the broad timescale of molecular mobilities in polymer aggregates, individual NMR methods can only visualize specific mobility regimes. Thus, NMR spectroscopy in solution is most suitable for characterizing the subset of mobile polymer regions, which is, in the herein investigated polymer aggregates, limited to the hydrophilic corona. Nevertheless, tracking the loss of signal intensity of certain polymer moieties upon thermogelation is still valuable. The chemically distinguishable A- and B-blocks of PEG-pPheOzi-PEG clearly demonstrated a collective rigidification of the entire B-block upon worm-formation and thermogelation, whereas the hydrophilic corona seems less affected. Accordingly, it seems unsurprising that even small chemical changes within the hydrophobic B-block already show enormous effects on aggregation. Due to the methoxy group of A-pMeOPheOzi-A a hysteresis delays the reorganization to the worm-like aggregates and gelation, while at the same time the thermal stability of the worms is drastically increased.
In turn, rigid structures can be visualized using solid-state NMR spectroscopy. Yet it has a “blind spot” in the region of intermediate mobilities and isotropic tumbling like micellar rotations. Here, it was possible to considerably increase the signal intensity in solid-state NMR experiments by freezing the polymer solutions. Combining these solid-state NMR measurements with DSC provided key insights into the different types of water within the samples, namely non-freezable bound water, freezable-bound water, and free water. Additionally, by freezing the polymer samples the chemical environments of the polymer sols could be successfully analyzed. Notably, a new backbone signal appeared in the gel samples only and is barely visible in the sol samples. Most likely it represents a specific backbone configuration that only appears visible upon gelation. Furthermore, significant shifts in both A- and B-block carbonyl moieties were observed, likely due to hydrogen bonding, strongly indicating the presence of water within the core of the aggregates. Core water, which is inevitably in close contact with polymer moieties, is most likely forming non-freezing bound water. Interestingly, 13C CP spectra of the sol samples exhibited distinct carbonyl peaks only in their frozen state, where multiple peak maxima resulted in a broad carbonyl peak region. In contrast, the frozen gel samples exhibit more singlet-like carbonyl peaks. Both observations support the assumption that less water is expelled from the core of the sol samples, likely contributing to the overall higher residual mobility and structural disorder.
Finally, it can be postulated that the incorporation of an additional methoxy unit within the hydrophobic B-block enhances the interaction with the core water accounting for the prolonged kinetic stability of the resulting aggregates. Conversely, the introduction of an additional, but non-interacting, methyl group disrupts the aggregation behavior to such an extent that gelation no longer occurs.
Using the NMR-based methods presented here to study both polymer sol and gel samples, it has been possible to gain further insight into the complex aggregation behavior of pPheOzi-based triblock copolymer systems. This analytical approach is generally transferable to other hydrogel systems independent of their specific chemical nature. The only requirement for separate gel- and sol-state analysis through NMR in frozen samples is that the gel formation is slower than the freezing process. The structural features and interactions identified for the studied poly(2-oxazoline) polymers are of relevance for chemically similar entities such as other tertiary amides or carbonyl moieties in the absence of hydrogen bond donating functional groups in the polymer. Knowledge of the importance of water, even within the core of aggregates, and understanding polymer-water interactions is a valuable foundation to further investigate the influence of water on the previously proposed sol–gel transition mechanism of A-pPheOzi-A. Small angle neutron scattering (SANS) and saturation-transfer difference (STD) NMR measurements are promising tools to refine the role of water in the sol–gel transition mechanism.48 In addition, based on the acquired understanding of polymer aggregation, the complexity of the overall system can now be increased e.g. by adding a drug molecule. Here, we could successfully prove the incorporation of five different hydrophobic molecules, one natural product and four APIs into the hydrogel network structure. Depending on the drug molecule, differences in the achievable drug-loading were observed. While more detailed investigations addressing pharmaceutically relevant parameters as well as structural feature are needed, the hydrogels show promise as drug depot. The systematic addition of drug molecules could potentially influence the aggregation due to polymer–drug interactions either disrupting key interactions for gel formation or acting as an additional crosslinker. The complementary approach of freezing the gel or sol states as used in this work presents a versatile tool to better understand the weakening or strengthening of the resulting gels through advanced NMR-based investigations.
Author contributions
T. Z. was responsible for project administration, conceptualization, investigation and writing of the original draft, S. B. provided the methodologies and performed investigations, L. P. and J. G. performed investigations. R. L. reviewed and edited the manuscript, A.-C. P. funded and supervised the project including reviewing & editing of the manuscript.Data availability
Raw experimental data including from NMR in the solid-state and in solution, rheology and DSC is available through WueData, the research data repository of the Julius-Maximilians-Universität Würzburg: DOI: https://doi.org/10.58160/5x53u6xm38ps4bau.Conflicts of interest
There are no conflicts to declare.Acknowledgements
This work was financially supported by the Keck-Köppe-Förderstiftung, project AZ 23-24. We thank Prof. Kay Saalwächter for helpful discussions and Anna-Lena Ziegler for providing the PEG-pPheOzi-PEG sample. Dr Vladimir Stepanenko and Prof. Frank Würthner are kindly acknowledged for collection and discussion of AFM data. Electron microscopy data were kindly measured by Christian Kraft and Prof. Bettina Böttcher at the cryo-EM facility in Würzburg (DFG Equipment Grant INST 93/903-1FUGG).References
- D. Roy, W. L. A. Brooks and B. S. Sumerlin, Chem. Soc. Rev., 2013, 42, 7214–7243 RSC.
- A. P. Constantinou, V. Nele, J. J. Doutch, T. A. Shmool, S. Wang, Q. Li, J. P. Hallett, C. A. Dreiss, M. M. Stevens and T. K. Georgiou, Polymer, 2024, 302, 127075 CrossRef CAS.
- V. Nele, J. P. Wojciechowski, J. P. K. Armstrong and M. M. Stevens, Adv. Funct. Mater., 2020, 30, 2002759 CrossRef CAS.
- (a) J. Seuring and S. Agarwal, Macromol. Rapid Commun., 2012, 33, 1898–1920 CrossRef CAS PubMed; (b) W. Fu, C. Luo, E. A. Morin, W. He, Z. Li and B. Zhao, ACS Macro Lett., 2017, 6, 127–133 CrossRef CAS PubMed.
- A. P. Constantinou and T. K. Georgiou, Eur. Polym. J., 2016, 78, 366–375 CrossRef CAS.
- (a) B. D. Monnery and R. Hoogenboom, Polym. Chem., 2019, 10, 3480–3487 RSC; (b) M. S. Haider, T. Ahmad, M. Yang, C. Hu, L. Hahn, P. Stahlhut, J. Groll and R. Luxenhofer, Gels, 2021, 7, 78 CrossRef CAS.
- V. J. Cunningham, L. P. D. Ratcliffe, A. Blanazs, N. J. Warren, A. J. Smith, O. O. Mykhaylyk and S. P. Armes, Polym. Chem., 2014, 5, 6307–6317 RSC.
- A.-L. Ziegler, A. Kerr, F. T. Kaps and R. Luxenhofer, ChemRxiv, 2024 DOI:10.26434/chemrxiv-2024-75cb8, This content is a preprint and has not been peer-reviewed.
- L. Hahn, M. Maier, P. Stahlhut, M. Beudert, V. Flegler, S. Forster, A. Altmann, F. Töppke, K. Fischer, S. Seiffert, B. Böttcher, T. Lühmann and R. Luxenhofer, ACS Appl. Mater. Interfaces, 2020, 12, 12445–12456 CrossRef CAS.
- L. Hahn, E. Karakaya, T. Zorn, B. Sochor, M. Maier, P. Stahlhut, S. Forster, K. Fischer, S. Seiffert, A.-C. Pöppler, R. Detsch and R. Luxenhofer, Biomacromolecules, 2021, 22, 3017–3027 CrossRef CAS PubMed.
- L. Hahn, T. Zorn, J. Kehrein, T. Kielholz, A.-L. Ziegler, S. Forster, B. Sochor, E. S. Lisitsyna, N. A. Durandin, T. Laaksonen, V. Aseyev, C. Sotriffer, K. Saalwächter, M. Windbergs, A.-C. Pöppler and R. Luxenhofer, ACS Nano, 2023, 17, 6932–6942 CrossRef CAS.
- L. Hahn, L. Keßler, L. Polzin, L. Fritze, S. Forster, H. Helten and R. Luxenhofer, Macromol. Chem. Phys., 2021, 222, 2100114 CrossRef CAS.
- (a) D. E. Demco and A. Pich, Macromol. Chem. Phys., 2023, 224, 2200410 CrossRef CAS; (b) A. M. Mathur and A. B. Scranton, Biomaterials, 1996, 17, 547–557 CrossRef CAS PubMed; (c) Y. E. Shapiro, Prog. Polym. Sci., 2011, 36, 1184–1253 CrossRef CAS; (d) M. El Hariri El Nokab and P. C. A. van der Wel, Carbohydr. Polym., 2020, 240, 116276 CrossRef CAS PubMed.
- J. Spěváček, Curr. Opin. Colloid Interface Sci., 2009, 14, 184–191 CrossRef.
- V. M. Gun’ko, I. N. Savina and S. V. Mikhalovsky, Gels, 2017, 3, 37 CrossRef.
- (a) L. Etchenausia, E. Deniau, A. Brûlet, J. Forcada and M. Save, Macromolecules, 2018, 51, 2551–2563 CrossRef CAS; (b) F. Lenzi, A. Sannino, A. Borriello, F. Porro, D. Capitani and G. Mensitieri, Polymer, 2003, 44, 1577–1588 CrossRef CAS.
- K. Saalwächter, W. Chassé and J.-U. Sommer, Soft Matter, 2013, 9, 6943–6954 RSC.
- D. Topgaard, Pure Appl. Chem., 2023, 95, 1075–1089 CrossRef CAS.
- M. Concistrè, E. Carignani, S. Borsacchi, O. G. Johannessen, B. Mennucci, Y. Yang, M. Geppi and M. H. Levitt, J. Phys. Chem. Lett., 2014, 5, 512–516 CrossRef.
- Y. Miwa, H. Ishida, H. Saitô, M. Tanaka and A. Mochizuki, Polymer, 2009, 50, 6091–6099 CrossRef CAS.
- H. Saitô, A. Kira, T. Arakawa, M. Tanio, S. Tuzi and A. Naito, Biochim. Biophys. Acta, Biomembr., 2010, 1798, 167–176 CrossRef.
- (a) M. J. Bayro, G. T. Debelouchina, M. T. Eddy, N. R. Birkett, C. E. MacPhee, M. Rosay, W. E. Maas, C. M. Dobson and R. G. Griffin, J. Am. Chem. Soc., 2011, 133, 13967–13974 CrossRef CAS PubMed; (b) E. Carignani, S. Borsacchi and M. Geppi, J. Phys. Chem. A, 2011, 115, 8783–8790 CrossRef CAS.
- R. Tycko, Acc. Chem. Res., 2013, 46, 1923–1932 CrossRef CAS PubMed.
- T. Bauer, J. Gath, A. Hunkeler, M. Ernst, A. Böckmann and B. H. Meier, J. Biomol. NMR, 2017, 67, 15–22 CrossRef CAS.
- R. Graf, M. R. Hansen, D. Hinderberger, K. Muennemann and H. W. Spiess, Phys. Chem. Chem. Phys., 2014, 16, 9700–9712 RSC.
- N. Dwivedi, B. Patra, F. Mentink-Vigier, S. Wi and N. Sinha, J. Am. Chem. Soc., 2024, 146, 23663–23668 CrossRef CAS.
- J. Viger-Gravel, P. Berruyer, D. Gajan, J.-M. Basset, A. Lesage, P. Tordo, O. Ouari and L. Emsley, Angew. Chem., Int. Ed., 2017, 56, 8726–8730 CrossRef CAS PubMed.
- I. J. Colquhoun, R. Parker, S. G. Ring, L. Sun and H. R. Tang, Carbohydr. Polym., 1995, 27, 255–259 CrossRef CAS.
- H. Witte and W. Seeliger, Justus Liebigs Ann. Chem., 1974, 1974, 996–1009 CrossRef.
- J. Kim, M. M. Mok, R. W. Sandoval, D. J. Woo and J. M. Torkelson, Macromolecules, 2006, 39, 6152–6160 CrossRef CAS.
- S. J. Hunter and S. P. Armes, J. Colloid Interface Sci., 2023, 634, 906–920 CrossRef CAS.
- (a) R. Konefał, J. Spěváček and P. Černoch, Eur. Polym. J., 2018, 100, 241–252 CrossRef; (b) I. Krakovský, L. Hanyková and J. Štastná, J. Therm. Anal. Calorim., 2024 DOI:10.1007/s10973-024-13380-5.
- (a) J. Seuring and S. Agarwal, Macromolecules, 2012, 45, 3910–3918 CrossRef CAS; (b) J. Seuring, F. M. Bayer, K. Huber and S. Agarwal, Macromolecules, 2012, 45, 374–384 CrossRef CAS.
- I. Matlahov and P. C. A. van der Wel, Methods, 2018, 148, 123–135 CrossRef CAS PubMed.
- K. Aebischer and M. Ernst, J. Magn. Reson., 2024, 359, 107617 CrossRef CAS PubMed.
- S. Scheidel, E. Behr and A.-C. Pöppler, unpublished work.
- I. N. Savina, V. M. Gun'ko, V. V. Turov, M. Dainiak, G. J. Phillips, I. Y. Galaev and S. V. Mikhalovsky, Soft Matter, 2011, 7, 4276–4283 RSC.
- (a) M. Pastorczak, G. Dominguez-Espinosa, L. Okrasa, M. Pyda, M. Kozanecki, S. Kadlubowski, J. M. Rosiak and J. Ulanski, Colloid Polym. Sci., 2014, 292, 1775–1784 CrossRef CAS PubMed; (b) G. K. Rennie and J. Clifford, J. Chem. Soc., Faraday Trans. 1, 1977, 73, 680–689 RSC.
- Y. Ishihara, A. Calderon, H. Watanabe, K. Okamoto, Y. Suzuki, K. Kuroda and Y. Suzuki, Magn. Reson. Med., 1995, 34, 814–823 CrossRef CAS.
- Y. Du and Y. Su, J. Pharm. Sci., 2024, 113, 2405–2412 CrossRef CAS PubMed.
- V. V. Turov, V. M. Gun’ko, V. I. Zarko, R. Leboda, M. Jablonski, M. Gorzelak and E. Jagiello-Wojtowicz, Colloids Surf., B, 2006, 48, 167–175 CrossRef CAS PubMed.
- (a) I. V. Sergeyev, K. Fritzsching, R. Rogawski and A. McDermott, Protein Sci., 2024, 33, e4803 Search PubMed; (b) A. H. Linden, W. T. Franks, Ü. Akbey, S. Lange, B.-J. van Rossum and H. Oschkinat, J. Biomol. NMR, 2011, 51, 283–292 CrossRef CAS PubMed.
- T. Bauer, C. Dotta, L. Balacescu, J. Gath, A. Hunkeler, A. Böckmann and B. H. Meier, J. Biomol. NMR, 2017, 67, 51–61 CrossRef CAS PubMed.
- J. Liu, Pharm. Dev. Technol., 2006, 11, 3–28 CrossRef CAS PubMed.
- J. Höpfner, G. Guthausen, K. Saalwächter and M. Wilhelm, Macromolecules, 2014, 47, 4251–4265 CrossRef.
- (a) N. Asakawa, S. Kuroki, H. Kurosu, I. Ando, A. Shoji and T. Ozaki, J. Am. Chem. Soc., 1992, 114, 3261–3265 CrossRef CAS; (b) S. Jena, C. Routray, J. Dutta and H. S. Biswal, Angew. Chem., Int. Ed., 2022, 61, e202207521 CrossRef CAS; (c) A. Johansson, P. Kollman, S. Rothenberg and J. McKelvey, J. Am. Chem. Soc., 1974, 96, 3794–3800 CrossRef CAS.
- A. Kroning, A. Furchner, S. Adam, P. Uhlmann and K. Hinrichs, Biointerphases, 2016, 11(1), 019005 CrossRef PubMed.
- (a) B. Sochor, Ö. Düdükcü, M. M. Lübtow, B. Schummer, S. Jaksch and R. Luxenhofer, Langmuir, 2020, 36, 3494–3503 CrossRef CAS PubMed; (b) V. Gabrielli, A. Kuraite, M. A. da Silva, K. J. Edler, J. Angulo, R. Nepravishta, J. C. Muñoz–García and Y. Z. Khimyak, J. Colloid Interface Sci., 2021, 594, 217–227 CrossRef CAS.
Footnote |
| † Electronic supplementary information (ESI) available. See DOI: https://doi.org/10.1039/d5tb00005j |
| This journal is © The Royal Society of Chemistry 2025 |