A microfluidic chip for electrochemical conversions in drug metabolism studies
M.
Odijk
*a,
A.
Baumann
b,
W.
Lohmann
b,
F. T. G.
van den Brink
a,
W.
Olthuis
a,
U.
Karst
b and
A.
van den Berg
a
aBIOS - the Lab-on-a-Chip group, MESA+ Institute of Nanotechnology, University of Twente, P.O. box 217, 7500 AE, Enschede, The Netherlands. E-mail: m.odijk@utwente.nl
bUniversity of Münster, Institute of Inorganic and Analytical Chemistry, Corrensstraße 30, D-48149, Münster, Germany. E-mail: anne.baumann@uni-muenster.de
First published on 23rd March 2009
Abstract
We have designed a microfluidic microreactor chip for electrochemical conversion of analytes, containing a palladium reference electrode and platinum working and counter electrodes. The counter electrode is placed in a separate side-channel on chip to prevent unwanted side-products appearing in the measured spectrograms. Using this chip, cyclic voltammograms are measured in volumes of 9.6 nL. Furthermore the conversion efficiency of ferricyanide is characterized using UV/vis-spectroscopy. We have obtained an on-line conversion of 97% using a flow rate of 1 µL/min. We have used the microreactor chip to study the electrochemical metabolism pathway of amodiaquine using electrochemistry (EC)-liquid chromatography (LC)-mass spectrometry (MS). We have compared our results with measurements obtained with commercially available electrochemical flow-through cells. Using our chip it was possible to obtain similar results. Therefore, we have fabricated an electrochemical cell on-chip which is used successfully in EC-UV/vis and EC-LC-MS experiments.
Introduction
Electrochemisty (EC) is well-known in analytical chemistry as a useful addition to techniques like liquid chromatography (LC) and mass spectrometry (MS). In traditional LC-MS experiments, EC can be used to convert non-polar species to more polar reaction products and thus significantly increase the ionization efficiency in electrospray sources.1–4 This can be performed by integrating EC into the electrospray interface, but also inside a separate on-line flow cell which is placed directly in front of the interface. The latter gives the advantage of superior control of the reaction conditions, and allows a higher conversion of the electrochemically active species.5Further examples of the coupling of EC to MS and/or LC can be found in a variety of studies in biomedical and also environmental analysis. In these studies the electrochemical cell is used successfully for mimicking oxidative reactions in drug metabolism studies.4,6 These reactions are catalysed in the organism by enzymes of the cytochrome P450 family. Bruins et al.7 mimicked the oxidations using a commercially available coulometric flow-through cell from ESA Bioscience Inc. (Chelmsford, MA). Also, using the same cell in an EC-LC-thermospray-MS system, the enzymatic and electrochemical oxidation pathways of uric acid are compared.8
Furthermore, Karst et al. used the ESA cell to study the electrochemical metabolism pathway of clozapine, an antipsychotic drug,9 and amodiaquine, a known antimalarial agent.10 Another interesting application of EC-MS is the tyrosine specific protein cleavage reported by Permentier et al.11
The coulometric cells from ESA contain a three-electrode set-up including a reference electrode of the α-hydrogen/palladium type. The potential of this pseudo-reference electrode is only stable under certain conditions like a known, constant pH.12 Other disadvantages are the relatively large volume and that it can not be disassembled for maintenance or electrode replacement. Besides the flow-through cell, different types of wall-jet cells are commercially available.
Other companies that produce electrochemical cells are BioAnalytical Systems and Antec Leyden.13 Their cells are based on the thin-layer flow concept. Those cells require lower flow rates for an efficient conversion, but bear the advantage of various replaceable and interchangeable electrode materials.
Besides the already mentioned commercially available cells, various papers are published in which home-made flow-through cells are combined with mass spectrometry.14,15 Back in 1971, Bruckenstein et al.16 already coupled a porous glassy carbon electrode with a MS to study the gaseous reaction products NO and N2O of the reduction of NO2−.
Hambitzer and Heitbaum17 were the first in 1986 to construct a two-electrode thin-layer flow cell to connect with a MS to study the oxidation of N,N-dimethylaniline. They employed a glass frit to avoid mixing of electrolyte between counter and working electrode compartments. The reference electrode was placed in a separate flask, connected to the flow cellvia a luggin capillary.
Cole et al. minimized the time between the electrochemical conversion of species and detection in the MS, to detect short-living radicals using a home-made, low-volume, three-electrode flow-cell.18,19 They made a cell in a coaxial-like configuration, consisting of an inner platinum core partly covered with a fused-silica layer which is positioned inside an auxiliary outer electrode. The latter electrode was also acting as spray needle.
In the configurations discussed so far, EC is used as conversion tool for subsequent detection in MS. However, EC can also be used as detector for various compounds like ammonia, lactate, glucose, dopamine and glutamate.20–23
Our goal is to develop an electrochemical cell in a lab-on-chip, specifically aimed towards high electrochemical conversions for (on-line) use with mass spectrometry in drugs screening. Also, an extra sensing electrode is placed after the conversion area to detect generated species.
We have developed a microfluidic chip with a fast and high conversion rate of the introduced species. This chip, with a main channel volume of only 9.6 nL, is fabricated out of glass for its inert nature. A three electrode set-up is integrated into the chip. The chip contains a palladium pseudo-reference electrode and platinum working and counter electrodes. The counter electrode is placed in a separate side-channel on the chip to prevent unwanted side-products to appear in the measured spectra.
Cyclic voltammograms were recorded to characterize the EC cell. As two test cases, EC-UV/vis measurements on the conversion of ferricyanide and EC-LC-MS measurements on the oxidative metabolism of amodiaquine, are included to illustrate the performance of our cell in practical applications.
Compared to the commercially available cells, our chip is particularly useful in cases where only limited sample volumes are available. In addition, it is possible to use the extra sensing electrode present on the chip to perform immediate electrochemical detection after conversion. Also, future integration of this design together with liquid chromatography on chip24 is possible.
Theory and design considerations
For drug screening it is important to obtain total conversion of the inserted chemical species of interest. Factors that influence the conversion efficiency are, among others, the dimensions of the cell and the volumetric flow velocity. From a microfabrication point of view, the most easy way to incorporate electrodes into a small cell is to place these electrodes at the bottom. A schematical overview of such a cell is given in figure 1.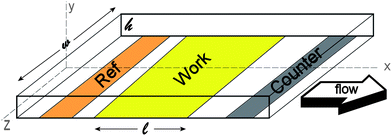 | ||
| Fig. 1 Typical thin-layer flow cell with electrodes placed at the bottom of the channel. | ||
It is assumed that the length (l) of the working electrode is much larger than the width (w), which is in turn much larger than the height of the channel (h). Furthermore the flow is assumed to be laminar and the fluids are incompressible. Under these assumptions the velocity flow profile in x-direction of the channel can be described by the following expression25
 | (1) |
We assume this flow to be valid for every value of z inside the channel. By doing so, we make a small error at the vertical walls perpendicular to the plane of the working electrode. Since we assume the width of the channel to be much larger than the height, this error is negligible. The volumetric flow velocity is equal to the integral of the flow velocity, multiplied by the channel width:
 | (2) |
In a worst-case scenario, the minimum residence time of an ion inside the channel above the working electrode is equal to:
 | (3) |
Of course, the actual residence time will be longer on average. Since our goal is to obtain total conversion, a larger residence time inside the channel is beneficial for the conversion rate.
In order to obtain a good conversion efficiency, the height (h) of the channel must be smaller or equal to the diffusion length of ions in the y-direction (ydiff) within the residence time. The following expression describes the relation between the diffusion length and the residence time and the consequences for the allowed channel height26
 | (4) |
The hydraulic channel resistance of a rectangular shaped channel is equal to25
 | (5) |
Note that the parameter length (l) in equation 5 is only the length of the channel containing the working electrode. Therefore the pressure (P) describes only the pressure drop over that part of the channel. The same remark is valid for the hydraulic resistance.
Finally, a result for the pressure difference (P) over the part of the channel containing the working electrode is obtained as a function of the viscosity (η), h, l, w and Q if equation 1–5 are combined:
 | (6) |
To prevent problems with fluidic interconnects, we limit the pressure drop over the part of the channel containing the working electrode to 1 × 10⁵ Pa (1 bar). To obtain a good interface with the surrounding equipment the volumetric flow velocity is aimed to be 1 µl/min. Also, the diffusion constant of the protein inside the channel is assumed to be 4 × 10⁻¹¹ m2/s and the viscosity of the solvent is equal to the viscosity of water at room temperature (8.9 × 10⁻⁴ Pa s). Using equation 1–6, it is now possible to calculate the channel length containing the working electrode and the channel height as a function of the channel width.
The results are shown in figure 2. From figure 2a it can be seen that the channel length is decreasing for larger channel widths. Also from figure 2b it can be seen that the channel height is decreasing for larger channel widths. We can explain this by the time the ion needs to diffuse towards the working electrode, which is increasing for larger channel heights. To compensate for this effect the channel length needs to be enlarged to increase the residence time of the ions inside the channel.
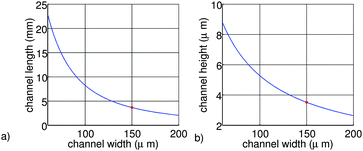 | ||
| Fig. 2 Channel length (a) and height (b) as a function of the channel width, using equations 1–6 and P = 1 × 10⁵ Pa, η = 8.9 × 10⁴ Pa s, Q = 1 × 10⁻⁶ L/min, D = 4 × 10⁻¹¹ m2/s. | ||
The final dimensions of the main channel of the chip are 4 µm by 150 µm by 16 mm (h, w, l). The selected length is four times larger than the values calculated in this section, to realize a conservative design in terms of good conversion efficiency. Therefore, the cell can handle even slower diffusing species. As a result, the total pressure over the main channel is around ∼5 × 10⁵ Pa (5 bar), which is still low enough to prevent problems with the fluidic interconnects. Two different designs have been made; one design with the working electrode placed over the entire bottom surface of this channel and one design with the working electrode placed over 75% of the bottom channel surface.
Experimental
Chip design and fabrication
A schematic overview of the different components of the chip, along with the final result is shown in figure 3.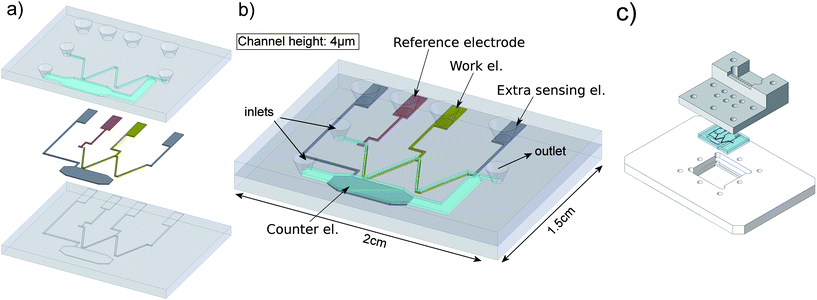 | ||
| Fig. 3 Overview of the fabricated chip. a) Bottom layer with recess etched wells for the electrodes and top wafer with inlets and fluidic channels. b) Assembled view of the total chip (1.5 by 2 cm) and the different electrodes and inlets indicated. c) Chip and chipholder. | ||
This chip is fabricated out of two glass (Pyrex™) wafers. On the bottom wafer photoresist is patterned using standard lithography. Wells for the first electrode are etched (150 nm deep) using buffered HF (BHF). Next, a palladium electrode is sputtered and patterned by lift-off. The general electrode layer thickness is 140 nm. For the platinum electrodes, the photolithography – BHF etch – sputtering – lift-off cycle, is repeated. In total four electrodes are present on the chip: one pseudo reference electrode made of palladium, and three platinum electrodes used as working, counter and extra sensing electrode. The counter electrode is placed in a separate side-channel to prevent unwanted reaction products to appear into the measured signal.
On the backside of the top wafer, first a chromium/gold layer is applied and patterned by lithography and a wet gold/chromium etch. This gold layer is acting as mask for the fluidic channels, which are wet etched using BHF into the backside of the top wafer.
Fluidic inlets and outlets, along with access holes for the electrode pads are powderblasted into the top wafer from the top side. As a last step, the two wafers are bonded together using a press (Carver Inc, model 4386, applied pressure 12.7 MPa) and an annealing treatment of 450 °C for 1 hour.
During experiments the chip is placed inside an in-house developed chip holder to provide easy interconnects to the chip (see figure 3c). Fluidic connections are provided by nanoport nuts (Upchurch Scientific). Electric contacts to the chip are made using spring metal contact probes (ISI Interconnect Specialities Inc.).
Cyclic voltammetry and conversion efficiency study
The set-up used for the cyclic voltammetry measurements and the conversion efficiency study is shown in figure 4. A syringe pump (Harvard Apparatus, PHD 22/2000) is connected through fused glass capillary (100 µm inner diam.) to a switchable valve (Upchurch Scientific, V-1241-DC). This valve is connected to the inlets of the chip and bottles containing the sample solution, demineralized water and a waste container. Electrochemical measurements are recorded using a bipotentiostat (Bio-Logic SAS, type BiStat).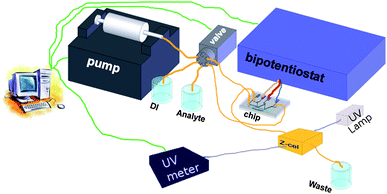 | ||
| Fig. 4 Setup used in the cyclic voltammetry and conversion efficiency measurements. | ||
For the UV/vis measurements the outlet of the chip is connected to a z-cell with an optical pathlength of 5 mm and internal volume of approx. 1 µL (Zeutec Opto-Elektronic GmbH, Micro flow cell). Inside this z-cell UV/vis adsorbance measurements are recorded using a deuterium light source (Ocean Optics, DT-MINI-2-GS Mikropack) and an UV/vis spectrometer (Ocean Optics, HR4000). The fluidic and electrochemical part of the set-up is controlled by a Labview application. UV/vis measurements are recorded using software from Ocean Optics.
In general, the set-up is operated using the following protocol. First the whole set-up including the chip is rinsed with 100 µL of DI water. Next, the sample solution is infused into the side channel of the chip. After five minutes, the flow is switched to the main channel. Again after five minutes, the electrochemical measurements are started.
For the cyclic voltammetry measurements, the potential is varied between −0.4 and 0.4 V with a scan rate of 20 mV/s. For the conversion efficiency study a constant potential of −0.5 V or 0.5 V is applied for several minutes until the measured spectrogram was stable. All potentials given in this paper are defined vs. the palladium pseudo-reference electrode with the pH in all measurements held constant at 7.
Amodiaquine study
In 2007, Lohmann and Karst published a paper describing the electrochemical generation and identification of reactive metabolites of amodiaquine.8 The set-up used for this study consists of a flow-through cell for electrochemical oxidation from ESA Bioscience Inc. (Chelmsford, MA), liquid chromatography for separation and mass spectrometry for the detection. A similar set-up was applied to test the performance of our chip system. The flow-through cell in the original set-up is exchanged by the chip and for comparison purposes, a commercial wall-jet cell was applied.The set-up used in this experiment is shown in figure 5. Sample solution is introduced into either the chip or a commercial flow cell (Antec Leyden, Flexcell) using two syringe pumps. The pump connected to the side channel of the chip was switched off during electrochemical oxidation.
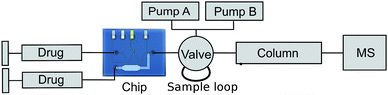 | ||
| Fig. 5 Setup used for the amodiaquine experiment (Electric connections and potentiostat not shown). | ||
The oxidation products are collected in a 10 µL sample loop, placed in a 6-port valve. After filling the sample loop, the valve is switched so the analytes are flushed onto the HPLC column and the MS subsequently. Due to the difference in volume between chip and sample loop, this setup can only be used for applications which are not time specific. For future, time critical EC-MS experiments the chip can be extended with an electrospray injection needle as described in a paper by M. Brivio et al.27
Instrumentation
Two syringe pumps from Cole Parmer (Vernon Hills, IL, type 74900) were used to introduce analyte into the chip. The potentials for the chip were applied by an in-house developed potentiostat.For the EC/LC/MS measurements, an LC system from Antec Leyden (Zoeterwoude, The Netherlands) was used, consisting of two LC 110 HPLC pumps, an AS 100 autosampler and a Decade II electrochemical detector, equipped with a Flexcell including a platinum working electrode.
The cells were coupled to a microTOF mass spectrometer from Bruker Daltronics (Bremen, Germany) equipped with an electrospray ionization (ESI) source.
The software used for controlling the EC-LC system was the Alexys data system (Antec Leyden). For controlling the MS and MS data handling microTOF Control v1.1 and DataAnalysis V3.3 (Bruker Daltronics) were used.
Chemicals
All reagents used were at least of of analytical reagent grade and obtained from Sigma Aldrich Chemie GmbH (Steinheim, Germany). Demineralized water used for the solutions was provided by a water purification system (Milli-Q Synthesis A10, Millipore). A stock solution was used for the Cyclic Voltammetry measurements, containing a mixture of 2.5 mM potassiumferricyanide, 2.5 mM potassiumferrocyanide, 0.1M potassiumnitrate as supporting electrolyte and 2 mM phosphate buffer (pH 7).The solution used for EC-UV/vis experiment contained a mixture of 1 mM potassiumferricyanide, 1 mM potassiumferrocyanide, 0.5M potassiumnitrate and 2 mM phosphate buffer (pH 7). UV/vis calibration has been done using different solutions containing a range of potassiumferricyanide concentrations from 0.01 mM to 2 mM.
For the amodiaquine (AQ) experiments, 50 µM AQ was dissolved in 20 mM ammonium formate solution with pH adjusted to 7.4.
Results and discussion
Cyclic voltammetry measurements
On-line, on-chip cyclic voltammetry measurements are recorded at various flow rates. The results for one specific type of chip are shown in figure 6.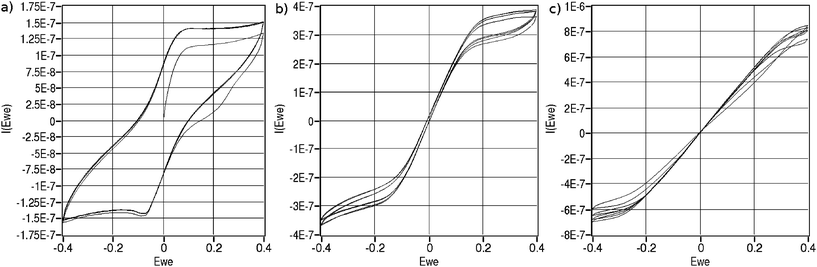 | ||
| Fig. 6 Cyclic voltammograms recorded in a solution containing 2.5 mM ferrocyanide, 2,5 mM ferricyanide, 0.1 M KNO3 and 2 mM phosphate buffer using a chip with a working electrode area of 2.4 mm2. Scan rate was 20 mV/s. a) no-flow, b) 0.1 µL/min c) 0.25 µL/min. | ||
Without flow, a typical diffusion limited curve can be observed (figure 6a). From equation 4, we can expect all ions directly above the electrode to be converted within a few microseconds. Since, a slow scan rate of 20 mV/s is used, the measured current is due to ions diffusing towards the beginning and end of the working electrode from the rest of the channel.
With increased flow, an added contribution of convection to the measured current is observed. Additionally, the shape of the currents appears to be the sum of the curve without flow and a linear relation depending on applied potential.
In table 1 the peak currents at −0.4 V at different flow rates and two chips with different working electrode area are shown. The data listed in the second column of table 1 can be fitted using a linear equation (R2 = 1):
| I = −0.15 × 10⁻⁶ − 2.2Qc | (7) |
| Chip | 1 | 2 |
|---|---|---|
| WE size | 2.4 mm2 | 1.8 mm2 |
| 0 µL/min | −0.15 µA | −0.15 µA |
| 0.1 µL/min | −0.37 µA | −0.39 µA |
| 0.25 µL/min | −0.70 µA | −0.72 µA |
| 0.5 µL/min | −1.25 µA | −1.25 µA |
With Qc the volumetric flow velocity in L/min. Note that the first term is equal to the measured current without flow. If mass-transport is assumed to be the rate limiting step, the measured current is known to be the sum of diffusion and convection. As can be concluded from equation 7, the measured current is indeed the sum of a constant diffusion factor and a linear contribution of volumetric flow.
A second observation from table 1, is that the current does not depend on the working electrode area as in normal bulk situation. Apparently all ions are converted at a small part of the working electrode. Therefore we assume that all introduced ions are converted.
We also tried to measure the conversion efficiency by integrating the measured current over time, while sufficient overpotential was applied to convert ferrocyanide into ferricyanide. The obtained result thus gives an estimate for the amount of charge transferred during the conversion. At total conversion this amount of charge should be equal to the amount of analyte present in the chip during conversion. However, due to small variations in the flow velocity, which was induced by the syringe pump, this method was not accurate enough. At zero flow, this method suffered from lateral diffusion from the channel inlets to the edges of the electrode.
Conversion efficiency study
Ferricyanide is known to show UV/vis absorbance at 418 nm.28 Prior to the conversion efficiency measurements, the UV/vis absorbance at 418 nm is calibrated for different ferricyanide concentrations. The result of this calibration is shown in figure 7.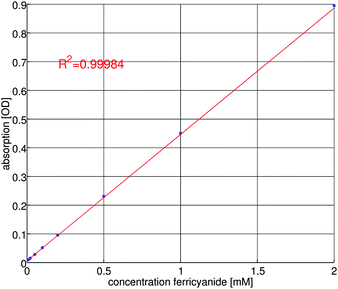 | ||
| Fig. 7 Calibration curve for UV/vis absorbance of ferricyanide. | ||
Next, a mixture of 1 mM ferricyanide, 1 mM ferrocyanide, 0.5 M KNO3 and 2 mM phosphate buffer (pH = 7) is oxidized at 0.5V or reduced at −0.5 V on-chip using a flow rate of 1 µL/min. The resulting reaction products are measured optically. The recorded UV/vis absorbance is shown in figure 8. At oxidating potentials, ferrocyanide is converted into ferricyanide. For reductive potentials, the reaction is reversed. As a result, the ferricyanide concentration will be decreasing at negative potentials.
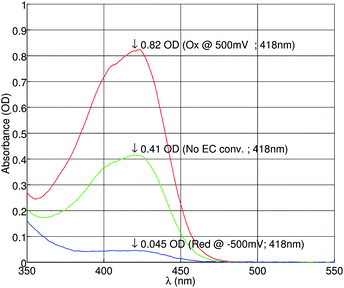 | ||
| Fig. 8 UV/vis absorbance of ferricyanide measured in a mixture of 1 mM/1 mM ferro-/ferricyanide (before EC conversion) and 0.5 M KNO3 supporting electrolyte and 2 mM phosphate buffer (pH = 7). | ||
As expected, the absorbance is indeed higher at the oxidizing potential of 0.5 V, and lower at the reducing potential of −0.5 V. From the measurement data, the conversion efficiency is calculated to be 97%. Therefore almost total conversion was achieved.
Amodiaquine experiments
The oxidative metabolism of amodiaquine (AQ, m/z 356 in positive ion mode) has been investigated by Lohmann et al.7 by isolated liver cell microsomes and by an electrochemical conversion in a flow-through cell. Using the results of those approaches the metabolic pathway, as demonstrated in figure 9, was developed.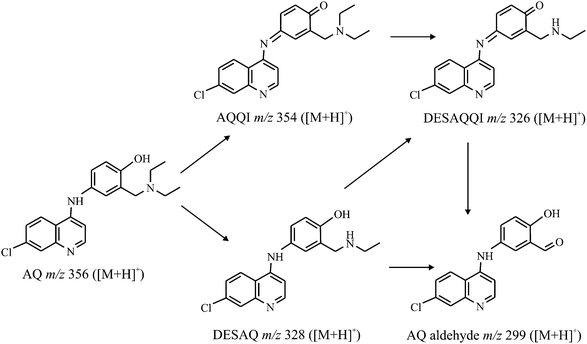 | ||
| Fig. 9 Electrochemical metabolism pathway of amodiaquine. | ||
The aim of our study is to generate the main oxidative metabolites, amodiaquine quinone imine (AQQI, m/z 354), N-dehylated AQQI (DESAQQI, m/z 326), N-dehylated AQ (DESAQ, m/z 328) and AQ aldehyde (AQ-ald, m/z 299) on a chip and in comparison on a commercial wall-jet cell (Flexcell, Antec Leyden).
As expected, the flow rates had to be reduced when using a wall-jet geometry instead of the flow-through cell with its large electrode surface. The optimum flow rate for the chip was determined as 1 µL/min and for the Flexcell as 10 µL/min. With both cells an oxidative potential of 1000 mV is applied to the working electrode.
The chromatograms of the reaction products of both cell types are shown in figure 10. With both cells, the main expected metabolites with m/z 356, 328, 354, 326 and 299 are observed. Therefore, it can be concluded that the electrochemical cell on chip gives comparable results as the wall-jet cell (Flexcell). Further, using the chip, the conversion of AQ into its metabolites is as high as the conversion in the Flexcell.
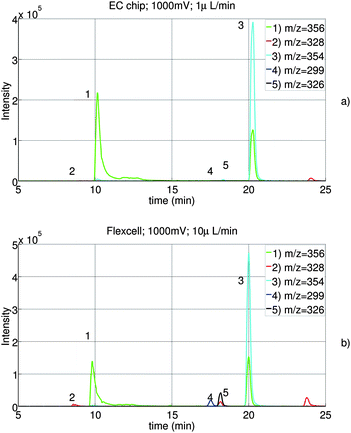 | ||
| Fig. 10 Combined extracted ion traces of AQ (1) and the four metabolites DESAQ (2), AQQI (3), AQ-ald (4) and DESAQQI (5) using our chip (a) and the flexcell from Antec Leyden (b). | ||
However, compared to the EC-UV/vis study, lower conversion efficiency is observed. In equation 6 and the experiments with ferricyanide, mass transport is assumed to be the reaction rate-limiting step. We believe that this is not the case for amodiaquine.
Conclusions
An electrochemical cell on chip for high conversion of the introduced electrochemically active species was developed. The internal volume of the main channel is only 9.6nL. Cyclic voltammograms at various flow rates are recorded on-chip. The measured currents were not influenced by the size of the working electrode. Therefore we believe that all introduced species are converted inside the chip at sufficiently high overpotentials.Using this chip we were also able to measure the electrochemical conversion of ferricyanide using UV/vis spectroscopy. A conversion efficiency of 97% has been observed at a flow rate of 1 µL/min. Therefore, this chip is able to fully convert small and fast reacting ions.
In the oxidation experiments of amodiaquine, the chip system allows us to obtain results similar to those obtained with conventional cell systems at a significantly reduced volume of sample and flow rate. The conversion efficiency considerations presented in the beginning of the paper and in the experiments with ferricyanide assumed mass transport to be the rate determining step in the total reaction. From our results, we conclude that this is not the case for the oxidation reaction of amodiaquine. However, the chip does show comparable results with the commercial alternatives.
Acknowledgements
We would like to thank Jan van Nieuwkasteele for his assistance with the chip fabrication and Roald Tiggelaar for his assistance with the UV/vis measurements and fruitful discussions.In the Netherlands, the three universities of technology have formed the 3TU.Federation. This article is the result of joint research in the 3TU.Centre for Bio-Nano Applications.
References
- A. P. Bruins, J. Chromatogr. A, 1998, 794, 345–357 CrossRef CAS.
- G. Diehl and U. Karst, Anal. Bioanal. Chem., 2002, 373, 390–398 CrossRef CAS.
- H. Hayen and U. Karst, J. Chromatogr. A, 2003, 1000, 549–565 CrossRef CAS.
- U. Karst, Angewandte Chemie Int. Ed., 2004, 43, 2476–2478 Search PubMed.
- F. Zhou and G. J. V. Berkel, Anal. Chem., 1995, 67, 3643–3649 CrossRef CAS.
- W. Lohmann and U. Karst, Anal. Bioanal. Chem., 2008, 391, 79–96 CrossRef CAS.
- U. Jurva, H. V. Wikstrom and A. P. Bruins, Rapid Commun. Mass Spectrom., 2000, 14, 529–533 CrossRef CAS.
- K. J. Volk, R. A. Yost and A. Brajter-Toth, Anal. Chem., 1989, 61, 1709–1717 CrossRef CAS.
- S. M. vanLeeuwen, B. Blankert, J.-M. Kauffmann and U. Karst, Anal. Bioanal. Chem., 2005, 382, 742–750 CrossRef CAS.
- W. Lohmann and U. Karst, Anal. Chem., 2007, 79, 6831–6839 CrossRef CAS.
- H. P. Permentier, U. Jurva, B. Barroso and A. P. Bruins, Rapid Commun. Mass Spectrom., 2003, 17, 1585–1592 CrossRef.
- K. J. Volk, M. S. Lee, R. A. Yost and A. Brajter-Toth, Anal. Chem., 1988, 60, 720–722 CrossRef CAS.
- B. H. Westerink, J. Chromatogr. B, 2000, 747, 21–32 CrossRef CAS.
- H. Deng and G. J. V. Berkel, Electroanalysis, 1999, 11, 857–865 CrossRef CAS.
- M. C. S. Regino and A. Brajter-Toth, Anal. Chem., 1997, 69, 5067–5072 CrossRef CAS.
- G.R. and S. Bruckenstein, J. Am. Chem. Soc., 1971, 93, 793–794 CrossRef.
- G. Hambitzer and J. Heitbaum, Anal. Chem., 1986, 58, 1067–1070 CrossRef CAS.
- X. Xu, W. Lu and R. B. Cole, Anal. Chem., 1996, 68, 4244 CrossRef CAS 4253.
- W. Lu, X. Xu and R. Cole, Anal. Chem., 1997, 69, 2478–2484 CrossRef CAS.
- B. H. Timmer, K. M. van Delft, R. P. Otjes, W. Olthuis and A. van den Berg, Anal. Chim. Acta, 2004, 507, 137–143 CrossRef CAS.
- S. Böhm, D. Pijanowska, W. Olthuis and P. Bergveld, Bios. Bioelectron., 2001, 16, 391–397 Search PubMed.
- M. Odijk, W. Olthuis, V. Dam and A. van den Berg, Electroanalysis, 2008, 20, 463–468 CrossRef CAS.
- V. A. T. Dam, W. Olthuis and A. van den Berg, Analyst, 2007, 132, 365–370 RSC.
- W. DeMalsche, H. Eghbali, D. Clicq, J. Vangelooven, H. Gardeniers and G. Desmet, Anal. Chem., 2007, 79, 5915–5926 CrossRef CAS.
- E. Oosterbroek, Modeling, Design and realization of microfluidic components, PhD thesis University of Twente, 1999 Search PubMed.
- A. J. Bard and L. R. Faulkner, Electrochemical methods, Wiley, 2001, 2nd edition Search PubMed.
- M. Brivio, R. E. Oosterbroek, W. Verboom, A. van den Berg and D. N. Reinhoudt, Lab Chip, 2005, 5, 1111–1122 RSC.
- H. W. Thompson, Advances in spectroscopyVol. 2, Intersience publishers network inc., London, 1961 Search PubMed.
| This journal is © The Royal Society of Chemistry 2009 |