Advanced reactor engineering with 3D printing for the continuous-flow synthesis of silver nanoparticles†
Obinna
Okafor
a,
Andreas
Weilhard
ab,
Jesum A.
Fernandes
b,
Erno
Karjalainen
a,
Ruth
Goodridge
a and
Victor
Sans
 *ab
*ab
aFaculty of Engineering, University of Nottingham, University Park, NG7 2RD, Nottingham, UK. E-mail: victor.sanssangorrin@nottingham.ac.uk
bGSK Carbon Neutral Laboratory, University of Nottingham, Nottingham, NG8 2GA, UK
First published on 25th January 2017
Abstract
The implementation of advanced reactor engineering concepts employing additive manufacturing is demonstrated. The design and manufacturing of miniaturised continuous flow oscillatory baffled reactors (mCOBR) employing low cost stereolithography based 3D printing is reported for the first time. Residence time distribution experiments have been employed to demonstrate that these small scale reactors offer improved mixing conditions at a millimetre scale, when compared to tubular reactors. Nearly monodisperse silver nanoparticles have been synthesised employing mCOBR, showing higher temporal stability and superior control over particle size distribution than tubular flow reactors.
Introduction
The development of continuous-flow processes is a topic of increasing interest both in academia and in industry. Indeed, carrying out reactions in intensified continuous flow reactors (CFR) is highly beneficial in applications requiring precise mixing, rapid heat transfer (highly exothermic) and fast reactions (high kinetics) as opposed to batch processing.1 Processing advantages in using continuous flow techniques include minimisation of waste through efficient use of reactants, enhanced handling of hazardous chemicals2 and improved reactions yields.3 Due to the large surface-to-volume ratio in flow reactors, reactants can be effectively cooled or heated during the reaction process.4 Asides the numerous benefits of heat transfer, mixing and kinetics, continuous flow reactors allow to characterise the product stream in-line with no disruption of the flow using spectroscopic techniques, thus allowing the real time monitoring, feedback and development of self-optimisation techniques.5,6Intensified reactors have found an ever increasing range of applications in synthetic chemistry from discovery7,8 to the processing of high added value reactions including pharmaceuticals,9 nanostructured10 and advanced molecular materials.3,11 In the microfluidic scale, the flow regime is laminar. Mixing on such small scale relies on intermolecular diffusion,12 thus being limited to small dimensions in the order of tens to few hundreds of microns. Therefore, their applications in industrial processes are limited due to inherently low productivity associated to the channel size. Numbering up strategies might help to overcome this limitation, but there is limited evidence of this.13 A slight increase in the scale of the reactor, in the millimetre scale, known as mesoscale reactors can offer a balance between productivity, by increasing the flow rates of the reagents and therefore the throughput of substrates being processed and energy demands (e.g. pumping power). Nevertheless, the increase in the dimensions has an associated reduction in the mixing properties of the reactor.
Advanced reactor design can be employed to optimise mixing at the milli- and mesoscale. An example of this consists of employing static mixers and a technology developed over the past few decades, the continuous oscillatory baffled reactor (COBR).14–16 The unique features of the technology that differentiates it from the tubular reactor are the combination of baffles placed at controlled intervals in the flow path, and the mechanical oscillation of the fluid.14 The oscillatory flow coupled with the baffles results in vortex rings being formed in the system leading to unique mixing patterns that allow achieving near plug flow conditions at low Reynolds numbers.17 In this way, an even velocity profile in the direction of flow, complete mixing in the radial direction and minimal mixing in the axial direction can be achieved employing this technology. Baffled cells can be envisioned as a number of continuous stirred tank reactors (CSTRs) in series. COBRs have been demonstrated in several synthesis applications including production of biodiesel15,18 and continuous-flow crystallisation.19,20 Improved mixing, facile handling of solids and reduced fouling have been reported as process advantages compared to tubular reactors.
COBR can help to close the gap between the discovery to manufacturing of chemicals and materials. This requires to be able to configure the reactors across the scales from laboratory, to pilot and up to industrial scale. However, an important limitation in the uptake of this technology is the difficulty to configure and manufacture the reactors employing conventional techniques. The down-scale of the reactor geometries is particularly challenging.
Additive manufacturing (AM), commonly referred to as 3D printing is an emerging concept in manufacturing, where complex geometries are manufactured layer-by-layer from a 3D model data (e.g. CAD design).21 It is a rapidly evolving field with capabilities to fabricate complex geometrical shapes at increasingly high resolutions. AM has led to the spring up of research areas in applications involving chemical synthesis. Cronin and co-workers reported for the first time the application of 3D printing to chemical synthesis, coining the term “reactionware”,22,23 including the development of fluidic devices for continuous-flow synthesis.24–26 This work has led to a new area of research, mostly in the development of 3D printed microfluidic devices for analytical applications.27 AM techniques have been employed in the fabrication of reactor devices by fused deposition modelling,21,24 selective laser sintering,21 ink-jetting,21,28 and stereolithography.21,29
Here we report the first example of a miniaturised continuous oscillatory baffle reactors (mCOBR) in a facile and cost effective fashion employing SLA based 3D printing techniques. The mixing properties of the 3D printed mCOBRs have been demonstrated by residence time distribution (RTD) tracer experiments. The superior flow dynamics of mCOBRs compared to tubular reactors of comparable dimensions has been demonstrated in the continuous-flow synthesis of silver nanoparticles. Indeed, the employment of a 3D printed mCOBR yields nanoparticle solutions with a narrower particle size distribution (PSD) and enhanced temporal stability due to the improved mixing and reduced fouling of the nanomaterials on the surface of the reactor.
A. SLA based 3D printing of baffled reactors
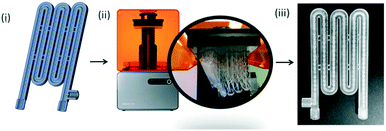
A conventional tubular reactor and baffled reactors were designed and manufactured using a stereolithography (SLA) based 3D printer as a proof of principle (see files in ESI†). Computer Aided Design (CAD) representations, like the example presented in Fig. 1 were designed on CREO Parametric. The CAD files were then converted to .STL format, which is a common file type that interfaces between CAD software and additive manufacturing platforms. The reactors were fabricated on a Formlabs Vat Polymerisation platform (Form 2) using the commercially available Formlabs Clear FLGPCL02 proprietary resin. The lowest resolution available in the machine was employed (0.1 mm) for the printing. A tough and rigid device was created layer-by-layer employing a laser which scanned traces on the photopolymer resin. The device was then cleaned and flushed through with isopropyl alcohol (IPA) to avoid curing of resin on the walls and internal channels. A post processing step of fine polishing shortly after fabrication with this resin produced clean and transparent reactor devices (e.g. Fig. S1†). This offers the possibility of visualising the flow patterns, thus enabling the employment of visual techniques30 and in-line spectroscopy31 for process characterisation.The mini-oscillatory baffled reactor device was designed with two inlets for residence time distribution studies (RTD) and three inlets for synthesis of silver nanoparticles. The supplementary inlet in both cases was required to introduce the oscillatory regime in the flow device. These reactor connectors were designed to fit to 1/16′′ standard fittings. The reactor devices had a similar volume of 2.7 mL with diameter of 2.5 mm. Table 1 shows the key design parameters employed to generate the internal geometry of the mCOBRs. Important geometrical parameters that have been found to directly affect the formation of the vortices, and which were deployed for this study are the baffle open area α = (Di/Do),2 baffle spacing (L) and thickness (δ). An optimal value of the baffle spacing results in even and fully propagated vortices in inter-baffle zones leading to uniform and effective mixing. The mini-OBR featured a baffle spacing of 1.6Do and baffle open area of 16 per cent. The dimensions used are in close range to effective geometry demonstrated in literature of 1.5Do baffle spacing and 16 per cent open baffle area.32 Processing at such optimal range lead to increased vortex width, promoting advection and minimised mixing time. Thinner baffle thickness (δ) are recommended, as larger baffles lead to longer ‘cling time’ and reduced flow separation.32
| Parameter | Symbol | Value |
|---|---|---|
| Baffle thickness | δ | 0.5 mm |
| Baffle spacing | L | 4 mm |
| Inner baffle diameter | D i | 1 mm |
| Outer baffle diameter | D o | 2.5 mm |
In terms of fabrication, the tubular reactor including support structure required 51.61 mL of resin taking 4 h 53 min to complete, whilst the mini-OBR required 54.9 mL of resin and 5 h 2 min. This works out to a material cost of £7.74 and £8.24 for the tubular and mCOBR reactor respectively (Table 2). The large build platform of the Form 2 printer allowed both designs to be printed simultaneously (see ESI,† Fig. S2). In this case, the total time of manufacturing was 7 h 39 min.
| Parameter | Tubular reactor | mCOBR |
|---|---|---|
| Reactor volume | 2.7 mL | 2.5 mL |
| Diameter | 2.5 mm | 2.5 mm |
| Resin volume | 51.67 mL | 54.9 mL |
| Fabrication time | 4 h 53 min | 5 h 2 min |
| Device cost | £7.74 | £8.24 |
To ascertain the quality and durability of the fabricated reactor connectors, the devices were pressure tested. This was achieved by connecting a device with a single inlet and outlet with standard fittings to a rig consisting of an HPLC pump, a pressure transducer, the 3D printed module and a back pressure regulator. The reactor device was pressurised to 85 bars without any breaks or leaks observed (see ESI,† video S1). To the best of our knowledge, this represents an increase of over 4-fold compared to the previously highest pressure reported in a printed flow device.33 This is due to the high resolution of the Form 2 printer, which allowed printing devices with high quality connectors. Although the surface roughness of fabricated parts will depend on the print resolution selected, at a 100 μm z-axis resolution of the SLA-based device, the root mean square surface roughness obtained was 2.9 μm.
The materials were also found to be compatible with several solvents of interest for synthetic chemistry and engineering, including isopropanol, EtOH, CH3CN and water. This was determined by soaking the polymerised resin in the respective solvents for 24 hours, drying them in a vacuum oven overnight and then measuring the ATR-IR and TGA and comparing them to the original resin (see ESI,† Fig. S3). Even though some differences were observed in the TGA, the core structure of the polymers remained unchanged as evidenced by ATR-IR, thus suggesting that the reactors can be employed for synthetic applications.
B. RTD studies and reactor modelling
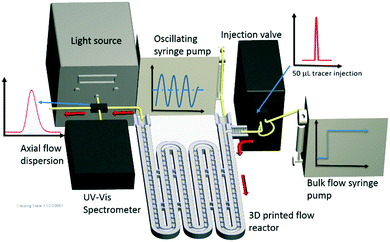
Residence time distribution (RTD) studies were employed to explore the behaviour of mCOBR and to test them against a tubular reactor as benchmark. RTD has been employed as a valuable tool for understanding the quality of mixing, mean residence time of materials and to model the flow within a reactor vessel.34 They allow for the preservation of selected flow patterns during the reactor design and serve as a quantifiable measure of the degree of back mixing in a flow system.35 RTD describes the quantity of time fluid elements have spent in the reactor in a flow system.36 Therefore the RTD of a continuous reactor is influenced by the rate of diffusion, the flow dynamics and internal geometry of the tubular reactor, e.g. baffles. RTD studies are also particularly important in making comparisons between reactors of different architectures and dimensions. A thorough understanding of the nature of mixing in the reactor can aid in scale-up.The setup is schematically described in Fig. 2 (see Fig. S4† for a picture of the rig) and comprises of two programmable C3000 Tricontinent pumps equipped with 5 mL syringes. One pump controls the net-flow through the reactor, while the second the oscillation of the fluid, thus creating no net flow. A programmable Rheodyne 6-way injection valve controlled with an Arduino and equipped with a 50 μL loop was employed to inject a pulse of a 1 mM aqueous solution of methylene blue. The experiments were done employing water as a solvent. An Avaspec UV/vis spectrometer and an Avantes DH-2000 light source were employed to collect the UV-vis data. RTD data was obtained by injecting a pulse of inert tracer into the reactor whilst the effluent stream was analysed by UV-vis spectroscopy, with respect to time. The system was controlled with in-house developed Labview VIs.
The RTD of the mCOBR under different oscillatory conditions was recorded and compared to the results obtained in a tubular reactor. In the tubular reactor, a single pump was used, connected to the 6-way valve before the inlet whilst the light source and spectrometer were coupled to the outlet. This allowed flowing the tracer through the reactor. To produce oscillation of the fluid in the OBR, another pump was attached to the second inlet. Silicon oil was used in oscillating the fluid to avoid back-mixing of reagents and tracers between bulk flow and the oscillating fluid. The system was designed to have the oil just before the reactor inlet of the continuous flow, thus avoiding dead volume in the reactor (Fig. S5†).34
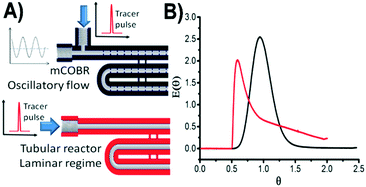
To compare the reactors under similar conditions, the two reactors were tested at a flow rate of 1 mL min−1 with the mCOBR having an oscillatory frequency and amplitude of 24 Hz and 2 mm respectively. Fig. 3B shows the E(θ) curve for both reactor configurations. The mathematical development to calculate E(θ) can be found in the ESI.† Under the conditions studied, the mCOBR showed a narrower and more symmetrical RTD compared to the tubular reactor. The symmetrical curve indicated a less dispersed and uniform flow through the reactor, hence coming closer to ideal plug flow conditions.37 In the case of the tubular reactor, the E(θ) curve showed an early peak of tracer followed by a long tail of tracer, indicating a high degree of back mixing due to the parabolic flow profile typically associated with laminar flow.34
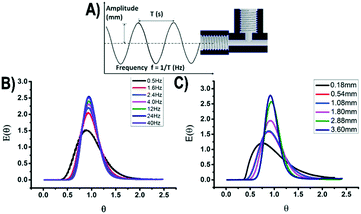
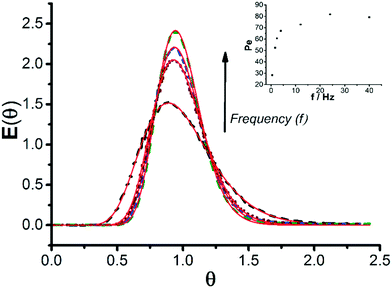
After demonstrating the increased efficiency in mixing from the 3D printed mCOBR as compared to the tubular reactor, the influence of the oscillatory conditions (frequency and amplitude) on the RTD profiles were explored. At a flow rate of 1 mL min−1 and an oscillatory amplitude of 2 mm, the frequency of the system was altered between 0.5–40 Hz. The RTD curves are shown in Fig. 4B. In the lower frequency values (0.5–12 Hz) a qualitative improvement of mixing was observed. It is worth noting that under low frequency, a saw-like profile was observed, due to the oscillatory conditions of the system. As frequency increased, this effect was minimised. At the higher frequencies evaluated (>24 Hz) there was no significant reduction in the variance of the RTD curve.
The oscillatory amplitude of the system showed also a remarkable influence on the axial dispersion (Fig. 4C). This was demonstrated by testing different amplitudes between 0.18 mm and 3.6 mm at a constant flow rate of 1 mL min−1 and a frequency of 24 Hz. Indeed, an increase in amplitude led to a reduction in the dispersion of the E(θ) curves. At high amplitudes and frequencies plugs of silicon were observed in the reactor. Therefore, higher values of frequency and amplitude above 40 Hz and 4 mm respectively, were avoided.
Increasing the frequency and amplitude of the oscillation led to narrower distributed RTD curves, indicating a closer resemblance to plug flow or perfect mixing.38 The experimental results were fitted to the axial dispersion model using open–open boundary condtion.34 This model assumes the movement of the fluid is made of the convective component, as a result of the bulk motion, and the diffusive component arising from random motion of the fluid elements.39 Similar RTD studies employing pulse tracer experiments and an axial dispersion models have been demonstrated, aiding the modelling of flow and packed bed reactors.37
The experimental data shows an excellent fit to the axial dispersion model (Fig. 5). Similar to the oscillatory frequency results, the oscillatory amplitude data obtained fit with the axial dispersion model. This is consistent with a homogeneous distribution of the flow through the reactor, without any indication of channelling or dead volumes. Increasing the oscillatory frequency, led to an increase of the Peclet module values (Pe), which is inversely correlated with the axial dispersion coefficient (see ESI†). Hence, it can be observed that as previously mentioned, the reduction of dispersion varies with the frequency until a threshold of 24 Hz and afterwards, no subsequent improvement was observed.
The velocity ratio (ψ = Reo/Ren) is key in COBR design as a value of 1 shows an overall flow reversal whilst larger values will lead to an increase in the domination of the oscillatory effects over the fluid flow.40 Achieving close to plug flow conditions in this study required much higher ψ than previously reported as the scale studied is smaller scale compared to the literature.40 The tested ψ range here is between 1.85 to 160. In the mCOBR, the best oscillatory conditions studied (f = 24 Hz & A = 2 mm) showed a ψ = 88.83 Pe (N tanks-in-series = Pe/2) = 82. In fact, the low axial dispersion obtained at such a scale cannot be achieved without similar advanced mixing technology.
C. Silver nanoparticle synthesis
Silver nanoparticles (Ag-NPs) are of major interest for a manifold of applications, such as photovoltaics,41 biological42 – and chemical catalysis43 due to their unique optical,44 chemical45 and electronical46 properties. Consequently, the synthesis of Ag-NPs in continuous flow is an area of high interest.47Ag-NPs show a general tendency to agglomerate, leading to fouling on the reactor walls.48 Under continuous flow conditions, this causes a constant change in the nature of the reactor walls, which prevents a controlled and stable formation of nanoparticles under steady state. Furthermore, the formation of Ag-NPs is strongly dependent on chemical and physical properties such as temperature, pH, stabilizer, all of them influencing the different kinetic processes typically responsible for this type of synthesis.49–51 Hence, it is very challenging to generate monodisperse solutions of NPs with controlled size.52,53 In this work, 3D printed mCOBR was used for the continuous synthesis of Ag-NPs. We hypothesized that the improved mixing observed in these reactors should allow the generation of small nanoparticles (NPs) with narrow size distribution in a controlled, stable and reproducible fashion.
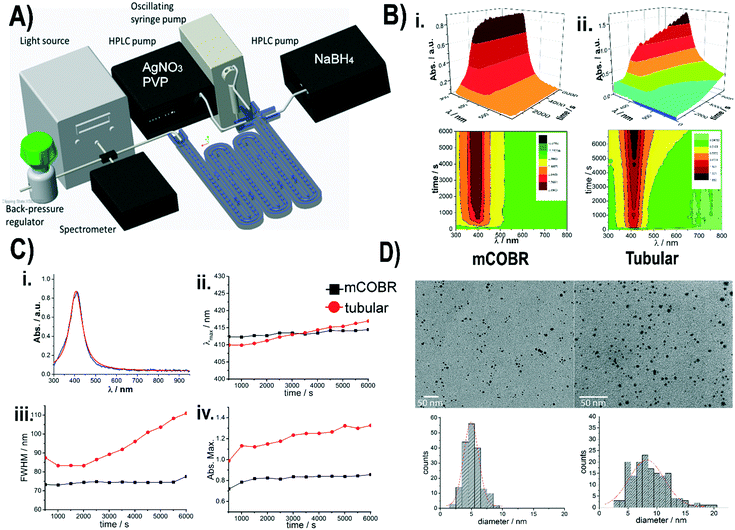
The platform assembled to synthesise Ag-NPs is schematically shown in Fig. 6A and a picture of the platform can be found in Fig. S6.† Two HPLC pumps were employed to pump a 0.25 mM solution of AgNO3 in CH3CN, and another with 0.75 mM of NaBH4 and 0.75 g PVP in CH3CN. A programmable syringe pump equipped with a 5 mL syringe was employed to generate the oscillation (0.1 mm & 40 Hz) with an immiscible silicon oil to prevent back mixing of the reagents. A mCOBR and a tubular reactor were employed to generate the nanoparticles. All the experiments were performed at room temperature. The formation of the Ag-NPs was monitored by UV-vis at the outlet of the reactor as a function of time. The system was maintained under controlled pressure (4 bar) employing a back-pressure regulator.
The synthesis of Ag-NPs was run for 100 minutes at a combined flow rate of 2 mL min−1 with the tubular reactor and mCOBR devices. In the mCOBR the third inlet allows for oscillation to be imposed on the flow of the reagents. The extinction spectra as a function of time, after reaching the steady state, was more stable in the mCOBR compared to the tubular reactor, where the absorption was increased during the experiment (Fig. 6B). The spectra were analysed in more detail to get further insights into these observations.
In the first place, it is worth mentioning that the NPs synthesized under oscillatory conditions showed a small shoulder at 385 nm (Fig. 6Ci), albeit being less pronounced in a tubular reactor. This could be due to dipole–dipole interaction of NPs or solvent polarisation.44 It is well known that the UV-vis spectra of Ag, Au and Cu nanoparticles can be described as a Lorentzian type function, where the width describes the size distribution, the maximum absorption the average size and the intensity of the absorption the concentration of the formed NPs.54 Hence, the spectra acquired were fitted to a Lorentzian function and the characteristic parameters were plotted against time. Initially, until the steady state was achieved, both tubular and mCOBR reactors showed relatively broad particle size distributions (see Fig. S7†). After the steady state was established, mCOBR showed a remarkable stability, evidenced by a stable plasmon resonance at approximately 413 nm with a constant value of full width at half maximum (FWHM) of ca. 72 nm and maximum absorption (see Fig. 6ii–iv, black squares). On the other hand, in the tubular reactor, λmax increased from 410 nm to 417 nm, while an almost linear shift from 82 nm to 110 nm in FWHM was observed after 2000 s. This indicated an increase in particle size and size distribution with time. Furthermore, the concentration of the NPs synthesized under mCOBR seemed more constant than in a tubular reactor as indicated by the total absorption (Fig. 6Civ). The increase of absorbance in the tubular reactor can be associated to scattering from the nanoparticles due to a larger particle size, broader particle size distribution and less regular patterns. The improved results obtained with the mCOBR can be explained by an improved mixing and reduced fouling leading to more stable reaction conditions. A visual analysis of the different reactors clearly indicates a much reduced amount of fouling in the mCOBR as compared to the tubular reactor (Fig. S8†). The production of silver nanoparticles in the mCOBR was run for a further 100 minutes to assess the long term stability. The results obtained were consistent with the previous time series without any apparent change in the UV-vis spectra and no visual changes in the deposition.
The analysis of the UV-vis spectra for both reactor configurations was supported by means of TEM, using a JEOL 2000FX operated at 200 kV. TEM images displayed a narrow distribution of Ag-NP with a particle size of 5.0 nm ± 1.2 nm for the NPs prepared under oscillatory conditions (Fig. 6D, left). The NPs present of evenly spherical structure and small amounts of agglomerates can be observed (see Fig. 6D, left). However, Ag-NP prepared in a traditional tubular reactor tend to form more polydisperse solutions with greater proportion of agglomerates, resulting in particles sizes of 8.3 nm ± 3.0 (see Fig. 6D, right). In fact, NPs obtained from a tubular reactor were not of uniform spherical structure, see ESI,† Fig. S9. It is important to emphasise that the narrower silver particle size and reduced fouling observed is as a result of both the micro and macro mixing effects created by the interaction between the fluid oscillation and the baffles in the flow channel.
The crucial role of oscillation was proven by repeating the synthesis in a baffled reactor operated without oscillation. Under these conditions, unstable Ag-NP were formed and a colour change of the samples was observed (ESI,† Fig. S10). Furthermore, TEM-measurements indicated a high poly dispersity of the sample and consequently the sample cannot be described by a Gaussian distribution (see ESI,† Fig. S10). The excessive silver deposited on the walls of the reactor was removed by carefully flushing the reactor with strong acids (aqua regia) followed by extensive washing with deionised water. The reactors recovered the original aspect. However, upon reutilisation, a shift in the plasmon of resonance of the Ag-NPs to 425 nm was observed (Fig. S11†), presumably due to modifications in the nature of the polymer material at the surface.
Conclusions
The possibility of manufacturing advanced reactors employing 3D printing has been demonstrated in this work. In this way, miniaturised continuous flow oscillatory baffled reactors have been manufactured employing low cost SLA machines for the first time. The high resolution of the printer, coupled with the satisfactory solvent compatibility of the photopolymers employed, enabled the development of reactors with advanced features, such as regularly spaced and geometry controlled baffles by simple CAD design. Furthermore, the direct printing of high quality threads allowed working under controlled back pressure. Indeed, the mCOBR manufactured here showed improved mixing patterns over the conventional tubular reactor employed as a control. The frequency and amplitude of the flow oscillation was found to have a significantly positive effect on the residence time distribution. Narrowly dispersed silver nanoparticles with very small particle size have been manufactured with an excellent stability over time due to the reduced fouling obtained in the mCOBR.The scale of the reactors demonstrated in this work bridges an important gap between the microfluidic laboratory scale and the industrial scale, speeding up the discovery to manufacturing process. The simplicity, low cost and rapid uptake of 3D printing technology will enable the development of numerous applications of advanced reactor engineering in continuous-flow chemical manufacturing.
Acknowledgements
The authors want to acknowledge the Royal Society (RG150021) and EPSRC EP/I033335/2 for funding essential to the development of this work. University of Nottingham (UoN) MANUFACTURING METROLOGY TEAM is acknowledged for the surface characterisation and the Research Priority Area (RPA) in Advanced Molecular Materials is gratefully acknowledged for funding supporting the analytical characterisation. EK gratefully acknowledges the Finnish Cultural Foundation (Suomen Kulttuurirahasto) for funding.Notes and references
- R. L. Hartman, J. P. McMullen and K. F. Jensen, Angew. Chem., Int. Ed., 2011, 50, 7502–7519 CrossRef CAS PubMed
.
- M. Movsisyan, E. I. P. Delbeke, J. Berton, C. Battilocchio, S. V. Ley and C. V. Stevens, Chem. Soc. Rev., 2016, 45, 4892–4928 RSC
.
- C. J. Brown, J. Sefcik, A. J. Florence, C. A. Clark, N. E. B. Briggs and T. McGlone, Org. Process Res. Dev., 2015, 19, 1186–1202 CrossRef
.
- E. A. Mansur, M. Ye, Y. Wang and Y. Dai, Chin. J. Chem. Eng., 2008, 16, 503–516 CrossRef CAS
.
- V. Sans and L. Cronin, Chem. Soc. Rev., 2016, 45, 2032–2043 RSC
.
- V. Sans, L. Porwol, V. Dragone and L. Cronin, Chem. Sci., 2015, 6, 1258–1264 RSC
.
- C. J. Richmond, H. N. Miras, A. R. de la Oliva, H. Y. Zang, V. Sans, L. Paramonov, C. Makatsoris, R. Inglis, E. K. Brechin, D. L. Long and L. Cronin, Nat. Chem., 2012, 4, 1038–1044 CrossRef PubMed
.
- H. N. Miras, G. J. T. Cooper, D. L. Long, H. Bogge, A. Muller, C. Streb and L. Cronin, Science, 2010, 327, 72–74 CrossRef CAS PubMed
.
- X. L. Fan, V. Sans, P. Yaseneva, D. D. Plaza, J. Williams and A. Lapkin, Org. Process Res. Dev., 2012, 16, 1039–1042 CrossRef CAS
.
- V. Sebastian and K. F. Jensen, Nanoscale, 2016, 8, 15288–15295 RSC
.
- M. E. Briggs, A. G. Slater, N. Lunt, S. Jiang, M. A. Little, R. L. Greenaway, T. Hasell, C. Battilocchio, S. V. Ley and A. I. Cooper, Chem. Commun., 2015, 51, 17390–17393 RSC
.
- V. Hessel, H. Löwe and F. Schönfeld, Chem. Eng. Sci., 2005, 60, 2479–2501 CrossRef CAS
.
- Y. Su, K. Kuijpers, V. Hessel and T. Noel, React. Chem. Eng., 2016, 1, 73–81 CAS
.
- A. P. Harvey, M. R. Mackley and P. Stonestreet, Ind. Eng. Chem. Res., 2001, 40, 5371–5377 CrossRef CAS
.
- A. P. Harvey, M. R. Mackley and T. Seliger, J. Chem. Technol. Biotechnol., 2003, 78, 338–341 CrossRef CAS
.
- M. Zheng and M. Mackley, Chem. Eng. Sci., 2008, 63, 1788–1799 CrossRef CAS
.
- H. Jian and X. Ni, Chem. Eng. Res. Des., 2005, 83, 1163–1170 CrossRef CAS
.
- A. N. Phan, A. P. Harvey and V. Eze, Chem. Eng. Technol., 2012, 35, 1214–1220 CrossRef CAS
.
- S. Lawton, G. Steele, P. Shering, L. Zhao, I. Laird and X.-W. Ni, Org. Process Res. Dev., 2009, 13, 1357–1363 CrossRef CAS
.
- T. McGlone, N. E. B. Briggs, C. A. Clark, C. J. Brown, J. Sefcik and A. J. Florence, Org. Process Res. Dev., 2015, 19, 1186–1202 CrossRef CAS
.
- A. J. Capel, M. Thurstans, R. J. Bibb, R. D. Goodridge, S. D. R. Christie and S. Edmondson, Lab Chip, 2013, 13, 4583–4590 RSC
.
- M. D. Symes, P. J. Kitson, J. Yan, C. J. Richmond, G. J. T. Cooper, R. W. Bowman, T. Vilbrandt and L. Cronin, Nat. Chem., 2012, 4, 349–354 CrossRef CAS PubMed
.
- P. J. Kitson, S. Glatzel, W. Chen, C.-G. Lin, Y.-F. Song and L. Cronin, Nat. Protoc., 2016, 11, 920–936 CrossRef CAS PubMed
.
- P. J. Kitson, L. Cronin, V. Dragone, V. Sans and M. H. Rosnes, Lab Chip, 2012, 12, 3267–3271 RSC
.
- V. Dragone, V. Sans, M. H. Rosnes, P. J. Kitson and L. Cronin, Beilstein J. Org. Chem., 2013, 9, 951–959 CrossRef CAS PubMed
.
- J. S. Mathieson, M. H. Rosnes, V. Sans, P. J. Kitson and L. Cronin, Beilstein J. Nanotechnol., 2013, 4, 285–291 CrossRef PubMed
.
- A. K. Au, W. Huynh, L. F. Horowitz and A. Folch, Angew. Chem., Int. Ed., 2016, 55, 3862–3881 CrossRef CAS PubMed
.
- J. L. Erkal, A. Selimovic, B. C. Gross, S. Y. Lockwood, E. L. Walton, S. McNamara, R. S. Martin and D. M. Spence, Lab Chip, 2014, 14, 2023–2032 RSC
.
- K. C. Bhargava, B. Thompson and N. Malmstadt, Proc. Natl. Acad. Sci. U. S. A., 2014, 111, 15013–15018 CrossRef CAS PubMed
.
- M. O'Brien, P. Koos, D. L. Browne and S. V. Ley, Org. Biomol. Chem., 2012, 10, 7031–7036 Search PubMed
.
- T. Monaghan, M. J. Harding, R. A. Harris, R. J. Friel and S. D. R. Christie, Lab Chip, 2016, 16, 3362–3373 RSC
.
- M. Abbott, A. Harvey, G. V. Perez and M. Theodorou, Interface Focus, 2013, 3, 20120036 CrossRef CAS PubMed
.
- A. J. L. Morgan, L. Hidalgo San Jose, W. D. Jamieson, J. M. Wymant, B. Song, P. Stephens, D. A. Barrow and O. K. Castell, PLoS One, 2016, 11, e0152023 Search PubMed
.
-
O. Levenspiel, Chemical reaction engineering, John Wiley and Sons (WIE), New York, 3 edn, 1999 Search PubMed
.
-
H. S. Fogler, Elements of chemical reaction engineering, Prentice-Hall, 1986 Search PubMed
.
- J. T. Adeosun and A. Lawal, Chem. Eng. Sci., 2009, 64, 2422–2432 CrossRef CAS
.
- V. Sans, S. V. Luis, E. García-Verdugo, I. M. Burguete and N. Karbass, RSC Adv., 2012, 2, 8721–8728 RSC
.
- D. Wolf and W. Resnick, Ind. Eng. Chem. Fundam., 1963, 2, 287–293 CAS
.
- A. D. Martin, Chem. Eng. Sci., 2000, 55, 5907–5917 CrossRef CAS
.
- P. Stonestreet and P. Van Der Veeken, Chem. Eng. Res. Des., 1999, 77, 671–684 CrossRef CAS
.
- E. S. Arinze, B. Qiu, G. Nyirjesy and S. M. Thon, ACS Photonics, 2016, 3, 158–173 CrossRef CAS
.
- H. Zhihai, J. Xiaoli, G. Dawei and G. Ning, J. Nanosci. Nanotechnol., 2011, 11, 9395–9408 CrossRef
.
- P. Christopher, H. L. Xin and S. Linic, Nat. Chem., 2011, 3, 467–472 CAS
.
- D. D. Evanoff and G. Chumanov, ChemPhysChem, 2005, 6, 1221–1231 CrossRef CAS PubMed
.
- S. Sarina, E. R. Waclawik and H. Zhu, Green Chem., 2013, 15, 1814–1833 RSC
.
-
László Guczi, Z. Pászti and G. Peto, Metal Nanoclusters in Catalysis and Materials Science, 2008, vol. 4, pp. 77–105 Search PubMed
.
- A. Knauer and J. M. Koehler, Nanotechnol. Rev., 2014, 3, 5–26 CAS
.
- S. L. Poe, M. A. Cummings, M. P. Haaf and D. T. McQuade, Angew. Chem., Int. Ed., 2006, 45, 1544–1548 CrossRef CAS PubMed
.
- R. C. Jin, C. J. Zeng, M. Zhou and Y. X. Chen, Chem. Rev., 2016, 116, 10346–10413 CrossRef CAS PubMed
.
- G. S. Fonseca, G. Machado, S. R. Teixeira, G. H. Fecher, J. Morais, M. C. M. Alves and J. Dupont, J. Colloid Interface Sci., 2006, 301, 193–204 CrossRef CAS PubMed
.
- L. S. Ott and R. G. Finke, Coord. Chem. Rev., 2007, 251, 1075–1100 CrossRef CAS
.
- J. F. A. de Oliveira and M. B. Cardoso, Langmuir, 2014, 30, 4879–4886 CrossRef PubMed
.
- H. S. Shin, H. J. Yang, S. B. Kim and M. S. Lee, J. Colloid Interface Sci., 2004, 274, 89–94 CrossRef CAS PubMed
.
- W. Haiss, N. T. K. Thanh, J. Aveyard and D. G. Fernig, Anal. Chem., 2007, 79, 4215–4221 CrossRef CAS PubMed
.
Footnote |
| † Electronic supplementary information (ESI) available: Experimental details about methods and characterisation are included. See DOI: 10.1039/c6re00210b |
| This journal is © The Royal Society of Chemistry 2017 |

