An erasable photo-patterning material based on a specially designed 4-(1,2,2-triphenylvinyl)aniline salicylaldehyde hydrazone aggregation-induced emission (AIE) molecule†
Lili
Wang
a,
Yuanyuan
Li
 b,
Xuejiao
You
a,
Kui
Xu
a,
Qi
Feng
a,
Jinmin
Wang
a,
Yuanyuan
Liu
a,
Kai
Li
*a and
Hongwei
Hou
*a
aCollege of Chemistry and Molecular Engineering, Zhengzhou University, Henan 450001, P. R. China. E-mail: likai@zzu.edu.cn; houhongw@zzu.edu.cn
bSchool of Chemistry and Chemical Engineering, Henan University of Technology, Henan 450001, P. R. China
First published on 2nd November 2016
Abstract
Luminescent molecules with photochromic properties show strong potential in molecular switches, molecular logic gates, photo-controllable materials, bio-imaging, anti-counterfeiting, photo-patterning, etc. However, research is still scarce in such molecules exhibiting reversible photo-controllable color and fluorescence changes in solid states, which is due to the aggregation-caused quenching (ACQ) effect of most luminogens. In this work, a reversible photochromic molecule (1) with aggregation-induced emission (AIE) properties was developed. Compound 1 exhibits typical AIE properties as a result of restricted intramolecular rotation (RIR) and excited-state intramolecular proton transfer (ESIPT) processes. As a photochromic molecule, compound 1 shows reversible color and fluorescence changes upon UV light irradiation with good fatigue resistance. More importantly, the conversion rate from its irradiated form to its initial form is controllable by temperature and long wavelength light irradiation, which makes it suitable for photo-patterning materials with erasable properties.
1 Introduction
Luminescent materials have attracted much attention due to their diverse applications in chemistry, physics, materials science, and biology.1 However, most of their practical uses are usually limited by the notorious aggregation-caused quenching (ACQ) phenomenon: luminogens exhibit good fluorescence in dilute solutions but weak or even no fluorescence in concentrated solution or solid state as a result of the self-quenching effect of adjacent molecules.2 In 2001, a novel luminescence phenomenon of aggregation-induced emission (AIE) was first observed by the group of Tang, which is exactly opposite to the ACQ effect: the emission of luminogens was very weak in solution but became intense when aggregates formed.3 Since then, a variety of AIE systems (tetraphenylethenes (TPE), hexaphenylsilole (HPS), cyanostilbenes, salicyladazine (SA), etc.) were reported in succession, which have been widely applied in the fields of organic light-emitting diodes (OLEDs), chemical sensors and multifunctional luminescent materials.4Recently, Tang and co-workers have successfully expanded the application of AIE luminogens by developing a photo-activatable AIE system based on a caged TPE derivative.5 The fluorescence emission of the AIE group was partially or completely quenched by the quencher but can be recovered upon cleavage of the quencher under UV stimuli. The following work of another photo-activatable AIE system based on caged SA derivatives was reported by Xiang and Tong's group.6 These novel photochromic systems show great potential for applications in photo-patterning, photo-activatable imaging and anti-counterfeiting related areas. However, the photochromism of these caged fluorophores is irreversible, which limit their applications.7 To overcome this challenge, some new strategies in the design of irreversible photo-controllable AIE systems have been introduced such as photo-induced redox reactions and photo-induced cyclization reactions. Nevertheless, the fatigue resistances of these photochromic systems are still unsatisfactory.8
According to the reports, salicylaldehyde hydrazone is a reversible photochromic group with good fatigue resistance.9 Upon UV irradiation, there is a reversible tautomerism between its enol-form and keto-forms (Scheme 1). Notably, the enol-form of salicylaldehyde hydrazone is beneficial for fluorescence emission due to an excited-state intramolecular proton transfer (ESIPT) process.10 The keto-forms of salicylaldehyde hydrazone, in contrast, are a typical fluorescence quenching unit due to its strong electron-withdrawing properties.11 These unique properties of salicylaldehyde hydrazone suggest that it could be used as a photo-controllable quencher in the design of photo-controllable luminescent molecules.
In this work, a reversible photochromic AIE molecule was developed by connecting salicylaldehyde hydrazone with a typical AIE moiety of TPE (Scheme 2). This specially designed AIE molecule of 4-(1,2,2-triphenylvinyl)aniline salicylaldehyde hydrazone (1) exhibited reversible photochromic properties with a significant fluorescence change. Before UV irradiation, 1 was yellow and exhibited strong fluorescence emission in the aggregated state. After UV irradiation, 1 turned red and the fluorescence emission declined significantly. The good fatigue resistance properties of 1 enable it to be applied in reversible photo-patterning and anti-counterfeiting related applications.
2 Experimental
2.1. Materials
Salicylaldehyde, aniline, (2-bromoethene-1,1,2-triyl)tribenzene, 4-aminobenzeneboronic acid hydrochloride, o-anisaldehyde, and tetrabutylammonium bromide (TBAB) were purchased from J&K Chemical Co., Beijing, China. All the other materials were purchased from Sinopharm Chemical Reagent Beijing Co., Beijing, China. In these experiments, all the materials of analytical grade were used without further purification.2.2. Characterizations
1H and 13C NMR spectra were recorded on a Bruker 400 Avance NMR spectrometer operated at 400 MHz. UV-Vis absorption spectra were recorded on a JASCO V-750 spectrophotometer. UV-Vis diffuse reflectance spectra were recorded using an Agilent Cary 5000 UV-Vis-NIR Spectrometer, wherein BaSO4 was used as the reference. Fluorescence spectra were obtained on a Hitachi F-4600 spectrometer. Fluorescence lifetimes and quantum yields were recorded on an Edinburgh FlS-980 fluorescence spectrometer. Dynamic light scattering (DLS) experiments were performed using a NanoPlus-3 dynamic light scattering particle size/zeta potential analyzer at room temperature. ESI-MS spectra were obtained on an Agilent Technologies 6420 triple quadrupole LC/MS without using the LC part. Elemental analysis experiments were carried out on a Flash EA 1112 automatic element analyzer. Single-crystal X-ray diffraction intensity data were collected on a Rigaku Saturn 724 CCD diffractometer with Mo Kα radiation (λ = 0.71073 Å) at room temperature. X-ray Powder Diffraction (XRD) patterns were obtained using a PANalytical X'Pert PRO diffractometer. The photos and videos were obtained with a Nikon D5500 camera. A laser of 405 nm used in Video S1 (ESI†) was produced by an LD-T405F00 laser pointer (power output 20 mW). Visible light used in Video S1 (ESI†) and light sources used in Table S1 (ESI†) and Fig. 10 were produced using a CEL-HXF300/CEL-HXUV300 xenon light source with different optical filters.2.3. Synthesis
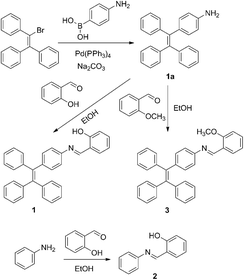
Compounds 1–3 were synthesized according to the synthetic routes shown in Scheme 3. The new compounds were characterized by NMR spectra and ESI-MS spectra. Detailed synthetic procedures and characterization data are shown below and in the ESI.†3 Results and discussion
3.1 The AIE characteristics of 1
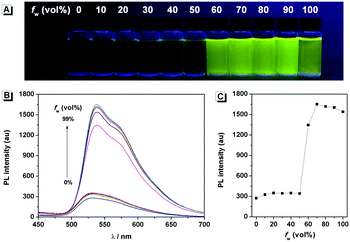
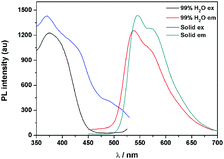
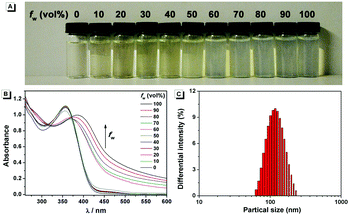
The fluorescence characteristics of 1 were investigated for the first time in H2O/EtOH (H2O is a poor solvent for 1 while EtOH is a good solvent for 1, water fraction (fw) from 0% to 99%, v/v) buffered by 10 mmol L−1 PBS at pH 7.0. As shown in Fig. 1, the fluorescence emission of 1 at 539 nm was rather weak in ethanol and barely increased before the fw reached 50%. When fw reached 60%, the fluorescence emission suddenly enhanced, which was almost 5-fold greater than that in ethanol solution and even larger when fw varied from 70% to 99%. The enhanced fluorescence emission could be contributed to the poor solubility of 1 in water compared to that in EtOH, which indicated that 1 exhibited typical AIE characteristics. The fluorescence spectra of 1 in the solid state are similar to that of 1 in poor solvent (fw = 99%), as can be seen in Fig. 2, which further supported the AIE characteristics.To further verify that the emission enhancement was induced by aggregation, the absorption spectra of 1 in different water fractions were recorded (Fig. 3B). In pure ethanol, an absorption peak of 1 at 353 nm was observed. Along with the increase of fw, the fine structures of absorption spectra disappeared gradually, and level-off tails in the visible region could be clearly observed when fw was higher than 50%. The level-off tails in the absorption spectra are believed to be due to the light scattering of aggregate suspensions.14 The aggregation of 1 in the poor solvent of water was further proved by the dynamic light scattering (DLS) measurement (Fig. 3C). As shown, particles around 100 nanometer sizes were detected in an aqueous solution of 99% H2O/EtOH (v/v). In contrast, no particle could be observed for 1 in ethanol.
3.2 The origination of the AIE characteristics of 1
It is worth noting that the maximum fluorescence emission wavelength of 1 is remarkably longer than that of the TPE monomer (λmax = 453 nm),12 but similar to that of SA (λmax = 542 nm).13 This result suggested that the AIE properties of 1 might have originated not only from the TPE moiety but also from the salicylaldehyde hydrazone moiety. To confirm this assumption, anilinesalicylaldehyde hydrazone (2) and 4-(1,2,2-triphenylvinyl)aniline-2-methoxybenzaldehyde hydrazone (3) were chosen as control compounds. As shown in Scheme 3, compound 2 was designed in the absence of the TPE part as compared to 1. As expected, 2 exhibited no fluorescence in both EtOH and aqueous solution (fw = 99%), which indicated that the TPE part in compound 1 is indispensable for its AIE properties (Fig. S1, ESI†).It is well known that the AIE properties of TPE and its analogues originate from the restricted intramolecular rotation (RIR) process: in good solvents, the molecules in the single state and the conjugate plane of phenyl rings undergo dynamic intramolecular rotations, resulting in excited state non-radiative transition and fluorescence quenching. In poor solvents or solid state, the molecules are aggregated and the rotations are greatly restricted, which make radiative transition the primary pathway for the excited state electrons back to the ground state.14 To further verify that the RIR process contributed to the AIE properties of 1, the fluorescence emissions of 1 in solvent with high viscosity (ethanol/glycerin) were investigated. As shown in Fig. 4, the fluorescence emission of 1 enhanced gradually with the increase of the glycerin fraction (fg) because the high viscosity solvent restricted the intramolecular rotations. Meanwhile, no level-off tail could be observed in their absorption spectra, which suggested that there was no aggregate of 1 in glycerin. These results indicate that the RIR process is one of the main causes for the AIE properties of 1. Moreover, the RIR process is also supported by the crystal structure of 1. A single crystal of 1 was grown from methanol/ethanol mixtures by slow solvent evaporation and was characterized by X-ray crystallography. The crystal of 1 was stable to moisture or atmosphere, and is soluble in common organic solvents such as dichloromethane, tetrahydrofuran, dimethylsulfoxide, and so on, but insoluble in water. As shown in Fig. 5A, all the carbon/nitrogen atoms in the salicylaldimine moiety of 1 are in the same plane, which results in a possible intramolecular hydrogen bond. Meanwhile, the intermolecular distance of 1 is 5.7 Å (far over 3.8 Å15), which suggest that there is no face-to-face-stacking in the crystal (Fig. 5B). All of these structural features indicated that 1 had the potential of AIE properties originated from the RIR process in the aggregate state.
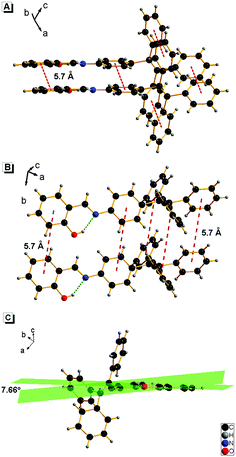 | ||
| Fig. 5 Crystal structure of 1: (A) vertical direction, (B) horizontal direction, and (C) the dihedral angle between the two aromatic rings in the N-salicylideneaniline moiety of 1. | ||
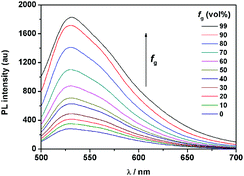
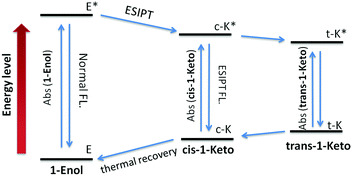
According to the reports, the AIE properties of SA and its analogues originated from RIR and ESIPT processes: on one hand, the intramolecular hydrogen-bond in the salicylaldimine moiety stabilizes the conjugated plane structure, which leads to a possible RIR process.13,16 On the other hand, a fast four-level (E–c-E*–c-K*–K, Fig. 6) cycle occurs immediately after photo excitation of the SA molecule through the intramolecular hydrogen-bond, resulting in an ESIPT fluorescence.10a,17 Thus, when the intramolecular hydrogen-bond was broken, the AIE properties of SA and its analogues should disappear. Control compound 3 containing a methoxy group instead of the phenolic hydroxyl group was synthesized to demonstrate the role of the salicylaldehyde hydrazone moiety in the AIE properties of 1. As shown in Fig. S1 (ESI†), no fluorescence could be detected for 3 both in good and poor solvents. This result clearly demonstrated that the salicylaldehyde hydrazone moiety is indispensable for the AIE properties of 1. In addition, a characteristic large Stokes shift (176 nm) could be observed in compound 1 (Fig. 2), which is larger than that of the reported TPE monomer (about 60 nm12), suggesting a reasonable ESIPT process.10c,18 Therefore, the ESIPT process is another main cause for the AIE effect of 1 besides the RIR process. Interestingly, compound 1 exhibits unique stability in its trans-keto form compared with conventional ESIPT molecules,17,19 which make it a potential photochromic material. The photochromic properties of 1 will be further discussed in the following sections.
3.3 The reversible photochromic properties of 1
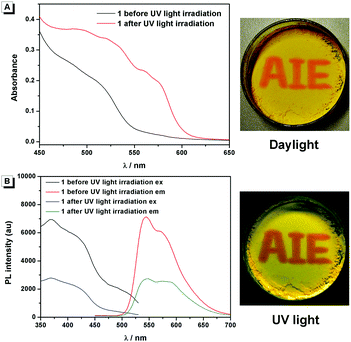
Compound 1 was supposed to exhibit reversible photochromic properties based on our design in Scheme 1, which was characterized and supported by ultraviolet-visible diffuse reflectance spectra (UV-DRS) and fluorescence spectra. As shown in Fig. 7 and Video S1 (ESI†), 1 was yellow and there was no absorption band above 550 nm before UV light irradiation. It turned red and exhibited a broad absorption band from 450 nm to 600 nm after UV light irradiation. When the UV light was removed, compound 1 restored to its original state gradually. In contrast, as can be seen in Fig. 7B, the fluorescence emission of 1 around 545 nm was intense before UV light irradiation (fluorescence quantum yields φ = 4.88%), while it decreased significantly after UV light irradiation (φ = 2.03%). The fluorescence of UV-irradiated 1 also gradually recovered in the dark.These photochromic properties of 1 might be attributed to the tautomerism of salicylaldehyde hydrazone from its enol-form (1-Enol) to its trans-keto-form (trans-1-Keto) (Scheme 2). To support this hypothesis, the photo-response performance of control compounds 2 and 3 was measured. As shown in Fig. S2 (ESI†), compound 2 exhibited similar photochromic properties to 1 due to its salicylaldehyde hydrazone structure: the UV light irradiation turned compound 2 from 2-Enol to trans-2-Keto.9 In contrast, compound 3 exhibited no photochromic properties in the absence of the salicylaldehyde hydrazone moiety. Therefore, it could be deduced that the salicylaldehyde hydrazone moiety of 1 was indispensable for its photochromic properties.
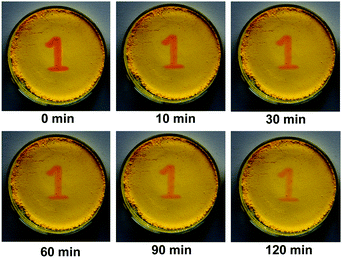
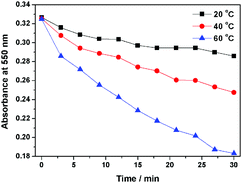
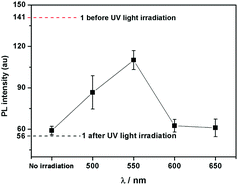
Interestingly, compound 1 exhibits a tunable thermal bleaching rate. At room temperature without light, the patterns recorded on the film of 1 can stay for hours (Fig. 8). Elevated temperature would accelerate the conversion from trans-1-Keto back to 1-Enol (Fig. 9). The light source to promote the photochromism of 1 was investigated, which is at least in the range from 365 nm to 475 nm (Table S1, ESI†). Light with longer wavelength will not promote the photochromism process but even accelerate the recovery rate. As shown in Video S1 (ESI†), the letters were printed in a film of 1 by a household laser point. After being irradiated by visible light for about 10 s, the letters on the film could be erased completely. The effect of light irradiation intensity and wavelength on the recovery rate was investigated and the results are shown in Fig. 10 and Table S1 (ESI†). The fluorescence intensity of 1 at 545 nm before and after excess UV light irradiation is 141 and 56, respectively. After keeping 1 in the dark for 1 min, the intensity increased to 59. When the recovery experiments were carried out under visible light of 500, 550, 600 and 650 nm (light irradiation intensity was about 2 mW cm−2), the intensity reached 87, 110, 62 and 61, respectively. (To ensure the veracity, all of the measurements were repeated 3 times). It can be seen that the visible light around 550 nm will accelerate the recovery rate most effectively. These results are consistent with the reported ones.20
According to the reports,9,20a,21 the transformation between the cis-keto form and the trans-keto form is the major cause of the high stability of UV-irradiated salicylaldehyde hydrazone derivatives. To investigate the configuration of UV-irradiated 1, the photochromic properties of 1 in different organic solvents (dispersed state) were investigated first. As shown in Fig. S3 (ESI†), compound 1 exhibited no photochromic properties in its dispersed state, which suggested that the aggregation of the molecule is indispensable to the stability of UV-irradiated 1: since there is no steric hindrance in the dispersed state, 1 is more inclined to exist as a lower energy state of the cis-keto-form by thermal motion, which can easily transform to its enol-form. In the aggregated state, however, the steric hindrance of contiguous molecules will limit the conformational change, which is beneficial for the stability of the trans-keto-form. Therefore, UV-irradiated 1 should be transformed in the aggregation state. The trans-to-cis transformation is the rate determining step for the recovery reaction. This is why UV-irradiated 1 can persist for hours at room temperature in the dark (Fig. 8).
The crystalline packing of molecules has an important effect on their optical properties. According to the reports, salicylaldehyde hydrazone can be classified into two categories, i.e., thermochromic molecules and photochromic molecules.20b,22 The thermochromic molecules were usually observed as planar structures that are closely packed in the crystal lattice. The dihedral angle between the two aromatic rings is smaller than 25°. In contrast, the photochromic molecules were usually found as twisted structures with long intermolecular distances, and the dihedral angle between the two aromatic rings is larger than 25°.22c,23 Interestingly, 1 exhibited typical photochromic but not obvious thermochromic properties, although the dihedral angle between the two aromatic rings in 1 is 7.66° (Fig. 5), which is much smaller than 25°. This uncommon phenomenon can be attributed to the loose packing of the TPE moiety, which enlarged the intermolecular distance effectively. This packing is beneficial to the isomerization from the cis-keto to trans-keto form under light irradiation.
It is known that the carbonyl moiety in trans-1-Keto is an efficient fluorescence quencher due to its strong electron-withdrawing properties.11 Therefore, the fluorescence intensity of trans-1-Keto was much weaker than that of 1-Enol. Furthermore, the absorbance of trans-1-Keto at 450–600 nm is significantly higher than that of 1-Enol (Fig. 7A). Therefore, the self-absorption of trans-1-Keto is another reason for its weaker fluorescence intensity.
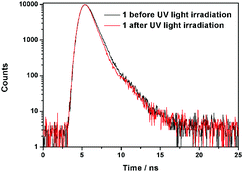
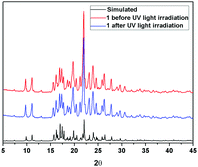
Further information about the fluorescence change of 1 was obtained from fluorescence dynamics measurements (Fig. 11). The fluorescence lifetime (τ) of 1 before UV light irradiation is 0.83 ns, which is analogous to that of 1 after UV light irradiation (0.75 ns). The radiative decay rate constant (kr) and the non-radiative decay rate constant (knr) were calculated according to the definition of τ = 1/(kr + knr) and φ = kr/(kr + knr).24 Before UV light irradiation, kr and knr of 1 were 5.88 × 10⁷ s−1 and 1.15 × 10⁹ s−1, respectively, while kr reduced to 2.57 × 10⁷ s−1 and knr barely changed (1.23 × 10⁹ s−1) after UV light irradiation. The analogous non-radiative decay processes of 1-Enol and trans-1-Keto suggest their similar microstructure in the solid state. To confirm this assumption, X-ray powder diffraction (XRD) of 1 before and after UV light irradiation was carried out (Fig. 12). It can be seen that the XRD spectra of 1 before and after UV light irradiation were almost the same, which suggest their analogous crystal structures.
To gain further insight into their photochromic properties, the calculations were performed on 1-Enol, cis-1-Keto and trans-1-Keto using the Gaussian 09 program. The geometries were optimized with the RM062X hybrid density function and the basis set used was 6-31+G(d,p). Theoretically, the energy gap between the HOMO and the LUMO (EHL) is correlated with the absorption wavelength: a smaller EHL enables the electron transit easier, resulting in a red-shift of the absorption wavelength.25 As shown in Fig. 13, the EHL of 1-Enol is 5.53 eV and the EHL of trans-1-Keto is 4.97 eV. These calculated results agree well with the red-shifted absorption wavelength obtained from experiments (Fig. 7A). Meanwhile, compared with 1-Enol, the HOMO and LUMO of cis-1-Keto and trans-1-Keto distributed mainly in the area near the carbonyl moiety, which visually demonstrated the electron-withdrawing properties of the carbonyl moiety. In addition, the total energy (sum of electronic and zero-point energies) of cis-1-Keto and trans-1-Keto was calculated to be −38137.6774 eV and −38137.2176 eV, respectively. The higher total energy of trans-1-Keto indicates that the trans-form is a metastable form of UV-irradiated 1. 1 is more inclined to exist as a lower energy state of cis-1-keto in the dispersed state, which can easily transform into 1-Enol. Thus, the photochromic properties are difficult to be observed in the dispersed state. Meanwhile, the total energy of cis-1-Keto and trans-1-Keto is both higher than that of 1-Enol (−38137.9985 eV), suggesting that the compound has gained energy from UV light after irradiation.
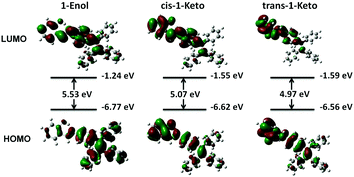 | ||
| Fig. 13 Frontier molecular orbital amplitude plots and energy levels of the HOMOs and the LUMOs of 1-Enol, cis-1-Keto and trans-1-Keto. The value of contour envelopes is 0.02 a.u. | ||
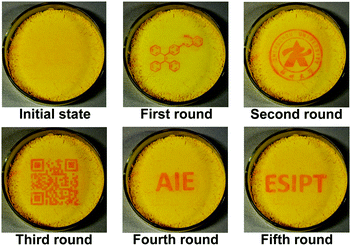
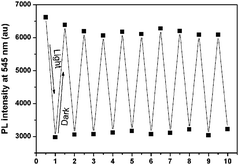
As a reversible photochromic material, 1 was capable of serving as a material for photo-patterning with erasable properties. As shown in Fig. 14, letters, 2-dimensional bar codes and other patterns could be recorded on the same film of 1. The process was rather simple as discussed below. The pre-organized pattern was printed for the first time in transparencies, then the UV light was allowed to pass through it onto the film of 1 and the pattern was subsequently recorded. Other patterns could be recorded on the same film after the former pattern disappeared gradually in the dark or was erased quickly by long wavelength light irradiation. The fatigue resistance of 1 was investigated by toggling repeatedly between 1-Enol and trans-1-Keto 10 times. As shown in Fig. 15, the fluorescence at 545 nm remained almost constant without degradation, indicating a good fatigue resistance of 1. The reversible, controllable photochromic properties as well as the good fatigue resistance of 1 indicate that it can serve as a promising solid material for erasable photo-patterning.
In conclusion, a specially designed AIE molecule of 1 connecting TPE and SA moieties has been developed. Compound 1 exhibits typical AIE properties due to RIR and ESIPT processes. Compared with the TPE monomer, compound 1 has a longer fluorescence emission wavelength of 545 nm and a larger Stokes shift of 176 nm. As a photochromic molecule, compound 1 shows reversible color and fluorescence changes upon UV light irradiation. More importantly, the recovery rate from trans-1-Keto back to 1-Enol is controllable by temperature and long wavelength light irradiation. 1 also shows good fatigue resistance, which makes it an excellent candidate for photo-patterning with erasable properties. Compared with the conventional caged photo-activatable system, the photo-induced redox system and the photo-induced cyclization system, this work provides a brand new strategy in the design of reversible photo-controllable luminescence systems.
Acknowledgements
This research was supported by the National Natural Science Foundation of China (No. 21501150, 51502079, 21371155) and the Outstanding Young Talent Research Fund of Zhengzhou University (1521316005). We are grateful for the helpful advice for our experiments from Benzhong Tang's lab of HKUST.Notes and references
-
(a) S. M. Borisov and O. S. Wolfbeis, Chem. Rev., 2008, 108, 423 CrossRef CAS PubMed
; (b) Z. Chi, X. Zhang, B. Xu, X. Zhou, C. Ma, Y. Zhang, S. Liu and J. Xu, Chem. Soc. Rev., 2012, 41, 3878 RSC
; (c) L. Ying, C. L. Ho, H. Wu, Y. Cao and W. Y. Wong, Adv. Mater., 2014, 26, 2459 CrossRef CAS PubMed
; (d) Y. Tao, K. Yuan, T. Chen, P. Xu, H. Li, R. Chen, C. Zheng, L. Zhang and W. Huang, Adv. Mater., 2014, 26, 7930 CrossRef
.
- R. Hu, N. N. L. Leung and B. Z. Tang, Chem. Soc. Rev., 2014, 43, 4494 RSC
.
- J. Luo, Z. Xie, J. W. Y. Lam, L. Cheng, H. Chen, C. Qiu, H. S. Kwok, X. Zhan, Y. Liu, D. Zhu and B. Z. Tang, Chem. Commun., 2001, 1740 RSC
.
-
(a) D. Ding, K. Li, B. Liu and B. Z. Tang, Acc. Chem. Res., 2013, 46, 2441 CrossRef CAS PubMed
; (b) R. Hu, L. Nelson L C and B. Z. Tang, Chem. Soc. Rev., 2014, 43, 4494 RSC
; (c) Z. Zhao, B. He and B. Z. Tang, Chem. Sci., 2015, 6, 5347 RSC
.
- C. Y. Y. Yu, R. T. K. Kwok, J. Mei, Y. Hong, S. Chen, J. W. Y. Lam and B. Z. Tang, Chem. Commun., 2014, 50, 8134 RSC
.
- L. Peng, Y. Zheng, X. Wang, A. Tong and Y. Xiang, Chem. – Eur. J., 2015, 21, 4326 CrossRef CAS PubMed
.
-
(a) T. Kobayashi, T. Komatsu, M. Kamiya, C. Campos, M. Gonzalez-Gaitan, T. Terai, K. Hanaoka, T. Nagano and Y. Urano, J. Am. Chem. Soc., 2012, 134, 11153 CrossRef CAS PubMed
; (b) A. Rodrigues Correia, M. M. W. Xenia and A. Heckel, Org. Lett., 2013, 15, 5500 CrossRef CAS PubMed
.
-
(a) X. Gu, E. Zhao, J. W. Y. Lam, Q. Peng, Y. Xie, Y. Zhang, K. S. Wong, H. H. Y. Sung, I. D. Williams and B. Z. Tang, Adv. Mater., 2015, 27, 7093 CrossRef CAS PubMed
; (b) D. Ou, T. Yu, Z. Yang, T. Luan, Z. Mao, Y. Zhang, S. Liu, J. Xu, Z. Chi and M. R. Bryce, Chem. Sci., 2016, 7, 5302 RSC
; (c) X. Gu, E. Zhao, T. Zhao, M. Kang, C. Gui, J. W. Y. Lam, S. Du, M. M. T. Loy and B. Z. Tang, Adv. Mater., 2016, 28, 5064 CrossRef CAS PubMed
.
- E. Hadjoudis and I. M. Mavridis, Chem. Soc. Rev., 2004, 33, 579 CAS
.
-
(a) M. Sliwa, N. Mouton, C. Ruckebusch, S. p. Aloïse, O. Poizat, G. Buntinx, R. Métivier, K. Nakatani, H. Masuhara and T. Asahi, J. Phys. Chem. C, 2009, 113, 11959 CrossRef CAS
; (b) J. Zhao, S. Ji, Y. Chen, H. Guo and P. Yang, Phys. Chem. Chem. Phys., 2012, 14, 8803 RSC
; (c) V. S. Padalkar and S. Shu, Chem. Soc. Rev., 2015, 45, 169 RSC
; (d) L. McDonald, J. Wang, N. Alexander, H. Li, T. Liu and Y. Pang, J. Phys. Chem. B, 2016, 120, 766 CrossRef CAS PubMed
.
- N. E. Schore and N. J. Turro, J. Am. Chem. Soc., 1975, 97, 2482 CrossRef CAS
.
- H. Yuan, K. Wang, K. Yang, B. Liu and B. Zou, J. Phys. Chem. Lett., 2014, 5, 2968 CrossRef CAS PubMed
.
- W. Tang, Y. Xiang and A. Tong, J. Org. Chem., 2009, 74, 2163 CrossRef CAS PubMed
.
-
(a) J. Chen, C. C. W. Law, J. W. Y. Lam, Y. Dong, S. M. F. Lo, I. D. Williams, D. Zhu and B. Z. Tang, Chem. Mater., 2003, 15, 1535 CrossRef CAS
; (b) A. Qin, J. W. Y. Lam, F. Mahtab, C. K. W. Jim, L. Tang, J. Sun, H. H. Y. Sung, I. D. Williams and B. Z. Tang, Appl. Phys. Lett., 2009, 94, 253308 CrossRef
; (c) J. Shi, N. Chang, C. Li, J. Mei, C. Deng, X. Luo, Z. Liu, Z. Bo, Y. Q. Dong and B. Z. Tang, Chem. Commun., 2012, 48, 10675 RSC
; (d) J. Mei, Y. Hong, J. W. Y. Lam, A. Qin, Y. Tang and B. Z. Tang, Adv. Mater., 2014, 26, 5429 CrossRef CAS PubMed
.
- C. Janiak, J. Chem. Soc., Dalton Trans., 2000, 3885 RSC
.
- Q. Feng, Y. Li, L. Wang, C. Li, J. Wang, Y. Liu, K. Li and H. Hou, Chem. Commun., 2016, 52, 3123 RSC
.
- M. Ziółek, J. Kubicki, A. Maciejewski, R. Naskręcki and A. Grabowska, Phys. Chem. Chem. Phys., 2004, 6, 4682 RSC
.
- J. Zhao, S. Ji, Y. Chen, H. Guo and P. Yang, Phys. Chem. Chem. Phys., 2011, 14, 8803 RSC
.
- M. Ziółek, J. Kubicki, A. Maciejewski, R. Naskrȩcki and A. Grabowska, Chem. Phys. Lett., 2003, 369, 80 CrossRef
.
-
(a) H. Koshima, K. Takechi, H. Uchimoto, M. Shiro and D. Hashizume, Chem. Commun., 2011, 47, 11423 RSC
; (b) F. Robert, P. L. Jacquemin, B. Tinant and Y. Garcia, CrystEngComm, 2012, 14, 4396 RSC
.
- F. Robert, A. D. Naik, F. Hidara, B. Tinant, R. Robiette, J. Wouters and Y. Garcia, Eur. J. Org. Chem., 2010, 621 CrossRef CAS
.
-
(a) K. Ogawa, Y. Kasahara, Y. Ohtani and J. Harada, J. Am. Chem. Soc., 1998, 120, 7107 CrossRef CAS
; (b) X. T. Chen, Y. Xiang, P. S. Song, R. R. Wei, Z. J. Zhou, K. Li and A. J. Tong, J. Lumin., 2011, 131, 1453 CrossRef CAS
; (c) M. Avadanei, V. Cozan, S. Shova and J. A. Paixão, Chem. Phys., 2014, 444, 43 CrossRef CAS
.
-
(a) F. Robert, A. D. Naik, B. Tinant, R. Robiette and Y. Garcia, Chem. – Eur. J., 2009, 15, 4327 CrossRef CAS PubMed
; (b) F. Robert, A. D. Naik, F. Hidara, B. Tinant, R. Robiette, J. Wouters and Y. Garcia, Eur. J. Org. Chem., 2010, 621 CrossRef CAS
.
- Z. Chang, L. Jing, C. Wei, Y. Dong, Y. Ye, Y. Zhao and J. Wang, Chem. – Eur. J., 2015, 21, 8504 CrossRef CAS PubMed
.
-
(a) B. Li, J. Wang, H. Wen, L. Shi and Z. Chen, J. Am. Chem. Soc., 2012, 134, 16059 CrossRef CAS PubMed
; (b) F. Hu, M. Cao, X. Ma, S. Liu and J. Yin, J. Org. Chem., 2015, 80, 7830 CrossRef CAS PubMed
; (c) C. T. Poon, W. H. Lam, H. L. Wong and V. W. Yam, Chem. – Eur. J., 2015, 21, 2182 CrossRef CAS PubMed
.
Footnote |
| † Electronic supplementary information (ESI) available: Selected spectra and data referred to in the paper; detailed crystal data and structural refinement for 1. CCDC 1472291. For ESI and crystallographic data in CIF or other electronic format see DOI: 10.1039/c6tc03791g |
| This journal is © The Royal Society of Chemistry 2017 |


