DOI:
10.1039/C8NJ06432F
(Paper)
New J. Chem., 2019,
43, 5363-5373
Modified acrylamide copolymers based on β-cyclodextrin and twin-tail structures for enhanced oil recovery through host–guest interactions†
Received
20th December 2018
, Accepted 2nd March 2019
First published on 15th March 2019
Abstract
β-Cyclodextrin has attracted considerable attention due to its unique structure with a hydrophobic cavity and a hydrophilic rim, allowing hydrophobic guest molecules to enter the hydrophobic cavity from aqueous solution to form stable host–guest inclusions. Based on this, two kinds of copolymers with host–guest interaction based on modified β-cyclodextrin and hydrophobic twin-tail structures, which are expected to be alternatives to currently used copolymers in the oil field, were successfully synthesized via free-radical copolymerization in this study. Subsequently, the copolymers were characterized by FT-IR, 1H NMR, SEM and TG-DTG to confirm that they were prepared successfully and exhibited favorable thermal stability. Furthermore, the copolymers could enormously increase the viscosity of the aqueous solution compared with partially hydrolyzed polyacrylamide. And static experiments have convincingly proved that the β-cyclodextrin and twin-tail structure endowed the copolymers with excellent shear resistance, temperature resistance, salt tolerance, and viscoelasticity. Core flooding experiments further indicated that this unique type of host–guest interaction can make the copolymers have great potential for enhanced oil recovery.
Introduction
Nowadays, chemical additives such as surfactants and polymers are widely used in tertiary oil recovery in some oil fields.1 Therein, the addition of polymers to a flooding system can significantly increase the apparent viscosity of the displacement fluid to reduce the water–oil mobility ratio,2,3 alleviate the turbulence of the displacement fluid,4 and improve the distribution ratio of water in the vertical direction,5,6 thereby enhancing oil recovery (EOR). Therefore, for a polymer-based flooding system, the apparent viscosity of the solution is a key factor affecting the flooding efficiency.7–9 The apparent viscosity of the polymer system is related to the structure of its molecular chains.10 Generally, the longer the polymer chains are, the more branched chains are in the molecular chains, and the stronger the ability of the polymer chains to bind water when dissolved in water, the higher the apparent viscosity of the solution system will be.11–13
In a polymer flooding system, the most commonly used auxiliaries for enhanced oil recovery are polyacrylamide (PAM) and partially hydrolyzed polyacrylamide (HPAM).14,15 However, PAM and HPAM are not only greatly affected by the high shear rate, but also seriously hydrolyzed at high temperature (>70 °C) and high salinity, which will significantly reduce the apparent viscosity and make it difficult for them to meet the construction requirements of the oil field.16–19 In recent years, numerous studies have shown that copolymers with host–guest interaction can effectively enhance the stability of the copolymer.20–23 The host–guest interaction refers to the selective binding of the host molecule to the guest molecule, which does not rely on the traditional covalent bond interaction but on the non-covalent bond interaction to maintain the association behavior between the host and guest molecules.24,25 The interaction enables the copolymer to form a crosslinked structure through the association between the host and the guest, so that the viscosity of the copolymer solution increases rapidly and exhibits unique rheological properties.26,27
Cyclodextrins (α-CD, β-CD, and γ-CD) consisting of six, seven and eight glucose units respectively, have different cavity sizes.28 Among them, β-CD is widely used due to its suitable cavity and low production cost. β-CD is a torus-shaped cyclic oligomer consisting of seven glucose units linked by 1,4-α-glucosidic bonds.29 The hydrophobic interior cavity of β-CD can selectively incorporate the hydrophobic molecules of appropriate size to form stable host–guest inclusions.30–32 The unique structure involves various non-covalent interactions including hydrophobicity, electrostatic forces, van der Waals forces, dipole–dipole interactions, and hydrogen bonding.33 Pu et al. reported a β-cyclodextrin/adamantane modified copolymer that exhibited excellent rheological properties.34 Zou et al. reported that the β-cyclodextrin-functionalized hydrophobically associating acrylamide copolymer enhanced the salt-resistance behavior.35 Preliminary studies have proved that the introduction of β-CD into the molecular chains leads to overall performance superior to HPAM. On the other hand, hydrophobically associating copolymers with twin-tailed structures can exhibit significantly different properties from conventional hydrophobically associating copolymers.36–38 In aqueous solution, when the copolymer concentration is higher than the critical association concentration, the hydrophobic twin-tailed groups aggregate to form a reversible intermolecular association structure, thereby remarkably improving the association ability.39–41 In tertiary oil recovery, the introduction of the hydrophobic twin-tailed groups can greatly change the rheological properties of the copolymer to reduce the water–oil mobility ratio and improve the sweep efficiency.42,43 Although introducing β-CD and hydrophobic twin-tailed groups simultaneously into acrylamide copolymers seems to be a potential way to prepare chemically robust copolymers, reports on synthesizing β-CD and twin-tailed modified copolymers for EOR are rare.
In this work, we synthesized two novel hydrophobically modified polyacrylamide copolymers (Poly-A and Poly-B) containing β-CD and a hydrophobic twin-tail structure via free-radical copolymerization. The structure of the copolymers was characterized by Fourier transform infrared spectroscopy (FT-IR) and 1H nuclear magnetic resonance spectroscopy (1H NMR). The microscopic morphology of the copolymers was viewed using a scanning electron microscope (SEM). The thermal stability of the copolymers was determined by thermal gravimetric analysis (TG-DTG). The solution properties of Poly-A and Poly-B including thickening ability, water solubility, temperature resistance, shear resistance, salt tolerance, antiaging performance, and viscoelasticity were evaluated. Furthermore, core flooding experiments were carried out to assess the displacement performances of Poly-A and Poly-B.
Experimental
Materials
The chemicals, acrylamide (AM), acrylic acid (AA), polyoxyethylene octylphenol ether (OP-10), sodium hydrogen sulfite (NaHSO3), ammonium persulfate ((NH4)2S2O8), di-n-octylamine, dibutylamine, triethylamine, methacryloyl chloride, β-cyclodextrin, p-toluenesulfonyl chloride, dichloromethane, acryloyl chloride, ethylenediamine, acryloyl chloride, acetone, ethanol, sodium carbonate, anhydrous sodium sulfate, and ammonia chloride were of analytical reagent grade and used directly without further purification, and all reagents were purchased from Chengdu Kelong Chemical Reagent Factory in China. HPAM (Mn = 5.0 × 10⁶) was obtained from Daqing Refining and Chemical Company. Twin-tailed hydrophobic monomers (DLMA and DLMB) and modified β-CD monomer (O-β-CD) were prepared according to the synthetic methods reported in the literature with some modification44,45 (the concrete steps of the synthesis are provided in the ESI†).
Synthesis of copolymers
Poly-A was prepared by the following steps: certain amounts of DLMA, O-β-CD, OP-10 and deionized water were added into a 250 mL three-neck flask under constant stirring at 45 °C for about 30 min. Afterwards monomers including AM and AA were added sequentially to the previously mixed solution with adjusting pH to a certain value with 1.0 mol L−1 NaOH solution. In order to remove the residual oxygen in the reaction system, a stream of nitrogen was bubbled for 15 min, and a certain amount of NaHSO3 and (NH4)2S2O8 initiator (a molar ratio of 1![[thin space (1/6-em)]](https://www.rsc.org/images/entities/char_2009.gif) :
:![[thin space (1/6-em)]](https://www.rsc.org/images/entities/char_2009.gif) 1) was put into the reaction solution under constant stirring under the protection of nitrogen for 10 min. The reaction was maintained in the resulting solution at an indicated temperature for 8 hours. The copolymer obtained was washed with absolute ethanol, crushed and dried at 60 °C in a vacuum for 24 h to obtain the corresponding product.
1) was put into the reaction solution under constant stirring under the protection of nitrogen for 10 min. The reaction was maintained in the resulting solution at an indicated temperature for 8 hours. The copolymer obtained was washed with absolute ethanol, crushed and dried at 60 °C in a vacuum for 24 h to obtain the corresponding product.
Poly-B was synthesized using similar steps. The synthetic routes to Poly-A and Poly-B are shown in Scheme 1.
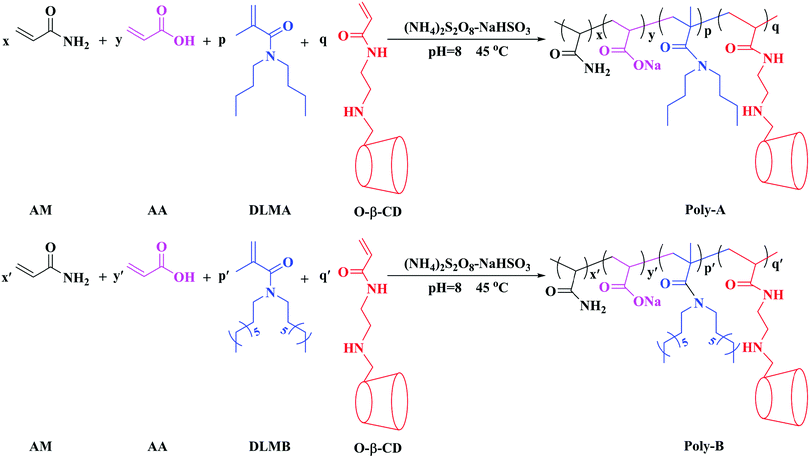 |
| | Scheme 1 The synthetic routes to Poly-A and Poly-B. | |
Characterization
FT-IR spectra of the copolymers were obtained using a WQF-520A Flourier Transform Infrared spectrophotometer (Beijing Beifen-Ruili Analytical Instrument Co., Ltd, China) with KBr pellets in the optical range of 4000–400 cm−1 by averaging 32 scans at room temperature. 1H-NMR spectra of the copolymers were obtained using a Bruker AVANCE III 400 MHz NMR spectrometer (Bruker, Switzerland) in D2O. A thermal analyzer (METTLER TOLEDO Co., Switzerland) was used to analyze the thermal stability of the copolymer by changing the temperature from 40 to 800 °C at 10 °C min−1 in a nitrogen atmosphere of 0.67 mL s−1. The microscopic morphology of the copolymers was observed using a scanning electron microscope (S-3000 N, Hitachi, Japan). The mobile phase (CH3OH/H2O = 9![[thin space (1/6-em)]](https://www.rsc.org/images/entities/char_2009.gif) :
:![[thin space (1/6-em)]](https://www.rsc.org/images/entities/char_2009.gif) 1) flowed through an ODS chromatographic column (40 °C) with a flow rate of 1.0 mL min−1 from a UV detector (wavelength: 210 nm).
1) flowed through an ODS chromatographic column (40 °C) with a flow rate of 1.0 mL min−1 from a UV detector (wavelength: 210 nm).
Thickening efficiency and water solubility
The thickening efficiency of the copolymer was studied by measuring the apparent viscosity of the copolymer solutions at different concentrations at 25 °C. The copolymer particles (35–40 meshes, 200 mg) were dissolved in 100 mL deionized water and the conductivity of the solution was recorded. The shorter the dissolution time, the more stable the conductivity, indicating that the solubility of the copolymer is better.
Measurement of the intrinsic viscosity
The intrinsic viscosity was measured using an Ubbelohde viscometer (Shanghai Sikeda Scientific Instruments Inc., Shanghai, China) at 30 °C with 1.0 mol L−1 NaCl solution (the data are listed in the ESI†). Eqn (1) and (2) are necessary to calculate the intrinsic viscosity.46| |  | (2) |
where ηsp and [η] are the specific viscosity and the intrinsic viscosity, respectively; t is the flow time for polymer solution, s; t0 is the flow time for 1.0 mol L−1 NaCl solution, s; and C is the concentration of the polymer solution, g mL−1.
Experiments for rheological properties
The rheological properties of the copolymer (0.2 wt%) were measured using a HAAKE MARS III rheometer (Haake Technik Co., Germany) under appropriate conditions. As one of the most used polymers in polymer flooding, HPAM was used for comparison with Poly-A and Poly-B.
Anti-shear behavior and aging properties
The shear thinning behaviors (0–510 s−1 for 30 min) and shear recovery behaviors (from 170 s−1 to 510 s−1 to 170 s−1) of the copolymer were studied at 25 °C. The transformation of each shear rate was carried out for 3 minutes. The aging properties of the copolymer were investigated for 30 days through varying the viscosity of the 0.2 wt% copolymer in the salinity of 5000 mg L−1 (the concentration of Na+ is 4000 mg L−1, and the concentrations of Ca2+ and Mg2+ are 500 mg L−1 and 500 mg L−1, respectively) at 70 °C.
Temperature tolerance and salt tolerance
The temperature tolerance of the copolymer was measured by varying the temperature from 20 to 120 °C at 7.34 s−1 for 1.0 h. And the salt tolerance of the copolymer was tested using halide salts (NaCl, MgCl2 and CaCl2) in different concentrations at 7.34 s−1 and 25 °C.
Viscoelasticity
The viscoelastic properties were illustrated with the elastic modulus (G′) and the viscous modulus (G′′) in the range between 0.001 and 10 Hz with a given stress (1 Pa) at 25 °C.
Core flooding experiment
Six artificial sandstone cores were prepared to study the mobility control ability and the EOR ability of the copolymer, and the basic parameters are listed in Table 1. The composition of synthetic brine used in the experiment is listed in Table 2. The mobility control ability of the copolymer could be investigated using the resistance factor (RF) and the residual resistance factor (RFF). The RF and RRF values were calculated using eqn (3) and (4), respectively.47| |  | (3) |
| |  | (4) |
where Kw is the water phase permeability, mD; Kp is the polymer phase permeability, mD; μw is the water phase viscosity, mPa s; μp is the polymer phase viscosity, mPa s; Kwb and Kwa are the water phase permeability before polymer flooding and the water phase permeability after polymer flooding, respectively, mD.
Table 1 Basic parameters of the sandstone cores in the core flooding experiments
| Core no. |
Diameter (cm) |
Length (cm) |
Volume (cm3) |
Porosity (%) |
Permeability (mD) |
| 1 |
3.795 |
7.034 |
79.64 |
14.68 |
158.4 |
| 2 |
3.792 |
7.052 |
79.53 |
14.15 |
162.8 |
| 3 |
3.791 |
7.032 |
78.98 |
14.32 |
159.3 |
| 4 |
3.796 |
7.028 |
78.95 |
14.26 |
164.4 |
| 5 |
3.793 |
7.044 |
79.32 |
14.22 |
160.2 |
| 6 |
3.790 |
7.018 |
79.24 |
14.55 |
161.6 |
Table 2 Synthetic brine composition
| Inorganic salt concentrations (mg L−1) |
Total concentration |
| NaCl |
CaCl2 |
MgCl2 |
Na2SO4 |
20![[thin space (1/6-em)]](https://www.rsc.org/images/entities/char_2009.gif) 000 000 |
500 |
500 |
100 |
21![[thin space (1/6-em)]](https://www.rsc.org/images/entities/char_2009.gif) 100 100 |
The enhanced oil recovery for polymer flooding was estimated using eqn (5).
where
Et is the oil recovery of the whole flooding process, %;
Ew is the initial water flooding recovery before polymer flooding, %.
Results and discussion
Synthesis and characterization
The effects of the reaction conditions on the apparent viscosity of Poly-A and Poly-B were investigated using a single variable method (see Tables S1 and S2 for details in the ESI†), and the optimal synthesis conditions are listed in Table 3. The structures of Poly-A and Poly-B were determined by FT-IR spectroscopy and 1H NMR spectroscopy.
Table 3 Optimum synthesis conditions for Poly-A and Poly-B
| Copolymer |
Feed ratio (g) |
Tem. (°C) |
pH |
Initiator (g) |
| AM |
AA |
DLMA/DLMB |
O-β-CD |
| Poly-A |
4.0 |
5.0 |
0.7 |
0.3 |
45 |
8 |
0.04 |
| Poly-B |
4.0 |
5.0 |
0.7 |
0.3 |
45 |
8 |
0.04 |
Analysis of FT-IR spectra
The FT-IR spectra of Poly-A and Poly-B shown in Fig. 1 offer significant evidence on the chemical functional groups in materials. For Poly-A, the strong absorption peak at 3421 cm−1 was the stretching vibration peak of the N–H bonds from acrylamide. The peaks at 2932 cm−1, 2861 cm−1 and 1452 cm−1 were the characteristic absorption peaks of –CH2– bonds. The eigen frequency at 1679 cm−1 was assigned to the secondary amide bonds from O-β-CD, indicating that O-β-CD was grafted successfully onto Poly-A. The relative peak of the stretching band at 1611 cm−1 was attributed to –COO− from carboxylate. A sharp absorption peak at 1404 cm−1 was due to the stretching vibrations of the –CH3 groups from DLMA. The peak corresponding to the C–N bonds in DLMA was observed at 1315 cm−1. The characteristic peaks at 1170 cm−1 and 1039 cm−1 were subordinate to the C–O–C bonds and –OH groups from O-β-CD, respectively, which again proved that O-β-CD participated in the polymerization. For Poly-B, all characteristic absorption peaks are similar to those of Poly-A, which proves from the side that both copolymers were successfully synthesized.
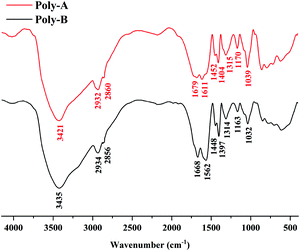 |
| | Fig. 1 FT-IR spectra of Poly-A and Poly-B. | |
Analysis of 1H NMR spectra
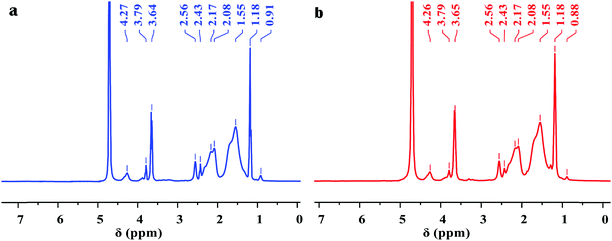
Fig. 2 shows the clear 1H NMR spectra of Poly-A and Poly-B. For Poly-A, the characteristic peaks at 0.91 and 1.18 ppm corresponded to the –CH2–CH3 and –C(CH2)–CH3 protons, respectively. The signal of the protons at 1.55 ppm was assigned to –CH2– groups from the twin-tail structure in DLMA. The chemical shift at 2.08 and 2.17 ppm was associated with –CH2– groups from O-β-CD. The characteristic peaks at approximately 2.43 and 2.56 ppm were attributed to –CH– of the copolymer backbone. The sharp proton peaks at 3.64 and 3.79 ppm were subordinate to –OH of –CH2–OH groups and –CH–OH groups from O-β-CD, respectively. The signal of the protons observed at 4.27 ppm was due to –CH– of –O–CH–O– groups from O-β-CD. Similarly, for Poly-B, all characteristic peaks corresponding to Poly-A are observed in the figure. However, the signal of the protons of –CH2–CH3 from the twin-tail structure was observed at 0.88 ppm, because the longer methylene chain shifted its chemical shift to the high magnetic field. As expected, the FT-IR and 1H NMR spectra confirmed that all monomers were successfully incorporated into the copolymer chain.
 |
| | Fig. 2
1H NMR spectra of copolymers: (a) Poly-A and (b) Poly-B. | |
Analysis of the scanning electron microscopy results
The morphologies of HPAM, Poly-A, and Poly-B were observed by SEM, as shown in Fig. 3. The microcosmic appearance of all the copolymers shows network structures with connected skeletons. Most obviously, the connected skeletons of HPAM are evidently thinner than those of Poly-A and Poly-B. This may be due to the host–guest interactions and the hydrophobic association to strengthen the connection among the molecular chains, resulting in more robust connected skeletons. Furthermore, clear circular cavities can be observed in Fig. 3b and c, which may be attributed to the result of the host–guest interaction between β-CD and the hydrophobic twin-tail structure. In addition, Poly-A has a more regular and obvious cavity structure compared with Poly-B, which may be because the longer hydrophobic chains have a certain shielding effect. However, it is obvious that Poly-B has a denser and more compact network structure, providing the basis for a higher apparent viscosity.
 |
| | Fig. 3 SEM analysis of the copolymer in deionized water: (a) HPAM, magnified 2000 times; (b) Poly-A, magnified 2000 times; (c) Poly-B, magnified 2000 times (copolymer concentration, 2000 mg L−1). | |
Evaluation of thermal stability
The thermal gravimetric curves of Poly-A and Poly-B are shown in Fig. 4, and the weight loss of these two copolymers could be divided into four stages for analysis. As shown in Fig. 4a, the first stage of Poly-A occurred in the range of 40 °C to 370 °C with a mass loss of 22.23%, which was attributed to the moisture evaporation from intramolecular and intermolecular and the decomposition of amide groups. The second stage took place in the range of 370 °C to 420 °C with a mass loss of 4.84%, corresponding to the fracture of carbon–nitrogen bonds. And the third stage occurred with a mass loss of 23.98% from 420 to 528 °C, which was ascribed to the decomposition of the carbon–oxygen and carbon–hydrogen bonds. The last one occurred beyond 528 °C with a mass loss of 12.09%, and this could be due to the carbonization of the copolymer. Likewise, the thermal gravimetric curve of Poly-B observed in Fig. 4b showed a thermal degradation process similar to Poly-A. Besides this, both copolymers have mass retention rates of more than 45%, and Poly-B has higher mass retention rates (47.8%) compared with Poly-A (45.9%). The results indicate that the synthesized copolymers exhibit excellent thermal stability, and they could withstand higher temperatures without thorough pyrolysis.
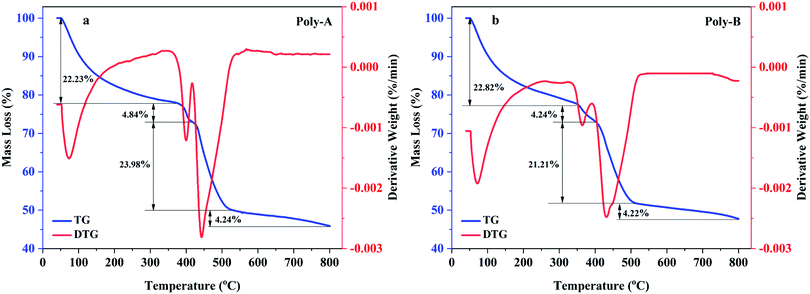 |
| | Fig. 4 TG-DTG curves: (a) Poly-A, (b) Poly-B. | |
Thickening efficiency and water solubility
The displacing fluid with a high apparent viscosity can effectively decrease the water–oil mobility ratio and increase the sweep efficiency of the displacing fluid. Thickening efficiency, as one of the most important properties of copolymers, was studied by measuring the apparent viscosity of HPAM, Poly-A, and Poly-B solution at concentrations 100–2500 mg L−1. As shown in Fig. 5a, the apparent viscosity of HPAM, Poly-A and Poly-B solution showed an exponential growth with the increasing copolymer concentration. Unlike HPAM, Poly-A and Poly-B showed a more prominent thickening efficiency. In particular, in the initial semi-dilute state, the apparent viscosity of HPAM was obviously greater than those of Poly-A and Poly-B, which could be explained by the curling of the polymer chain in virtue of the intramolecular hydrophobic association for Poly-A and Poly-B at a low copolymer concentration. However, Poly-A and Poly-B showed a sharp increase in the apparent viscosity when the concentration of the copolymer solution exceeded 700 mg L−1. The results indicate that Poly-A and Poly-B have a better thickening efficiency compared with HPAM, and the thickening properties could be explained by the following reason: the three-dimensional network formed as a result of hydrophobic association among the copolymer chain could be conducive to the rapid increase in the apparent viscosity with increasing solution concentration.
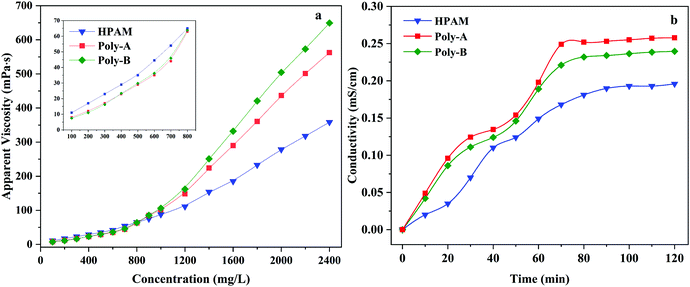 |
| | Fig. 5 (a) Tackifying of copolymers and (b) the dissolution time curves of copolymers. | |
The β-CD and twin-tail structure might influence the water solubility of the copolymer, and excellent solubility can greatly enhance the application prospects of the copolymer in EOR. Based on this, the relationship between the dissolution time and conductivity was thoroughly investigated. As shown in Fig. 5b, it can be obviously found that Poly-A and Poly-B exhibit a higher conductivity value compared with HPAM at the same dissolution time. With the increase of the dissolution time, the stability time observed for the Poly-A (70 min) and Poly-B (78 min) was less than that for HPAM (92 min). That is to say, the higher conductivity value with less time signifies higher water solubility. The shorter dissolution time of Poly-A and Poly-B may be due to the hydrophobic group being embedded in the hydrophobic cavity of β-CD. Moreover, the reason why the dissolution time of Poly-A is shorter than that of Poly-B is there is a longer hydrophobic twin-tail chain in Poly-B.
Shear thinning behavior and shear recovery behavior
Polymers employed in EOR applications should withstand the high shear forces present during the flooding of a reservoir to ensure high apparent viscosity. As illustrated in Fig. 6a, the effect of the shear rate on the apparent viscosity of the copolymers was investigated. It was clearly seen that HPAM, Poly-A and Poly-B solutions showed non-Newtonian shear-thinning behavior from 0 to 510 s−1. With the increase of the shear rate, the apparent viscosity of the copolymer solutions dropped rapidly before 120 s−1; the rate of viscosity reduction was significantly decreased when the shear rate exceeded 120 s−1; and the viscosity change of the copolymer solutions was extremely small in the range of 320 s−1 to 510 s−1. Besides, Poly-A and Poly-B showed a higher viscosity retention value (59.2 and 95.5 mPa s) than that of HPAM (14.3 mPa s) under a shear rate of 510 s−1. This could be because the long hydrophobic chain was introduced into the copolymers, and longer twin-tail chains exhibit better shear resistance.
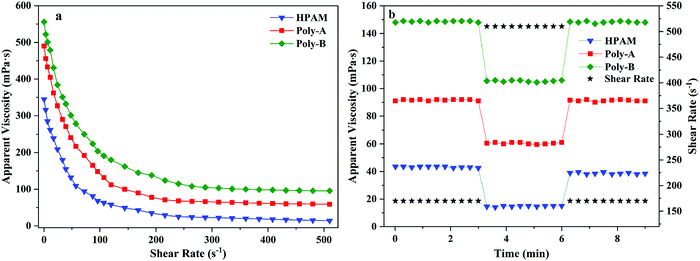 |
| | Fig. 6 (a) Shear thinning behavior of the copolymers and (b) shear recovery of the copolymers. | |
Shear recovery behavior was studied because the molecular structure of the copolymer was easily destroyed at high shear rates for a long time when the flooding fluid was injected into the formation. As shown in Fig. 6b, the apparent viscosity of Poly-A and Poly-B did not decrease severely when the shear rate increased from 170 s−1 to 510 s−1, and then turned back into their original values at 170 s−1. Nevertheless, the apparent viscosity of HPAM dropped significantly (viscosity loss of 12.6%) at the end of a round. The results indicate that Poly-A and Poly-B have excellent shear resistance compared with HPAM owing to the introduction of a rigid molecular structure.
Temperature resistance and aging properties
The formation temperature increases with the increase of formation depth, which will lead to the thermal degradation of the polymer and reduction in apparent viscosity. Polymers with excellent properties should be able to maintain high apparent viscosity at high temperature. Therefore, the temperature resistance of HPAM, Poly-A and Poly-B solutions was obtained by measuring the change in the apparent viscosity from 20 to 120 °C at 7.34 s−1, and the variation tendency is shown in Fig. 7a. It could be clearly seen that the apparent viscosity of the copolymer solutions changed with the increasing test temperature. At the beginning, the apparent viscosity of these copolymers decreased slightly with increasing temperature, and then the rate of decrease was accelerated. Meanwhile, the viscosity retention values of Poly-A (188.4 mPa s) and Poly-B (232.2 mPa s) were significantly higher than that of HPAM (52.4 mPa s), which was attributed to the strong interaction among hydrophobic groups and the strong hydration ability of the β-CD structure within the temperature range. Besides, Poly-A and Poly-B exhibited a process of viscosity increase in the temperature range from 35 to 55 °C as a result of the stretching of the twisted twin-tail chains in the hydrophobic cavity of β-CD with increasing temperature. The results state clearly that Poly-A and Poly-B have superior temperature resistance and could meet high temperature reservoir conditions.
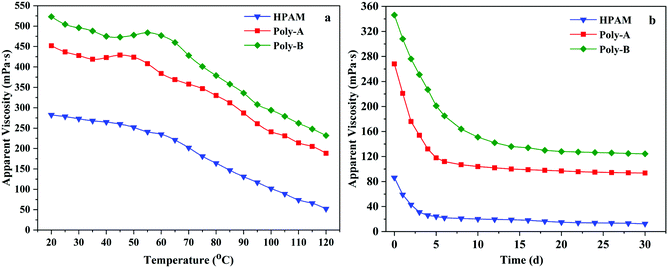 |
| | Fig. 7 (a) Temperature resistance and (b) aging resistance of the copolymers. | |
The long-term stability is another significant performance for flooding fluid that flows in the formation for a long time. Excellent anti-aging properties could make the copolymer solution maintain efficiency at a certain reservoir temperature over a period of time. Based on this, the anti-aging properties of HPAM, Poly-A and Poly-B were investigated, and the results are shown in Fig. 7b. The apparent viscosity of all the copolymers dramatically decreased when they were placed in a water bath for 5 days. The apparent viscosity of all copolymer solutions dropped very slowly at a later time. Compared with HPAM, the viscosity retention values of Poly-A and Poly-B could remain 93.6 mPa s and 124.4 mPa s after 30 days respectively, and it was obviously higher than that of HPAM (12.4 mPa s). It could be due to the existence of the cyclic molecular structure and twin-tail chains which could keep the molecular chains from being hydrolyzed.
Salt resistance
Salt resistance, as another important property, was investigated because of the existence of various inorganic ions in the formation water. Curves demonstrating the relationship between the salinity and the apparent viscosity of the copolymers are illustrated in Fig. 8. The same trend was observed for HPAM and Poly-A, that is, the apparent viscosity of the solutions reduced sharply and then entered a plateau region with the increasing concentration of NaCl, MgCl2 or CaCl2. This is because the apparent viscosity of the copolymer is closely related to the hydrodynamic volume and charge neutralization continually occurring between positive and negative ions with the increasing salinity, resulting in a decrease in the electrostatic repulsion of the molecular chain.48 However, the viscosity retention values of Poly-A are much higher than those of HPAM, which could be attributed to the introduction of β-CD and a twin-tail structure to greatly consolidate the systems’ network structure. The thickening ability of Poly-B is also influenced by the charge shielding effect, causing the decrease of apparent viscosity in the initial stage. Yet when the salinity increased further, the copolymer solution exhibited a salt-thickening effect because the polarity of the solution increased with the increasing salt concentration, resulting in the enhancement of the intermolecular hydrophobic association. Nevertheless, it is remarkably obvious that Poly-A does not show the salt-thickening effect similar to Poly-B, which may be attributed to the fact that Poly-B has longer twin-tail chains. When the salinity was higher and higher, the charge shielding effect once again dominated the influence on apparent viscosity. As a result, the apparent viscosity of Poly-B solutions reduced again after the salt-thickening effect. The viscosity retention values of Poly-B are the highest of all samples, suggesting excellent salt resistance for NaCl, MgCl2 and CaCl2.
 |
| | Fig. 8 Salt resistance of copolymers for Na+, Mg2+ and Ca2+. | |
Viscoelasticity
The viscoelastic behavior of the copolymer plays an indispensable and significant role in EOR. The copolymer exhibits a certain pulling force on those small oil blocks in the dead angles of formation under the action of the viscoelasticity. The elastic modulus (G′) shows the stored energy produced by elastic deformation, and the viscous modulus (G′′) shows the consumed energy due to viscous deformation. As shown in Fig. 9, G′ and G′′ of all the samples increased gradually with the increase of frequency, and G′ of all copolymers was greater than G′′ at a low frequency. Meanwhile, Poly-A and Poly-B exhibit G′ and G′′ significantly higher than those of HPAM as a result of the intermolecular chain associations through nonbonding interactions in aqueous solutions. Besides, the characteristic time tc (1/f) could be acquired by the reciprocal of the frequency (f) for all copolymer samples, and a longer tc indicates better elastic efficiency. It could be clearly seen in Fig. 8 that the characteristic time of Poly-A and Poly-B is obviously higher than that of HPAM, indicating that Poly-A and Poly-B exhibited excellent elastic efficiency. The excellent viscoelasticity, especially elasticity, might be conducive to improving the swept area of the displacing fluid to enhance oil recovery in a porous medium.
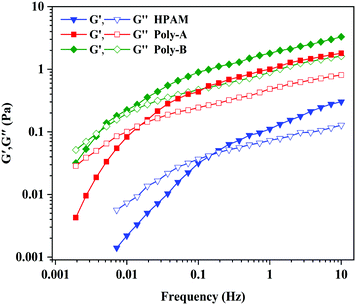 |
| | Fig. 9 Viscoelastic behavior of copolymers. | |
Mobility control ability and polymer flooding for EOR
As shown in Fig. 10, the flow characteristic behavior of HPAM, Poly-A, and Poly-B solutions in porous media is discussed by core flooding experiments. RF is a measure of mobility control capability and provides data about the effective viscosity of the copolymer solutions in porous media. It has been clearly observed that the FR values increased gradually in the injection process of copolymer solution, and Poly-A and Poly-B generated higher RF values compared with HPAM, which indicates that Poly-A and Poly-B have a higher effective viscosity and more outstanding mobility control ability than HPAM in porous media. RRF is an index of the copolymer solution to reduce the permeability of porous media. The higher RRF value signifies a greater reduction in the permeability of the porous media from the oil reservoir, which is beneficial for enhancing oil recovery. The RRF values of Poly-A (11.6) and Poly-B (15.4) were much higher than that of HPAM (2.6) after 2 PV of brine was injected into the cores, indicating a larger retention of Poly-A and Poly-B. The larger retention of Poly-A and Poly-B may be attributed to the introduction of β-CD and a twin-tail structure, which enhanced the retention of molecular chains that were not directly in contact with the rock surfaces.
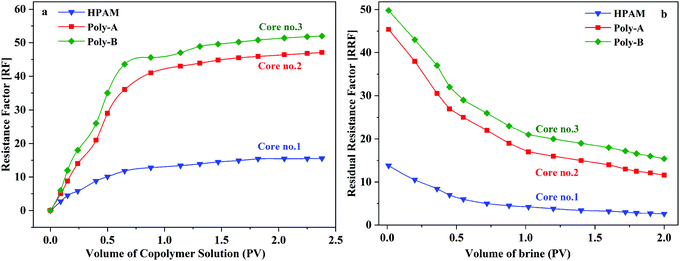 |
| | Fig. 10 Flow behavior of copolymer solutions in porous media (copolymer concentration, 2000 mg L−1; 70 °C). | |
As shown in Fig. 11, core flooding experiments were carried out to evaluate the performance of the copolymers in displacing oil. It has been obviously observed that the water cut gradually decreased after the copolymer solution was injected into the core. Besides, the water cut of Poly-A and Poly-B is significantly lower than that of HPAM, suggesting that Poly-A and Poly-B have more excellent flooding effectiveness than HPAM. More convincing results are provided in Table 4: Poly-A and Poly-B could enhance oil recovery by 8.22% and 8.56%, respectively, which is much more than that of HPAM (3.24%). The results of the core flooding experiments further indicate that Poly-A and Poly-B have potential applications in EOR under harsh reservoir conditions.
 |
| | Fig. 11 Core flooding experiments of polymer flooding (copolymer concentration, 2000 mg L−1; 70 °C). | |
Table 4 Results of the enhanced oil recovery of polymer flooding
| Core no. |
Copolymer |
Copolymer concentration (mg L−1) |
E
w (%) |
E
t (%) |
EOR (%) |
| 4 |
HPAM |
2000 |
47.55 |
50.79 |
3.24 |
| 5 |
Poly-A |
2000 |
49.23 |
57.45 |
8.22 |
| 6 |
Poly-B |
2000 |
49.52 |
58.08 |
8.56 |
Conclusions
With (NH4)2S2O8–NaHSO3 as an initiator, we synthesized two different viscosity-average molecular weights of β-CD modified copolymers (Poly-A and Poly-B) by free-radical copolymerization. The copolymers were characterized by FT-IR and 1H NMR to prove their structure. The microscopic morphology of the copolymers was observed by SEM. TG-DTG provided scientific results for the thermal stability of the copolymers. Furthermore, solution property evaluation experiments indicate that Poly-A and Poly-B have excellent thickening properties, water solubility, shear resistance, temperature resistance, salt tolerance, and viscoelasticity, which are closely related to the existence of host–guest interaction. Poly-A and Poly-B show superior injectivity and could produce a high residual resistance factor and a resistance factor to alter the water cut profile. And even more important, core flooding experiments diametrically demonstrate that Poly-A and Poly-B could enhance oil recovery by 8.22% and 8.56%, respectively. These results state clearly that Poly-A and Poly-B can be excellent candidates for potential applications in EOR. The adaptability of Poly-A and Poly-B to various harsh reservoirs compared with that of other temperature-tolerant and salt-resistant copolymers should be further investigated.
Conflicts of interest
There are no conflicts to declare.
Acknowledgements
This work was financially supported by the Foundation of Youth Science and Technology Innovation Team of Southwest Petroleum University (2017CXTD01), the Support Program of Science and Technology of Sichuan Province (2016GZ0274), and the Open Extracurricular Experiment of Southwest Petroleum University (KSZ17113).
References
- K. C. Tam and E. Wyn-Jones, Chem. Soc. Rev., 2006, 35, 693–709 RSC.
- M. S. Kamal, A. S. Sultan, U. A. Almubaiyedh and I. A. Hussein, Polym. Rev., 2015, 21, 491–530 CrossRef.
- D. A. Z. Wever, F. Picchioni and A. A. Broekhuis, Prog. Polym. Sci., 2011, 36, 1558–1628 CrossRef CAS.
- V. C. Santanna, F. Curbelo, T. C. Dantas, A. D. Neto, H. S. Albuquerque and A. Garnica, J. Pet. Sci. Eng., 2009, 66, 117–120 CrossRef CAS.
- S. H. Gou, T. Yin, K. Liu and Q. P. Guo, New J. Chem., 2015, 39, 215–2161 Search PubMed.
- A. D. Child and J. R. Reynolds, Macromolecules, 1994, 27, 1975–1977 CrossRef CAS.
- A. Rezaei, M. Abdi-Khangah, A. Mohebbi, A. Tatar and A. H. Mohammadi, J. Mol. Liq., 2016, 222, 1148–1156 CrossRef CAS.
- S. Thomas, Oil Gas Sci. Technol., 2008, 63, 9–19 CrossRef CAS.
- M. Bao, Q. Chen, Y. Li and G. Jiang, J. Hazard. Mater., 2010, 184, 105–110 CrossRef CAS PubMed.
- S. F. Chen, J. Zheng, L. Y. Li and S. Y. Jiang, J. Am. Chem. Soc., 2005, 127, 14473–14478 CrossRef CAS PubMed.
- Y. Wang, D. Lu, C. Long, B. Han, H. Yan and J. C. Kwak, Langmuir, 1998, 14, 2050–2054 CrossRef CAS.
- M. S. Karthikeyan, B. S. Holla and N. S. Kumari, Eur. J. Med. Chem., 2007, 42, 30–36 CrossRef CAS PubMed.
- A. N. El-hoshoudy, J. Mol. Liq., 2018, 250, 35–43 CrossRef CAS.
- N. Hameed, J. Liu and Q. Guo, Macromolecules, 2008, 41, 7596–7605 CrossRef CAS.
- B. Lu, X. D. Xu, X. Z. Zhang, S. X. Cheng and R. X. Zhuo, Biomacromolecules, 2008, 9, 2594–2600 CrossRef CAS PubMed.
- C. Zhong, P. Luo, Z. Ye and H. Chen, Polym. Bull., 2009, 62, 79–89 CrossRef CAS.
- K. Liu, Carbohydr. Polym., 2015, 117, 996–1001 CrossRef CAS PubMed.
- S. W. Li, S. H. Gou, L. H. Zhou, Q. Zhang, K. Yang and Y. P. Wu, J. Mol. Liq., 2018, 253, 305–313 CrossRef CAS.
- K. M. Johnson, M. J. Fevola and C. L. Mccormick, J. Appl. Polym. Sci., 2010, 92, 647–657 CrossRef.
- S. Barman, B. K. Barman and M. N. Roy, J. Mol. Struct., 2018, 1155, 503–512 CrossRef CAS.
- A. J. Valente and O. Söderman, Adv. Colloid Interface Sci., 2014, 205, 156–176 CrossRef CAS PubMed.
- X. Ji, S. Dong, P. Wei, D. Xia and F. Huang, Adv. Mater., 2013, 25, 5725–5729 CrossRef CAS PubMed.
- X. Ji, B. Shi, H. Wang, D. Xia, K. Jie, Z. L. Wu and F. Huang, Adv. Mater., 2015, 27, 8062–8066 CrossRef CAS PubMed.
- T. S. Davies, A. M. Ketner and S. R. Raghavan, J. Am. Chem. Soc., 2006, 128, 6669–6675 CrossRef CAS PubMed.
- Y. Yang, L. Liu, X. Huang, X. Tan, T. Luo and W. Li, Soft Matter, 2015, 11, 8848–8855 RSC.
- G. Yu, K. Jie and F. Huang, Chem. Rev., 2015, 115, 7240–7303 CrossRef CAS PubMed.
- A. Celebioglu, Z. I. Yildiz and T. Uyar, Sci. Rep., 2017, 7, 7369–7380 CrossRef PubMed.
- L. Jiang, Y. Yan and J. Huang, Adv. Colloid Interface Sci., 2011, 169, 13–25 CrossRef CAS PubMed.
- V. Derakhshanian and S. Banerjee, Ind. Eng. Chem. Res., 2012, 51, 4463–4465 CrossRef CAS.
- G. Chen and M. Jiang, Chem. Soc. Rev., 2011, 40, 2254–2266 RSC.
- J. Hao, Y. Gao, C. Zheng, J. Liu, J. Hu and Y. Ju, ACS Macro Lett., 2018, 7, 1131–1137 CrossRef CAS.
- T. Miao, S. L. Fenn, P. N. Charron and R. A. Oldinski, Biomacromolecules, 2015, 16, 3740–3750 CrossRef CAS PubMed.
- H. N. Xiao and N. Cezar, J. Colloid Interface Sci., 2005, 283, 406–413 CrossRef CAS PubMed.
- W. F. Pu, Y. Yang, B. Wei and C. Yuan, Ind. Eng. Chem. Res., 2016, 55, 8679–8689 CrossRef CAS.
- C. Zou, P. Zhao, X. Hu, X. Yan, Y. Zhang, X. Wang, R. Song and P. Luo, Energy Fuels, 2013, 27, 2827–2834 CrossRef CAS.
- Y. Zhou, L. Li, W. Chen, D. Li, N. Zhou, J. He, P. Li, Z. Zhang and X. Zhu, Polym. Chem., 2018, 9, 4343–4353 RSC.
- B. Ren, Y. Gao, L. Lu, X. Liu and Z. Tong, Carbohydr. Polym., 2006, 66, 266–273 CrossRef CAS.
- M. S. Bakshi, A. Kaura and R. K. Mahajan, Colloids Surf., A, 2005, 262, 168–174 CrossRef CAS.
- X. Chen, N. Xu, N. Li, L. Lu, Y. Cai and Y. Zhao, Soft Matter, 2013, 9, 1885–1894 RSC.
- M. E. Zeynali, A. Rabii and H. Baharvand, Iran. Polym. J., 2004, 13, 479–484 CAS.
- S. Zhong, D. Lu and X. Liu, J. Dispersion Sci. Technol., 2012, 33, 1163–1166 CrossRef CAS.
- S. H. Smith, R. G. E. Murray and M. Hall, Can. J. Microbiol., 1994, 40, 90–98 CrossRef CAS PubMed.
- B. Huang, X. Fan, G. Wang, Y. Zhang and J. Huang, J. Polym. Sci., Part A: Polym. Chem., 2012, 50, 2444–2451 CrossRef CAS.
- L. Y. Li, W. D. He, J. Li, S. C. Han and X. L. Sun, J. Polym. Sci., Part A: Polym. Chem., 2009, 47, 7066–7077 CrossRef CAS.
- E. Kaya and L. J. Mathias, J. Polym. Sci., Part A: Polym. Chem., 2010, 48, 581–592 CrossRef CAS.
- M. E. Zeynali, A. Rabii and H. Baharvand, Iran. Polym. J., 2004, 13, 479–484 CAS.
- D. A. Wever, F. Picchioni and A. A. Broekhuis, Ind. Eng. Chem. Res., 2013, 52, 16352–16363 CrossRef CAS.
- G. Chalumot, C. Yao, V. Pino and J. L. Anderson, J. Chromatogr. A, 2009, 1216, 5242–5248 CrossRef CAS PubMed.
Footnote |
| † Electronic supplementary information (ESI) available. See DOI: 10.1039/c8nj06432f |
|
| This journal is © The Royal Society of Chemistry and the Centre National de la Recherche Scientifique 2019 |
Click here to see how this site uses Cookies. View our privacy policy here.  *ab,
Qi
Wu
a,
Lihua
Zhou
a,
Huichao
Zhang
a and
Yumei
Fei
a
![[thin space (1/6-em)]](https://www.rsc.org/images/entities/char_2009.gif) :
:![[thin space (1/6-em)]](https://www.rsc.org/images/entities/char_2009.gif) 1) was put into the reaction solution under constant stirring under the protection of nitrogen for 10 min. The reaction was maintained in the resulting solution at an indicated temperature for 8 hours. The copolymer obtained was washed with absolute ethanol, crushed and dried at 60 °C in a vacuum for 24 h to obtain the corresponding product.
1) was put into the reaction solution under constant stirring under the protection of nitrogen for 10 min. The reaction was maintained in the resulting solution at an indicated temperature for 8 hours. The copolymer obtained was washed with absolute ethanol, crushed and dried at 60 °C in a vacuum for 24 h to obtain the corresponding product.
![[thin space (1/6-em)]](https://www.rsc.org/images/entities/char_2009.gif) :
:![[thin space (1/6-em)]](https://www.rsc.org/images/entities/char_2009.gif) 1) flowed through an ODS chromatographic column (40 °C) with a flow rate of 1.0 mL min−1 from a UV detector (wavelength: 210 nm).
1) flowed through an ODS chromatographic column (40 °C) with a flow rate of 1.0 mL min−1 from a UV detector (wavelength: 210 nm).


![[thin space (1/6-em)]](https://www.rsc.org/images/entities/char_2009.gif) 000
000![[thin space (1/6-em)]](https://www.rsc.org/images/entities/char_2009.gif) 100
100


