Efficient removal of metal ions by capacitive deionization with straw waste derived graphitic porous carbon nanosheets†
Hui
Wang‡
ab,
Tingting
Yan‡
a,
Junjie
Shen
c,
Jianping
Zhang
a,
Liyi
Shi
a and
Dengsong
Zhang
 *a
*a
aDepartment of Chemistry, Research Center of Nano Science and Technology, State Key Laboratory of Advanced Special Steel, Shanghai University, Shanghai 200444, P. R. China. E-mail: dszhang@shu.edu.cn
bSchool of Environmental Science and Engineering, Yancheng Institute of Technology, Yancheng, 224051, P. R. China
cDepartment of Chemical Engineering, University of Bath, Bath BA2 7AY, UK
First published on 12th December 2019
Abstract
Capacitive deionization (CDI) is considered to be an energy-efficient and cost-effective technology for ion removal from saline or waste water. However, its implementation remains challenging due to low ion adsorption capacity of the commonly used electrode materials. It is thus desirable to develop highly efficient CDI electrode materials for ion removal. Herein, graphitic porous carbon nanosheets (GPCSs) were originally prepared from straw waste via a combined activation and graphitization process. Being composed of graphitic carbon sheets with abundant pores in the framework, the obtained GPCSs had a large specific surface area and good conductivity and wettability, which can provide sufficient adsorption sites and promote efficient ion transport. The GPCS electrodes presented a higher specific capacitance, good stability and low inner resistance in electrochemical tests. Moreover, the GPCSs showed a high deionization capacity of 19.3 mg g−1 at 1.2 V in a 500 mg L−1 NaCl solution. Repeated adsorption–desorption experiments demonstrated the good regeneration performance of the GPCS electrodes. Furthermore, the removal efficiency towards Cd2+, Ni2+ and Cu2+ of the GPCS electrodes is 91.5%, 97.0% and 100% at 1.2 V in a 100 mg L−1 CdCl2 , NiCl2 or CuCl2 solution, respectively. This work offers a promising solution to efficient removal of ions from saline or waste water and a new route to the utilization of straw waste.
Environmental significanceFresh water scarcity has become one of the greatest critical problems due to the worsening water quality caused by pollution as well as the growing population. Capacitive deionization has been regarded as a promising water treatment technology to obtain fresh water. However, developing highly efficient electrode materials for capacitive deionization remains challenging. Here, a simple and low-cost method was developed to prepare graphene-like hierarchical porous carbon nanosheets (GPCSs) from straw waste as highly efficient electrode materials for capacitive deionization. Significantly, the obtained GPCSs were composed of graphitic carbon sheets with abundant pores in the frameworks. Importantly, the GPCSs exhibited a large specific surface area and good wettability and electronic conductivity. Moreover, the GPCS electrodes showed a high deionization capacity of 19.3 mg g−1 at 1.2 V in a 500 mg L−1 NaCl solution. The removal efficiencies towards Cd2+, Ni2+ and Cu2+ were higher than 90%. Additionally, the electrodes presented good deionization stability. The current work offers a promising solution to efficient removal of ions from saline or waste water and a new route to the utilization of straw waste. |
Introduction
Recently, the shortage of fresh water has become one of the most serious problems around the world due to water pollution and the growing population.1,2 Water desalination proves to be efficient to solve the water crisis, and conventional desalination techniques such as thermal processes and reverse osmosis have been extensively employed to separate ions from water.3,4 However, significant cost and excessive energy consumption restricted the wide application of traditional techniques. Moreover, to obtain fresh water, waste water treatment, especially the deep removal of excess metal ions from water, is also important and challenging. Emerging as a promising water treatment technique, capacitive deionization (CDI) has drawn great attention, and has been used for heavy metal removal, organic pollutant removal, and desalination.5–7 The CDI process is based on the mechanism of an electrical double-layer capacitor. When operated with a low external voltage (<2 V), ions are moved to the oppositely charged electrode and adsorbed onto the electrical double-layer (EDL) formed between the solution and the electrode interface. Once the voltage is removed, the ions adsorbed by the electrodes can be released into the solution immediately. Therefore, CDI provides an energy-saving and environment-friendly method to obtain clean water.8,9As an electrochemical process, the CDI performances are largely determined by the internal structure and physical properties of the electrode materials, such as specific surface area, pore structure, conductivity and wettability.10,11 Till now, various carbon materials such as activated carbon, carbon nanotubes, carbon aerogels, mesoporous carbon and graphene have been widely employed as CDI electrodes.12–17 In particular, graphene with an ultra-high theoretical surface area and conductivity has attracted great interest in the past decade. Li et al. reported that graphene-like nanoflakes showed higher electrosorption capacity than activated carbon.18 However, owing to the π–π interactions and van der Waals force between the planar basal planes, graphene sheets can spontaneously undergo aggregation and restacking, which will largely decrease the accessible surface area for ion adsorption.19,20 Several methods such as intercalation of carbon spheres, carbon nanotubes or other carbon materials and design of three-dimensional structures have been recently investigated to overcome this problem.21,22 However, these new methods are complicated and have high costs and low yields. As a result, graphene-based materials can hardly meet the scale-up requirements for commercial CDI.
In consideration of the above-mentioned problems, it is highly desirable to develop CDI electrode materials through a cost-effective and simple route with the potential for achieving mass production. Biomass, as a low-cost and abundant carbon source, can be easily obtained from forestry and agricultural wastes.23–25 Recently, various biomass materials have been explored as a carbon source, and different strategies were applied to enhance the performance of biomass-derived carbons. For example, Ding et al. used peanut shell derived carbon as the active materials in both the anode and the cathode of a hybrid sodium ion capacitor.23 Wu et al. demonstrated that honeycomb-like porous carbon foam produced from one-step carbonization of alkali-treated wheat flour showed excellent electrochemical performance for supercapacitor electrodes.25 Xie et al. prepared carbon materials from citrus peels through hydrothermal synthesis with ZnCl2.26 Cazetta et al. found that the adsorption capacity of biomass-derived carbon catalyzed by iron was greatly increased.27 Straw is a by-product of agricultural crops, which is abundant in the nature. A large number of wheat straws have been produced annually with the increasing wheat production. However, only small amounts of wheat straws are used as animal feed, and most of them are treated as wastes and cause some environmental problems. Thus, it is highly beneficial to use straw waste as carbon sources and develop simple and easy synthesis routes.
In this study, efficient CDI of saline or waste water was demonstrated by using graphitic porous carbon nanosheets (GPCSs). We provided a novel approach to design and synthesize GPCSs derived from straw waste via a combined activation and graphitization process. The brief synthesis route of the GPCSs is illustrated in Scheme 1. The metal salts ferric chloride (FeCl3) and zinc chloride (ZnCl2) acted as the graphitization catalyst precursor and the activation agent, respectively. They were simultaneously introduced into the straw framework. During the high temperature calcination process, the Zn species as an activation agent introduced plenty of micro- and mesopores to the carbon nanosheets, which resulted in a high specific surface area. Besides, as a graphitization catalyst, Fe compounds in the straw skeleton led to carburized phases, and graphitic nanosheets were formed after the decomposition of the carburized phase in calcination. The GPCSs were obtained after the complete removal of Fe compounds and other impurities. The GPCSs showed remarkable features, such as hierarchical pores, a large surface area and nanosheet structure, which could promote fast salt ion transfer and adsorption during the CDI process. Therefore, we successfully developed a cost-efficient and renewable raw carbon material for high performance CDI.
Experimental section
Chemicals
FeCl3, ZnCl2, CdCl2, NiCl2, CuCl2 and hydrochloric acid (HCl) of analytical grade were purchased from Sinopharm Chemical Reagent Co. Ltd., Shanghai, China. The wheat straw was from Yancheng, Jiangsu, China. Before use, the wheat straw was washed with deionized water and ethanol several times.Synthesis
Pre-carbonization of the wheat straw: 1.5 g wheat straw and 2.5 mL H2SO4 were added into 50 mL H2O and then stirred for 20 min. The above solution was transferred into a Teflon-lined stainless vessel and reacted for 12 h at 180 °C. After cooling to room temperature, the pre-carbonized wheat straw was washed using deionized water until reaching a pH of 7 and further dried at 80 °C in a conventional oven, then the pre-carbonized wheat straw was obtained.Synthesis of GPCSs: 1.0 g pre-carbonized wheat straw and 2.5 g ZnCl2 were immersed in 20 mL of 2.5 M FeCl3 solution. The mixed solution was continuously stirred and evaporated at 80 °C until it became viscous, and dried at 80 °C in a conventional oven. The obtained solid powder was further annealed at 700 °C for 1 h under a N2 atmosphere at a ramp rate of 2 °C min−1. To remove metal species and silica, the obtained black powder was etched with a HCl solution (2 M) and HF solution (10 wt%), and then thoroughly washed with deionized water and dried at 80 °C, finally obtaining the GPCSs. For comparison, pre-carbonized wheat straw annealed without ZnCl2 and FeCl3 was named as porous carbon (PC). Pre-carbonized wheat straw annealed with FeCl3 only was named as catalyzed carbon (CC). Pre-carbonized wheat straw annealed with ZnCl2 only was named as activated porous carbon (APC).
Characterization
The structure and surface properties of the obtained carbon materials were investigated by transmission electron microscopy (TEM), scanning electron microscopy (SEM), X-ray diffraction (XRD), Raman spectroscopy, N2 sorption, and wettability measurements. Besides, the related electrodes were further analysed by cyclic voltammetry (CV), galvanostatic charge–discharge (GC) and electrochemical impedance spectroscopy (EIS). The detailed information of these characterization methods is provided in the ESI.†CDI performance
To fabricate the CDI electrodes, the as-prepared carbon materials (80 wt%) and conductive carbon black (10 wt%) were homogenously mixed with a binder (PTFE, 10 wt%). The mass of active materials is 0.2 g. The above slurry was coated onto graphite sheets and then the electrodes were dried at 110 °C overnight. The size of an electrode is 50 mm × 40 mm × 0.3 mm. The CDI system consists of two electrodes separated by a non-conductive grid spacer (0.27 mm). The CDI experiment was performed at a set voltage with a flow rate of 50 mL min−1 using a peristaltic pump. The NaCl solution conductivity change was monitored with a conductivity meter (Mettler Toledo S400) at the outlet of the cell. The concentration of Cd2+, Ni2+ and Cu2+ was detected using an atomic absorption spectrometer (Persee, TAS900). The salt adsorption capacity (SAC) and salt adsorption rate (SAR) were calculated as below: | (1) |
 | (2) |
Results and discussion
Characterization of structure and micromorphology
The pore structure characteristics of GPCSs, APC, CC and PC were analyzed using nitrogen adsorption–desorption isotherms. As shown in Fig. 1a, all the carbon samples exhibit type-I adsorption–desorption isotherms, indicating a microporous structure.28–30 Moreover, the adsorption isotherms of the samples at low relative pressure increased sharply, which further indicates that micropores dominate the carbon structure. In the inset, a hysteresis loop (0.4 < P/P0 < 1.0) appears on the isotherm of GPCSs, suggesting the coexistence of micropores and mesopores. More interestingly, the isotherms of GPCSs, APC and CC show wider knees than that of PC, suggesting their larger micropore sizes. As calculated, the GPCSs have the highest specific surface area of 2695 m2 g−1 and total pore volume of 1.15 cm3 g−1. APC with only Zn activation has the second highest specific surface (2207 m2 g−1) and the second largest pore volume (0.95 cm3 g−1). CC carbonized only with the Fe catalyst exhibits a lower specific surface area of 1371 m2 g−1 and a smaller pore volume of 0.63 cm3 g−1. PC has the lowest specific surface area of 493 m2 g−1 and the smallest pore volume of 0.24 cm3 g−1. These results indicate that the activation agent ZnCl2 is essential to increase the specific surface area of the GPCSs.31 The pore size distributions deduced by QSDFT are presented in Fig. 1b. Obviously, the GPCSs have enlarged pore sizes of 0.8 nm and 1.2 nm compared to PC (0.5 nm), which benefit from the synergistic activation and catalysis reactions. The excellent pore structure of the GPCSs can provide abundant ion adsorption sites and shorten the ion diffusion path during the CDI process.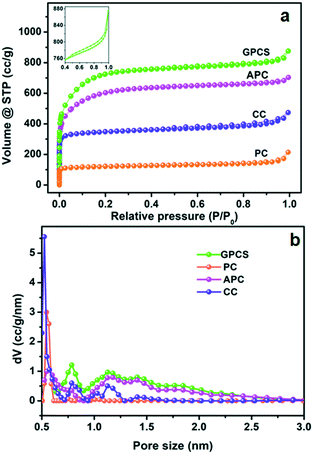 | ||
| Fig. 1 (a) N2 adsorption–desorption isotherms and (b) pore size distributions of the GPCSs, APC, CC and PC. The inset of (a) is the isotherm at 0.4 < P/P0 < 1.0. | ||
As seen from the SEM and TEM images in Fig. 2a and b, the GPCSs present a sheet-like and porous structure. The HRTEM image (Fig. 2c) shows that the GPCSs may be composed of several porous carbon sheets, and a large amount of micropores are distributed on the surface of the carbon sheets. In particular, the edges of GPCSs have no obvious lattice line in the HRTEM image, indicating that the GPCSs also contain some structural defects and lattice disorder, which is beneficial to the rapid electron and ion transport during the CDI process.32 In comparison, the SEM and TEM images of PC, APC and CC (Fig. S1†) show bulk structures without any pores and the sheets are much thicker, suggesting that the synergistic effect of iron catalysis and zinc activation is necessary for the formation of nanosheet structures.33 During the high temperature calcination process, the iron components act as the graphitization catalyst to accelerate the formation of a carburized phase, and the carburized phase reacts with the Zn components. The graphitic porous nanosheet structure of the GPCSs is finally formed with the synergistic activation and catalytic carbonization processes.
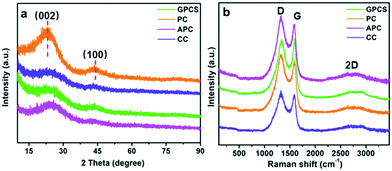
Fig. 3a shows the XRD patterns of GPCSs, APC, CC and PC. These samples have two broad diffraction peaks at 2θ = 24° and 43°, which are similar to those of graphitic carbon. The broad and weak peaks at 24° and 43° correspond to the (002) and (100) reflections of the graphitic-type lattice, which indicate a limited graphitization degree.28 The (002) and (100) diffraction peaks of GPCSs are weaker than those of PC and APC, because the individual graphene layers in the GPCS structure are disorderly arranged. The graphitization degree of the samples was further detected by Raman spectroscopy. The D band (1370 cm−1) corresponding to the disordered structures of carbon and the G band (1570 cm−1) ascribed to graphite in-plane vibrations are observed in Fig. 3b.24,33 The IG/ID ratio of GPCSs (1.01) is higher than those of PC (0.85), APC (0.88), and CC (0.93), indicating that the higher graphitization degree is due to the Fe catalysis. Besides, the GPCSs show a distinct 2D band at 2700 cm−1. The higher graphitization degree of GPCSs means a better electric conductivity, which is beneficial to lowering the inner resistance of the GPCS electrodes.
Dynamic contact angle measurements were further conducted for the GPCSs, APC, CC and PC. The wetting processes are illustrated in Fig. 4. At first, the contact angle of GPCSs is 36.3°, suggesting that the GPCSs exhibit good hydrophilicity. Meanwhile, PC, APC and CC show much larger contact angles (129.0°, 79.8° and 111.7°), which means poor wettability. After 0.5 s, the droplet on the surface of GPCSs disappears and the contact angle decreases to 15.1°. The droplets and contact angles of PC, APC and CC barely change within the same time. The results prove that droplets can be more easily adsorbed by the GPCSs, indicating that the GPCSs have an improved wettability over the other samples.34 According to the XPS and FTIR analysis, the four samples have similar functional groups, but the GPCSs have the lowest oxygen and nitrogen contents (Fig. S2 and S3†). Hence, the improved wettability of GPCSs should be attributed to the abundant pores and sheet-like structure. With better wettability, the GPCSs can have increased accessible channels for metal ions, which is beneficial to the CDI performance.35
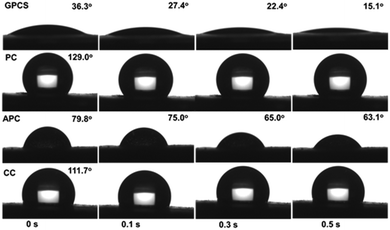 | ||
| Fig. 4 Optical micrographs of water contact angles on the surfaces of the GPCS, PC, APC and CC electrodes as a function of contact time. | ||
Electrochemical performance
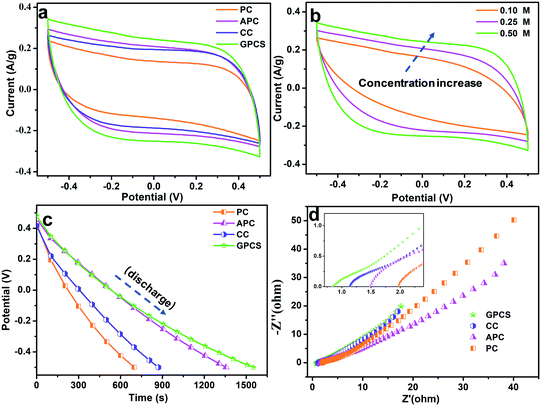
The electrochemical performances of the GPCSs, APC, CC and PC in NaCl solution were analysed to evaluate their CDI performance. As shown in Fig. 5a, the CV curves of the GPCSs, APC, CC and PC demonstrate a rectangular shape, and no redox peak was observed, which is indicative of typical EDLC behavior rather than pseudocapacitive behavior.7,36 Importantly, the GPCS electrodes exhibit a much higher specific capacitance than PC, CC and APC, because the specific capacitance is linearly related to the CV curve area. As calculated, the GPCS electrodes exhibit the highest specific capacitance of 221.9 F g−1 at 1 mV s−1, as compared to the APC, CC and PC electrodes (185.3, 171.7, and 131.2 F g−1). As the scan rate was increased to 10 mV s−1, the CV curves were distorted due to less time for ion transportation and incomplete formation of an EDL at higher scan rates. However, the CV curve area of the GPCS electrodes is still larger than those of PC, APC and CC at 10 mV s−1 (Fig. S4†), indicating that a higher specific capacitance is well maintained. Besides, the GPCSs obtained from calcination at 700 °C shows the highest capacitance as compared to those obtained at other temperatures (Fig. S5†). The 2D sheet-like structure of the GPCSs provide a short ion diffusion distance, resulting in fast ion transportation.37 Additionally, the highest specific surface area and pore volume of the GPCSs increase ion adsorption space and facilitate ion diffusion, so more ions can participate in the formation of an EDL. Besides, the GPCSs with a porous structure have good wettability, which allows salt solutions to easily access the electrode interior. Therefore, the GPCSs exhibit a higher specific capacitance in the CV tests, indicating that they are a promising material for CDI electrodes.The influence of ion concentration on the electrochemical performance of the GPCSs was investigated by the CV tests, and the curves are presented in Fig. 5b. When the salt solution concentration increases from 0.1 to 0.5 M, the area of the CV curves increases accordingly, so the specific capacitance is improved with the increasing concentration. When ions are electrostatically adsorbed at the electrode/solution interface in a high concentration solution, the ionic strength of the solution changes slightly, and a new adsorption equilibrium can be quickly established. In contrast, the weak ionic strength of a low concentration solution results in a longer time for the new adsorption equilibrium formation.38 Moreover, more ions can participate in the EDL forming process in a higher concentration solution, so a higher specific capacitance is easily obtained.15
The galvanostatic charge/discharge experiments of the GPCS, APC, CC and PC electrodes were conducted at 0.2 A g−1, and the discharge curves are shown in Fig. 5c. Obviously, the GPCS electrodes show the longest discharge time as compared to PC, CC and APC, indicating the highest specific capacitance. The enhanced capacitance further demonstrated that the sheet-like structure, higher specific surface area and larger pore volume of GPCSs is beneficial to capacitance increase. Besides, the GC curves are highly linear and symmetrical, indicating the ideal EDL behavior and rapid I–V response.39 The charge–discharge curves remain symmetrical and triangular in shape at different current densities ranging from 0.2 to 1.0 A g−1, suggesting that the GPCS electrodes can be smoothly charged and discharged at the given current densities (Fig. S6†).
EIS has been commonly used to analyse the electrical resistance of electrodes during electrochemical processes. As shown in Fig. 5d, the Nyquist plots contain a semicircle and straight line in the intermediate and low frequency regions.40 The semicircle represents that the charge transfer resistance caused by Faradaic reactions at the interface is ignorable, indicating that all the electrodes have an ultra-small charge transfer resistance. In the low frequency region, the straight line often relates to the capacitive behavior of the electrode. The straight lines of all the electrodes deviated from the typical vertical line due to the slowed frequency dispersion and surface roughness of the electrodes.41 The x-intercept in the high frequency region is related to the equivalent series resistance (ESR), associated with the intrinsic electronic properties of the electrode and salt solution, mass transfer resistance of the salt ions, and contact resistance between the current collector and the electrode.42,43 The ESR value of the GPCSs (0.88) is lower than those of CC (1.14), APC (1.48) and PC (1.96), indicating their reduced resistance. The following reasons have led to the above phenomenon: (i) the GPCSs have an improved graphitization degree due to effective catalysis, and the electrical conductivity has been significantly improved; (ii) with a 2D porous structure, the salt ions can easily diffuse into the GPCS structure. In contrast, PC, APC and CC show a bulk structure with fewer ion transport channels, resulting in difficult mass transports. Therefore, the porous structure and higher graphitization degree together contribute to the much lower inner resistance of the GPCS electrodes. The EIS results further confirmed that the GPCSs with a reduced inner resistance and smooth electron/ion transport pathways are a good candidate for the CDI electrode material.
CDI performance
To investigate the CDI performance of the GPCS electrodes, batch mode flow-through deionization capacitor (FTDC) experiments were conducted in a NaCl solution with an initial conductivity of 1042 μS cm−1 at 1.2 V. The APC, CC and PC electrodes were also used for comparison. The plots of solution conductivity versus time are presented in Fig. 6a. Once an external voltage was applied on the electrodes, the SAC rapidly increased. After about 30 min, the SAC increases slowly until it reaches equilibrium. In the initial stage of CDI, the electrode materials have enough adsorption sites for ion accumulation and adsorption. Besides, the electrostatic attraction between the adsorbed ions and electrodes is very strong at the electrode/solution interface. However, in a prolonged adsorption time, the number of adsorption sites is decreased and the electrostatic repulsion is enhanced, so the increasing trend of SAC is slowed down. Particularly, the SAC of the GPCS electrodes increases much more quickly as compared to those of the APC, CC and PC electrodes, revealing that the GPCS electrodes exhibit a higher adsorption rate and larger adsorption capacity. The SAC of the GPCSs reaches 19.3 mg g−1 after 40 min, much higher than those of PC, CC and APC (9.3, 13.3 and 14.3 mg g−1) under 1.2 V in a 500 mg L−1 NaCl solution. In fact, the GPCS electrodes show obvious superiority as compared to those in recent publications (Table 1). It has been found in recent studies that a comprehensive consideration of the SAC and SAR during the CDI process is necessary.44,45 When SAR is plotted against SAC, comprehensive Ragone plots for CDI electrodes can be obtained. In the Ragone plots of SAR versus SAC, the CDI performance of the electrodes can be visually presented. Fig. 6b shows the comparison of the GPCS and PC electrodes in terms of the CDI performance. Apparently, the SAC increased with time until the adsorption equilibrium, while the SAR decreased with time. The slow increase of SAC and the rapid reduction of SAR during the CDI process can be attributed to the continuously reduced adsorption sites and enhanced electrostatic repulsion. More importantly, the Ragone plot of the GPCS electrodes is located in the upper right region as compared to those of the other electrodes, which reveals that the GPCS electrodes exhibit the highest SAC and SAR. In addition, the adsorption behavior of the GPCSs in 500 mg L−1 NaCl solution can be well described by the pseudo-second-order model with a high correlation coefficient (0.9994). By contrast, the GPCS electrodes show the highest rate constant, demonstrating its good kinetic performance (Table S1†). Besides, the GPCS electrodes show a charge efficiency of 0.69, larger than those of PC (0.14), CC (0.45) and APC (0.32), which means the GPCS electrodes have the lowest energy consumption (Fig. S7†). However, the charge efficiency of the GPCS electrodes is less than 1.0, which is the result of the co-ion repulsion effect, binder blocking effect and the weak adhesion between the electrodes and current collector.46 The pH value during the CDI process decreased slightly from 6.464 to 6.337, because a small amount of H+ was released due to the oxidation of the anode (Fig. S8†). The CDI performance of GPCSs can be significantly improved after activation and catalysis, and the following reasons are attributed to the enhanced performance of the GPCSs: (i) the larger specific surface area and pore volume of the GPCSs guaranteed enough active sites for ion accumulation; (ii) the nanosheet structure of the GPCSs reduces the ion diffusion resistance and distance, and thus boosts the ion transportation; (iii) a large number of micropores on the GPCS structure promote ion adsorption, which can ensure the full formation of the EDL. Besides, the pores on the surface of the GPCSs can connect independent carbon nanosheets and shorten the diffusion paths between carbon nanosheets, which can further promote ion migration; (iv) the GPCSs show excellent wettability, so ions in the solution can easily adsorb onto the electrode. The inner pores of the electrode can be effectively utilized, and the accessible surface area of the GPCSs is further improved, which also favors the CDI performance; (v) the graphitization degree due to the effective iron catalysis, resulting in better electric conductivity. The GPCSs with good conductivity can reduce the inner resistance, so the additional voltage consumption is decreased and more voltage can be used to adsorb salt ions during the CDI process. In conclusion, combining a high specific surface area, rich pore structure, and high conductivity and wettability, the GPCS electrode is a potential alternative for CDI applications.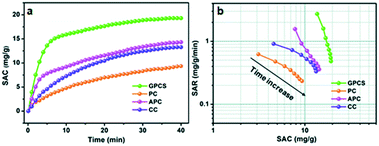 | ||
| Fig. 6 (a) Plots of SAC vs. deionization time; (b) Ragone plots of SAR vs. SAC for the GPCS, PC, APC and CC electrodes in a NaCl solution with a concentration of 500 mg L−1. | ||
| Electrode materials | Applied voltage (V) | Initial concentration (mg L−1) | SAC (mg g−1) | Ref. |
|---|---|---|---|---|
| Hollow ZIF-derived nanoporous carbon | 1.2 | 500 | 15.31 | 47 |
| Nitrogen-doped porous carbon nanofiber aerogel | 1.2 | 1000 | 17.29 | 48 |
| Phosphorus-doped 3D carbon nanofiber aerogels | 1.2 | 1000 | 16.20 | 49 |
| Hierarchical hole-enhanced 3D graphene | 1.2 | 572 | 9.60 | 50 |
| Protic salt-derived porous carbon | 1.6 | 100 | 16.50 | 51 |
| Ordered mesoporous carbon | 1.2 | 500 | 10.80 | 52 |
| Carbon beads | 1.2 | 292 | 11.50 | 53 |
| Nitrogen enriched activated carbon | 1.2 | 1000 | 16.56 | 54 |
| Porous graphene | 1.2 | 500 | 6.26 | 55 |
| Metal–organic framework/polypyrrole | 1.2 | 584 | 11.34 | 56 |
| Nitrogen-doped cluster-like porous carbons | 1.2 | 500 | 17.20 | 35 |
| GPCS | 1.2 | 500 | 19.30 | This work |
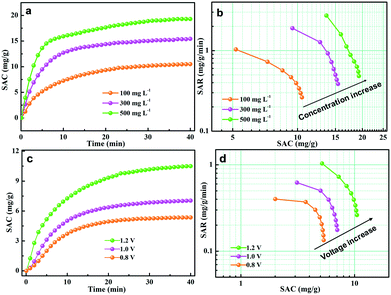
The effect of salt concentration was further investigated to evaluate the CDI performance of the GPCSs. The initial concentration of the salt solution ranged from 100 to 500 mg L−1, and the deionization results are presented in Fig. 7a and b. As seen from Fig. 7a, the SAC increased with time until adsorption equilibrium and the growth trend of SAC is more obvious at higher concentration. As calculated, the SAC is 10.5, 15.4 and 19.3 mg g−1 at a 100, 300 and 500 mg L−1 NaCl concentration, respectively. In Fig. 7b, the Ragone plot shifted to the upper right region at higher concentration, indicating that a higher salt concentration can improve the deionization capacity and rate. At higher salt concentration, the ionic conductivity is stronger, which is beneficial to rapid ion transfer into the electrodes. Besides, the higher NaCl concentration promotes compact EDL formation, which accelerates the SAC increase.
The external voltage has a critical effect on the CDI efficiency. It has been demonstrated that excessive voltage can cause Faradaic reactions, and the aqueous solutions will be decomposed.57,58 However, a low voltage will result in the incomplete EDL formation, and the adsorption capacity of electrodes will be weakened accordingly.57,58 Herein, the CDI performance of the GPCS electrodes at 0.8–1.2 V in a 100 mg L−1 NaCl solution was carefully evaluated, and the results are shown in Fig. 7c. The SAC increased with the deionization time, and the increasing trend is particularly evident at a higher voltage. The GPCS electrodes can adsorb more salt ions at a higher voltage owing to the stronger coulombic interactions between the electrodes and the oppositely charged ions. The SAC of the GPCS electrodes increased from 5.4 to 10.5 mg g−1, when the voltage increased from 0.8 to 1.2 V. As shown in Fig. 7d, the Ragone plot of the GPCS electrodes is located in the upper right region at a higher voltage, suggesting the improved deionization capacity and rate due to the stronger coulombic interactions between the ions and the oppositely charged electrodes and a thicker EDL.
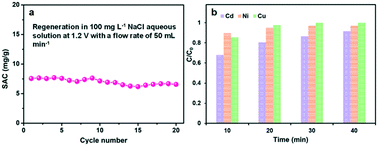
The regeneration performance is another important parameter to the CDI electrodes. Several multiple adsorption–desorption cycles of the GPCS electrodes were further performed in a 100 mg L−1 NaCl solution, and both the adsorption and desorption processes last for about 10 minutes. The electrodes were subjected to voltage in the adsorption process and then short-circuited in the desorption process. As shown in Fig. 8a, the SAC changed little in the first five cycles, indicating that the electrode has good stability. Subsequently, the SAC decreased slightly, which may be caused by oxidation of the electrode surface during the prolonged cycles. This problem may be addressed by designing an asymmetric electrode using pseudocapacitive materials as the anode material in a future work.59,60
Excess metal ions in water environments pose a severe threat to human beings, and CDI technology provides an important method for the removal of excess metal ions. The removal performance of the GPCS electrodes towards other typical metal ions is further studied. Fig. 8b shows the adsorption efficiency of the GPCS electrodes towards Cd2+, Ni2+ and Cu2+ at 1.2 V in a 100 mg L−1 CdCl2, NiCl2 or CuCl2 solution. The removal efficiency of the GPCS electrodes increase with the adsorption time, and the removal efficiency towards the three metal ions of the GPCSs is higher than 90% at 40 min, indicating that the metal ions can be effectively separated from water. As calculated, the adsorption capacities of the GPCS electrodes towards Cd2+, Ni2+ and Cu2+ are 13.7, 14.6 and 15.0 mg g−1 in a 100 mg L−1 CdCl2, NiCl2 and CuCl2 solution, respectively, higher than that towards Na+ (10.5 mg g−1 in a 100 mg L−1 NaCl solution) owing to the stronger electrostatic attraction between the GPCS electrodes and the divalent metal ions. In summary, the porous structure and good wettability and conductivity make the GPCS electrodes have adsorption properties for various metal ions.
Conclusions
In conclusion, efficient CDI of saline water has been demonstrated by using graphitic porous carbon nanosheets derived from straw waste. A sustainable route to convert biomass straw waste as a natural carbon source into graphitic porous carbon sheets was demonstrated. The fabrication process involved a facile method combining activation and catalysis to realize a 2D graphitic and porous structure. The obtained GPCSs exhibited desirable characteristics including a porous structure, good electrical conductivity and excellent wettability. In the electrochemical tests, the GPCSs showed the highest specific capacitance and lowest resistance as compared to the APC, CC and PC electrodes. In the CDI experiments, the unique structure and high surface area endowed the GPCSs with a high SAC (19.3 mg g−1) and a high SAR (0.48 mg g−1 min−1) in a 500 mg L−1 NaCl solution at 1.2 V. Moreover, the GPCS electrodes showed good regenerability in repeated adsorption–desorption experiments. Furthermore, the removal efficiency of the GPCSs was higher than 90% towards different metal ions in 100 mg L−1 solution at 1.2 V. This work is valuable for designing carbon electrode materials by a sustainable and low-cost method and the utilization of straw waste.Conflicts of interest
There are no conflicts to declare.Acknowledgements
The authors acknowledge the support from the Natural Science Foundation of Jiangsu Province (BK20170475), the National Natural Science Foundation of China (21906101), the Science and Technology Commission of Shanghai Municipality (19DZ2293100; 18DZ2281400; 17230741400), and the Royal Academy of Engineering under the Research Fellowship scheme.References
- A. Subramani and J. G. Jacangelo, Water Res., 2015, 75, 164–187 CrossRef CAS PubMed.
- M. A. Shannon, P. W. Bohn, M. Elimelech, J. G. Georgiadis, B. J. Mariñas and A. M. Mayes, Nature, 2008, 452, 301–310 CrossRef CAS PubMed.
- A. Macías-García, M. Gómez Corzo, M. Alfaro Domínguez, M. Alexandre Franco and J. Martínez Naharro, J. Hazard. Mater., 2017, 328, 46–55 CrossRef PubMed.
- M. Elimelech and W. A. Phillip, Science, 2011, 333, 712–717 CrossRef CAS PubMed.
- J. Choi, P. Dorji, H. K. Shon and S. Hong, Desalination, 2019, 449, 118–130 CrossRef CAS.
- S. Lopez-Bernabeu, R. Ruiz-Rosas, C. Quijada, F. Montilla and E. Morallon, Chemosphere, 2016, 144, 982–988 CrossRef CAS PubMed.
- J. Kim, Y. Yi, D. H. Peck, S. H. Yoon, D. H. Jung and H. S. Park, Environ. Sci.: Nano, 2019, 6, 916–924 RSC.
- C. Fan, S. Tseng, Z. Wu, K. Li and C. Hou, J. Hazard. Mater., 2016, 312, 208–215 CrossRef CAS.
- L. Wang, J. E. Dykstra and S. Lin, Environ. Sci. Technol., 2019, 53, 3366–3378 CrossRef CAS.
- H. Yin, S. Zhao, J. Wan, H. Tang, L. Chang, L. He, H. Zhao, Y. Gao and Z. Tang, Adv. Mater., 2013, 25, 6270–6276 CrossRef CAS.
- S. Porada, R. Zhao, A. van der Wal, V. Presser and P. M. Biesheuvel, Prog. Mater. Sci., 2013, 58, 1388–1442 CrossRef CAS.
- G. Wang, C. Pan, L. P. Wang, Q. G. Dong, C. Yu, Z. B. Zhao and J. S. Qiu, Electrochim. Acta, 2012, 69, 65–70 CrossRef CAS.
- C. Y. Ma, S. C. Huang, P. H. Chou, W. Den and C. H. Hou, Chemosphere, 2016, 146, 113–120 CrossRef CAS.
- J. Li, X. Wang, H. Wang, S. Wang, T. Hayat, A. Alsaedi and X. Wang, Environ. Sci.: Nano, 2017, 4, 1114–1123 RSC.
- L. D. Zou, L. X. Li, H. H. Song and G. Morris, Water Res., 2008, 42, 2340–2348 CrossRef CAS PubMed.
- R. Ruoff, Graphene: Calling all chemists, Nat. Nanotechnol., 2008, 3, 10–11 CrossRef CAS.
- Z. P. Chen, W. C. Ren, L. B. Gao, B. L. Liu, S. F. Pei and H. M. Cheng, Nat. Mater., 2011, 10, 424–428 CrossRef CAS PubMed.
- H. Li, L. Zou, L. Pan and Z. Sun, Environ. Sci. Technol., 2010, 44, 8692–8697 CrossRef CAS PubMed.
- H. Wang, D. S. Zhang, T. T. Yan, X. R. Wen, J. P. Zhang, L. Y. Shi and Q. D. Zhong, J. Mater. Chem. A, 2013, 1, 11778–11789 RSC.
- Z. Y. Yang, L. J. Jin, G. Q. Lu, Q. Q. Xiao, Y. X. Zhang, L. Jing, X. X. Zhang, Y. M. Yan and K. N. Sun, Adv. Funct. Mater., 2014, 24, 3917–3925 CrossRef CAS.
- X. Xu, Y. Liu, M. Wang, C. Zhu, T. Lu, R. Zhao and L. Pan, Electrochim. Acta, 2016, 193, 88–95 CrossRef CAS.
- Z. U. Khan, T. T. Yan, L. Y. Shi and D. S. Zhang, Environ. Sci.: Nano, 2018, 5, 980–991 RSC.
- J. Ding, H. L. Wang, Z. Li, K. Cui, D. Karpuzov, X. H. Tan, A. Kohandehghanab and D. Mitlin, Energy Environ. Sci., 2015, 8, 941–955 RSC.
- C. Zhao, G. Liu, N. Sun, X. Zhang, G. Wang, Y. Zhang, H. Zhang and H. Zhao, Chem. Eng. J., 2018, 334, 1270–1280 CrossRef CAS.
- X. Wu, L. Jiang, C. Long and Z. Fan, Nano Energy, 2015, 13, 527–536 CrossRef CAS.
- Z. Xie, X. Shang, J. Yan, T. Hussain, P. Nie and J. Liu, Electrochim. Acta, 2018, 290, 666–675 CrossRef CAS.
- A. L. Cazetta, O. Pezoti, K. C. Bedin, T. L. Silva, A. Paesano Junior, T. Asefa and V. C. Almeida, ACS Sustainable Chem. Eng., 2016, 4, 1058–1068 CrossRef CAS.
- S. S. Zhao, T. T. Yan, H. Wang, J. P. Zhang, L. Y. Shi and D. S. Zhang, ACS Appl. Mater. Interfaces, 2016, 8, 18027–18035 CrossRef CAS PubMed.
- S. K. Park, H. Lee, M. S. Choi, D. H. Suh, P. Nakhanivej and H. S. Park, Energy Storage Mater., 2018, 12, 331–340 CrossRef.
- Z. L. Yu, S. Xin, Y. You, L. Yu, Y. Lin, D. W. Xu, C. Qiao, Z. H. Huang, N. Yang, S. H. Yu and J. B. Goodenough, J. Am. Chem. Soc., 2016, 138, 14915–14922 CrossRef CAS PubMed.
- S. Uçar, M. Erdem, T. Tay and S. Karagöz, Appl. Surf. Sci., 2009, 255, 8890–8896 CrossRef.
- L. Sun, C. Tian, M. Li, X. Meng, L. Wang, R. Wang, J. Yin and H. Fu, J. Mater. Chem. A, 2013, 1, 6462–6470 RSC.
- H. Lei, T. T. Yan, H. Wang, L. Y. Shi, J. P. Zhang and D. S. Zhang, J. Mater. Chem. A, 2015, 3, 5934–5941 RSC.
- J. Zhang, J. H. Fang, J. L. Han, T. T. Yan, L. Y. Shi and D. S. Zhang, J. Mater. Chem. A, 2018, 6, 15245–15252 RSC.
- Y. Li, Y. Liu, J. Shen, J. Qi, J. Li, X. Sun, J. Shen, W. Han and L. Wang, Desalination, 2018, 430, 45–55 CrossRef CAS.
- C. Chen, H. Wang, C. Han, J. Deng, J. Wang, M. Li, M. Tang, H. Jin and Y. Wang, J. Am. Chem. Soc., 2017, 139, 2657–2663 CrossRef CAS PubMed.
- H. Wang, L. Zhi, K. Liu, L. Dang, Z. Liu, Z. Lei, C. Yu and J. Qiu, Adv. Funct. Mater., 2015, 25, 5420–5427 CrossRef CAS.
- Y. Liu, L. Pan, T. Chen, X. Xu, T. Lu, Z. Sun and D. H. C. Chua, Electrochim. Acta, 2015, 151, 489–496 CrossRef CAS.
- D. V. Lam, K. Jo, C. H. Kim, J. H. Kim, H. J. Lee and S. M. Lee, ACS Nano, 2016, 10, 11351–11359 CrossRef CAS PubMed.
- L. Xie, H. Wang, C. Chen, S. Mao, Y. Chen, H. Li and Y. Wang, Research, 2018, 2018, 5807980 CrossRef PubMed.
- N. Brun, S. R. S. Prabaharan, C. Surcin, M. Morcrette, H. Deleuze, M. Birot, O. Babot, M. F. Achard and R. Backov, J. Phys. Chem. C, 2012, 116, 1408–1421 CrossRef CAS.
- B. G. Choi, S. J. Chang, Y. B. Lee, J. S. Bae, H. J. Kim and Y. S. Huh, Nanoscale, 2012, 4, 5924–5930 RSC.
- Y. M. He, W. J. Chen, X. D. Li, Z. X. Zhang, J. C. Fu, C. H. Zhao and E. Q. Xie, ACS Nano, 2013, 7, 174–182 CrossRef CAS PubMed.
- T. Kim and J. Yoon, RSC Adv., 2015, 5, 1456–1461 RSC.
- M. E. Suss, S. Porada, X. Sun, P. M. Biesheuvel, J. Yoon and V. Presser, Energy Environ. Sci., 2015, 8, 2296–2319 RSC.
- H. Y. Duan, T. T. Yan, G. R. Chen, J. P. Zhang, L. Y. Shi and D. S. Zhang, Chem. Commun., 2017, 53, 7465–7468 RSC.
- J. Shen, Y. Li, C. Wang, R. Luo, J. Li, X. Sun, J. Shen, W. Han and L. Wang, Electrochim. Acta, 2018, 273, 34–42 CrossRef CAS.
- G. Zhu, H. Wang, H. Xu and L. Zhang, J. Electroanal. Chem., 2018, 822, 81–88 CrossRef CAS.
- Y. Li, Y. Liu, M. Wang, X. Xu, T. Lu, C. Q. Sun and L. Pan, Carbon, 2018, 130, 377–383 CrossRef CAS.
- J. Li, B. Ji, R. Jiang, P. Zhang, N. Chen, G. Zhang and L. Qu, Carbon, 2018, 129, 95–103 CrossRef CAS.
- Y. Li, J. Shen, J. Li, X. Sun, J. Shen, W. Han and L. Wang, Carbon, 2017, 116, 21–32 CrossRef CAS.
- Z. Chen, H. Zhang, C. Wu, L. Luo, C. Wang, S. Huang and H. Xu, Desalination, 2018, 433, 68–74 CrossRef CAS.
- B. Krüner, P. Srimuk, S. Fleischmann, M. Zeiger, A. Schreiber, M. Aslan, A. Quade and V. Presser, Carbon, 2017, 117, 46–54 CrossRef.
- L. Zhang, Y. Liu, T. Lu and L. Pan, J. Electroanal. Chem., 2017, 804, 179–184 CrossRef CAS.
- Y. Zhang, L. Chen, S. Mao, Z. Zhuo, Y. Song and R. Zhao, J. Colloid. Interf. Sci., 2019, 536, 252–260 CrossRef CAS PubMed.
- Z. Wang, X. Xu, J. Kim, V. Malgras, R. Mo, C. Li, Y. Lin, H. Tan, J. Tang, L. Pan, Y. Bando, T. Yang and Y. Yamauchi, Mater. Horiz., 2019, 6, 1433–1437 RSC.
- H. Wang, T. T. Yan, L. Y. Shi, G. R. Chen, J. P. Zhang and D. S. Zhang, ACS Sustainable Chem. Eng., 2017, 5, 3329–3338 CrossRef CAS.
- C. Wang, H. Song, Q. Zhang, B. Wang and A. Li, Desalination, 2015, 365, 407–415 CrossRef CAS.
- T. Wu, G. Wang, S. Wang, F. Zhan, Y. Fu, H. Qiao and J. Qiu, Environ. Sci. Tech. Let., 2018, 5, 98–102 CrossRef CAS.
- J. L. Han, T. T. Yan, J. J. Shen, L. Y. Shi, J. P. Zhang and D. S. Zhang, Environ. Sci. Technol., 2019, 53, 12668–12676 CrossRef CAS PubMed.
Footnotes |
| † Electronic supplementary information (ESI) available: The SEM image of the GPCSs; the SEM and TEM images of PC, CC and APC; XPS survey scan spectra and FTIR spectra of GPCS, PC, CC and APC; CV curves of the GPCSs obtained at different calcination temperatures at 10 mV s−1 in a 0.5 M NaCl solution; CV curves at 10 mV s−1; GC curves at 0.2–1.0 A g−1; current transient curves and pH vs. time plot for the GPCS electrodes in a 500 mg L−1 NaCl solution at 1.2 V; adsorption kinetics parameters of GPCS, PC, CC and APC. See DOI: 10.1039/c9en01233h |
| ‡ H. W. and T. Y. contributed equally to this work. |
| This journal is © The Royal Society of Chemistry 2020 |


