 Open Access Article
N-doped oxidized carbon dots for methanol sensing in alcoholic beverages†
M. Latha a,
R. Aruna-Devi
 a,
N. K. R. Bogireddy
 a,
Sergio E. S. Riosa,
W. L. Mochan
 b,
J. Castrellon-Uribea and
V. Agarwal
 *a
*a
aCentro de Investigacion en Ingenieria y Ciencias Aplicadas, UAEM, Av. Univ. 1001, Col. Chamilpa, Cuernavaca, Morelos 62209, Mexico. E-mail: vagarwal@uaem.mx
bInstituto de Ciencias Físicas, Universidad Nacional Autónoma de México, Av. Universidad s/n, Cuernavaca, Morelos 62210, Mexico
First published on 12th June 2020
Abstract
Methanol (MeOH) adulteration in alcoholic beverages resulting in irreparable health damage demands highly sensitive and cost-effective sensors for its quantification. As carbon dots are emerging as new biocompatible and sustainable light-emitting detectors, this work demonstrates the hydrothermally prepared nitrogen-doped oxidized carbon dots (NOCDs) as on-off fluorescent nanoprobes to detect MeOH traces in water and alcoholic beverages. The presence of 1% of MeOH in distilled water is found to decrease the NOCD fluorescent emission intensity by more than 90% whereas up to 70% ethanol (EtOH) content changes the signal to within 20% of its initial value. HR-TEM analysis reveals the agglomeration of the nanoprobes suspended in MeOH. Due to their selectivity towards MeOH, the fluorescent nanoprobes were successfully tested using a few MeOH spiked branded and unbranded Mexican alcoholic beverages. Varying degrees of signal quenching is observed from the fluorescent nanoprobes dispersed in different pristine beverages with a detection limit of less than 0.11 v%. Herein, we establish a new perspective towards economically viable non-toxic fluorescent probes as a potential alternative for the detection of MeOH in alcoholic beverages.
1. Introduction
Methanol (MeOH) contamination of traditional alcoholic beverages is increasing all over the world and has caused deaths in several countries including Indonesia, Nigeria, Mexico and India. According to the World Health Organization (WHO), approximately 2.5 million deaths occur every year due to the harmful use of alcohol.1 The production of alcoholic beverages via fermentation has been a tradition all over the world. Typical beverages from Mexico (Tequila and Mezcal) are produced in enormous amounts by innumerable unmonitored/uncertified small-scale enterprises located in almost all parts of the country. As the basic method to produce alcohol is by fermentation and simple distillation,2 lack of proper fermentation and distillation techniques has been one of the main reasons leading to high risk of MeOH content in alcoholic beverages.3 MeOH contamination/adulteration of traditionally fermented beverages has resulted in irreparable health damage (brain, liver and permanent blindness) and even death.4 The most common source of MeOH contamination in Mexico and several other developing countries is the above-mentioned illegal manufacturing and distribution of alcoholic beverages coming as a cheaper alternative for the local economically constrained people along with the deliberate adulteration of beverages (for cost reduction) from corrupt, opportunistic/unauthorized producers/vendors.The wide diversity in the sources (such as fruits, cassava, palm wine, sugar cane, etc.) and fermentation processes involved in the elaboration process of alcoholic beverages makes the authenticity monitoring a challenging task. Besides, the contaminants existing in the alcoholic beverages are usually studied with expensive and sophisticated methods such as gas chromatography,5–7 liquid chromatography8 and mass spectrometry,9,10 Therefore, it is very important to look for a facile and cost-effective methods, to detect MeOH in alcoholic beverages.
Carbon dots (CDs) have attracted much attention recently, due to their non-toxic nature, biocompatibility, low-cost, chemical inertness and ease of fabrication.11 Furthermore, doping of CD's with heteroatom elements (such as nitrogen, phosphorus, boron, etc.) changes their chemical and optical properties, extending their applications in various field. Among these heteroatoms, nitrogen is an ideal dopant due to its similar atomic size as carbon. Recently, chemical sensors from carbon nanoparticles have been demonstrated and employed to detect the commonly used organic solvent acetone12 in water-based fluids, as well as to detect water in organic solvents.13,14 In particular, P. Das et al., reported the detection of acetone12 in human fluids (blood and urine) using nitrogen and sulfur co-doped carbon dots prepared with kappa carrageenan and urea through fluorescence quenching. In addition, CDs functionalized covalently with an imidazole derivative15 has been reported to regain the fluorescence (quenched due to photoinduced electron transfer from imidazole to CDs) in the presence of trace amounts of water in organic solvents. Recently, hydrothermally prepared poorly water-soluble carbon dots from o-phenylenediamine revealed solvent dependent emission (D. Chao et al.)14 and have been used for the visual as well as quantitative detection of water in different organic solvents. An increase in the solvent polarity was found to shift their absorption as well as their emission peak, resulting in a change from cyan to orange fluorescence. Similarly, J. Wei et al.16 showed excellent fluorescent properties of CDs prepared by the solvothermal method in organic solvents (ethanol, tetrahydrofuran, 1,4-dioxane) from sodium citrate, carbamide and cobalt chloride as precursors and methylbenzene as a solvent, for fluorescence quenching based sensitive detection of water in organic solvents.
Intrinsic characteristics, as well as specificity of CDs can be tuned using different sources, dopants and synthesis methods.17 The present work demonstrates fluorescent “turn-off” sensors based on nitrogen-doped oxidized carbon dots (NOCDs), prepared hydrothermally using citric acid and urea as carbon and nitrogen precursors respectively. We verified the selectivity of our sensors for MeOH with respect to different polar solvents such as ethanol (EtOH), isopropyl alcohol (IPA), acetonitrile (ACN), dimethylformamide (DMF), tetrahydrofuran (THF) and acetone (AC). Synthesized nanoprobes were able to quantify concentrations of MeOH as low as 0.00467 v% in deionized (DI) water. Additionally, the sensitivity of the proposed NOCDs was demonstrated in MeOH spiked branded and unbranded Mexican alcoholic beverages. In the long-term, this work yields the possibility of developing an economically viable portable sensor system to quantify MeOH content in alcoholic beverages, which can be used by academic institutions, beverage companies, liquor stores, and even interested individuals all over the world.
2. Experimental details
2.1 Materials
Citric acid (C6H8O7), urea ((NH2)2CO), ethanol (EtOH), isopropyl alcohol (IPA), acetonitrile (ACN), dimethyl formamide (DMF), tetrahydrofuran (THF), acetone (AC), methanol (MeOH) from Sigma-Aldrich were used as received. A bottle of Tequila Don Julio Blanco (tDJB) and bottles of traditional mezcal Tobala Matatlan Oax Artesanal (mTMOA), 400 Conejos Joven (m400CJ), Artesanal mezcal (mAR) and standard mezcal Mezcal de Chilapa (mC), Mezcal Agasajo-Joven (mMAJ) and Mezcal Agasajo Joven con gusano (mMAJG) were acquired from a local market in the state of Morelos, in the central part of Mexico.2.2 Synthesis of nitrogen-doped oxidized carbon dots (NOCDs)
The NOCDs were hydrothermally synthesized using citric acid (C6H8O7) and urea (NH2)2CO as carbon (C) and nitrogen (N) sources, respectively. A precursor solution was prepared by dissolving 40 mg (0.0042 mol L−1) of C6H8O7 and 75 mg (0.25 mol L−1) of (NH2)2CO in 100 mL of DI water at room temperature (RT). The resulting transparent solution was transferred into a Teflon lined autoclave and heated to 180 °C for 1 h. After the autoclave cooled down to RT, the product was gathered and used for further analysis.2.3 Characterization
UV-visible absorbance spectra of as-prepared NOCDs was measured in a dual beam PerkinElmer Lambda 950 spectrophotometer and the fluorescence measurements were carried out with Cary Eclipse Spectrophotometer. High-resolution transmission electron microscopy (HR-TEM) measurements were carried out in a JEM-ARM200F for determining the particle size distribution of the synthesized NOCDs. A 100 mesh Cu grid with a lacey carbon film was used for the sample preparation by drop-casting of (diluted) NOCDs and subsequent evaporation under ambient conditions. A Bruker D8 X-ray diffractometer (XRD) with Cu Kα radiation (λ = 1.5406 Å) was used for measuring the diffraction pattern. For surface-sensitive quantitative analysis, Al Kα radiation with photon energy 1486.6 ± 0.2 eV from an ESCA Ulvac-PHI 1600 X-ray photoelectron spectrometer (XPS) was used. The surface characteristics of the fluorescent probes were studied using Fourier transform infrared (FTIR) spectra-Varian 660-IR FTIR spectrophotometer.(a) For mimicking the beverages like brandy, beer, Tequila, mezcal, rum and neutral spirits, experiments were carried out under certain (10, 40 and 90%) total alcohol content (EtOH + MeOH) with variable proportions (MeOH![[thin space (1/6-em)]](https://www.rsc.org/images/entities/char_2009.gif) :
:![[thin space (1/6-em)]](https://www.rsc.org/images/entities/char_2009.gif) EtOH) to monitor the corresponding response of the nanoprobes. A certain amount of NOCDs (8 and 70 μL) was added to a 2 mL quartz cuvette and the rest of the cuvette filled with appropriately diluted alcohol mix. The MeOH concentration was varied from 0.0125% to 10.00% with respect to the EtOH concentration, keeping the total alcohol content fixed. (b) Unspiked beverages were tested with 8 μL of as-prepared NOCDs after diluting the real samples by 40 times in a total volume of 2 mL. (c) For testing, MeOH spiked branded and unbranded beverages, 8 μL of NOCDs were added in 40 times diluted beverages.
EtOH) to monitor the corresponding response of the nanoprobes. A certain amount of NOCDs (8 and 70 μL) was added to a 2 mL quartz cuvette and the rest of the cuvette filled with appropriately diluted alcohol mix. The MeOH concentration was varied from 0.0125% to 10.00% with respect to the EtOH concentration, keeping the total alcohol content fixed. (b) Unspiked beverages were tested with 8 μL of as-prepared NOCDs after diluting the real samples by 40 times in a total volume of 2 mL. (c) For testing, MeOH spiked branded and unbranded beverages, 8 μL of NOCDs were added in 40 times diluted beverages.
3. Results and discussion
3.1 Characterization of NOCDs
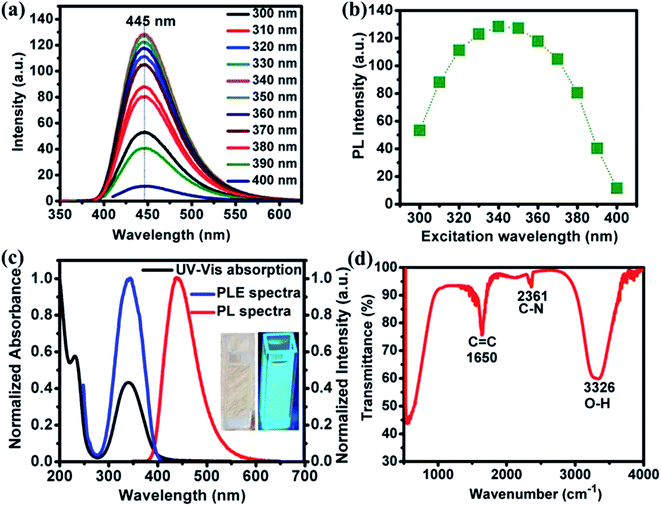
Photoluminescence (PL) spectra of NOCDs (concentration 7%; diluted in water) corresponding to different excitation wavelengths are shown in Fig. 1a. A strong blue emission peaked around 445 nm, observed under excitation wavelength range of 300–400 nm, reveals no shift in the wavelength of the PL maximum. The emission is largest when excited at 340 nm (Fig. 1b). The independence of the fluorescence line shape and peak on the excitation may be attributed to narrow size distribution of the NOCDs.18 As reported previously, the introduction of N as dopant promotes the formation of many surface states associated with the enhancement in the emission properties of the synthesized particles with respect to the undoped CDs. The obtained PL characteristics of NOCDs are the joint contribution of surface states as well as the dimension of the particles (confinement effect).12 The excitation-independent properties of NOCDs open the possibility of extensive applications, where an anchored fluorescence emission is required. Besides, the fluorescence quantum yield of the NOCDs was calculated using rhodamine 6G in DI water (quantum yield: 100%) as a standard sample. The absorbance and photoluminescence measurements were carried out using UV-visible absorbance and photoluminescence spectrophotometer. The PL emission spectra of all the samples were measured at 340 nm excitation wavelength. Absolute values were calculated with the following equation:13| ΦX = ΦST (mX/mST)(ηX2/ηST2) |
The absorbance and fluorescence excitation spectra of the sample in water are shown in Fig. 1c, which shows a predominant absorption band located at 344 nm along with an additional absorption band at 230 nm. NOCDs appear (inset Fig. 1c) as a transparent solution under daylight while revealing a strong bright blue emission under UV light (at 360 nm). FTIR was also performed to obtain structural insights. As depicted in Fig. 1d, a broad and intense peak around 3326 cm−1, attributed to the O–H stretching mode19 indicates a large number of hydroxyl groups. The peak at 1650 cm−1 corresponds to C![[double bond, length as m-dash]](https://www.rsc.org/images/entities/char_e001.gif) C stretching of polycyclic aromatic hydrocarbons which reveals the presence of sp2 hybridization.20 The C–N mode stretching is observed at 2361 cm−1.
C stretching of polycyclic aromatic hydrocarbons which reveals the presence of sp2 hybridization.20 The C–N mode stretching is observed at 2361 cm−1.
Basic structural characterization (including TEM, XRD and XPS analysis) is given in the ESI Fig. S2.† The size distribution of as-prepared NOCDs, analyzed through TEM (Fig. S2a;† histogram is taken over 60 particles shown as Fig. S2a† inset), reveals the particle size range of 2–6 nm (average diameter: 3.7 ± 1.5 nm). Their XRD pattern (Fig. S2b†) exhibits a sharp peak centered at 11.3°, which is attributed to the graphitic structure with interlayer spacing (001) of 0.78 nm.17 The XPS survey scan of NOCDs clearly shows major peaks around 532, 400 and 285 eV, corresponding to the characteristic peaks of O 1s, N 1s and C 1s, respectively (Fig. S2c†). The occurrence of the N 1s (≈400 eV) peak confirms the existence of an N atom in the NOCDs. Furthermore, the XPS peaks of C 1s, O 1s and N 1s were deconvoluted to understand the chemical species present in NOCDs.17 After deconvolution of C 1s peak of NOCDs, C–C/C![[double bond, length as m-dash]](https://www.rsc.org/images/entities/char_e001.gif) C (284.3 eV), C–O (285.6 eV), C
C (284.3 eV), C–O (285.6 eV), C![[double bond, length as m-dash]](https://www.rsc.org/images/entities/char_e001.gif) O (287.4 eV) and O–C
O (287.4 eV) and O–C![[double bond, length as m-dash]](https://www.rsc.org/images/entities/char_e001.gif) O (288.6 eV) streching modes are observed (Fig. S2d†), revealing the existence of carbonyl and carboxyl functional groups of NOCDs. Fig. S2e and f† show the deconvoluted O 1s (531.6 and 533.3 eV assigned as C
O (288.6 eV) streching modes are observed (Fig. S2d†), revealing the existence of carbonyl and carboxyl functional groups of NOCDs. Fig. S2e and f† show the deconvoluted O 1s (531.6 and 533.3 eV assigned as C![[double bond, length as m-dash]](https://www.rsc.org/images/entities/char_e001.gif) O and C–O) and N 1s peaks (pyridinic N at 399.7 eV and graphitic N/amine N at 401.3 eV) of NOCDs and they also reveal similar results. Hence, XPS results confirm the presence of N as well as oxygen-containing functional groups in NOCDs.17
O and C–O) and N 1s peaks (pyridinic N at 399.7 eV and graphitic N/amine N at 401.3 eV) of NOCDs and they also reveal similar results. Hence, XPS results confirm the presence of N as well as oxygen-containing functional groups in NOCDs.17
3.2 Detection of MeOH using NOCDs
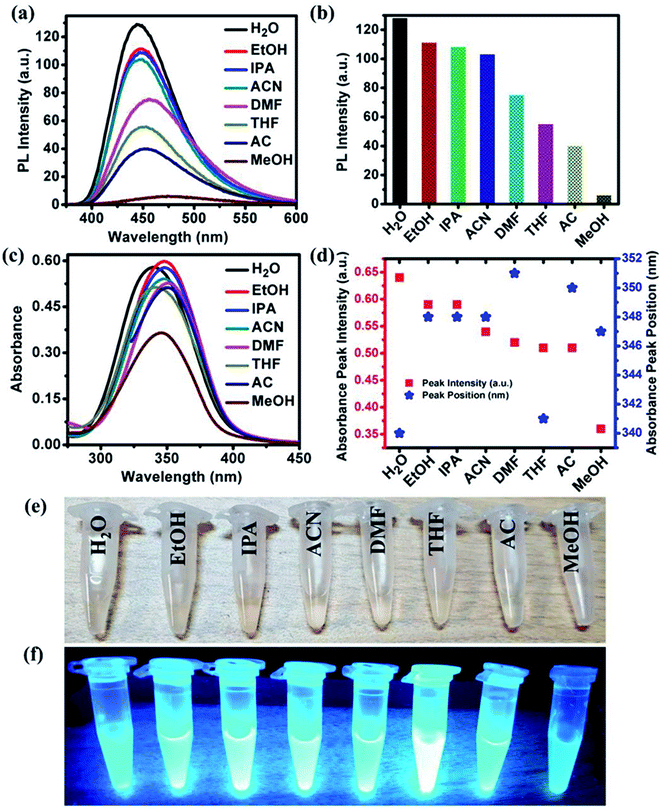
In addition to the solvent-dependent optical properties of NOCDs mentioned previously,12,13 Wang et al. reported stronger light absorption in polar solvents with Mn(II)-doped carbon dots with respect to nonpolar ones.21 Similarly, Zheng et al. reported that the carbon dots synthesized from (Z)-4-(2-cyano-2-(40-(diphenylamine)-[1,10-biphenyl]-4-yl)-inyl)benzonitrile exhibited the higher optical absorption in polar solvents.12 In our present study, NOCDs proved to be soluble in all the polar solvents such as EtOH, IPA, ACN, DMF, THF, AC and MeOH. As can be seen in Fig. 2(a and b), the PL peak intensity of NOCDs in different solvents can be ranked as follows: H2O > EtOH > IPA > ACN > DMF > THF > AC > MeOH. ESI related to the PL emission response of NOCDs (at different excitation wavelength) in each solvent is shown in Fig. S3.†Fig. S4† shows the PL spectra of NOCDs in different concentration of organic solvents (DMF, THF and AC). Although an increase in the DMF, THF and AC concentrations, the PL intensity is found to reduce, the complete PL quenching was observed only in case of MeOH (80 v%). which confirms the highly sensitive nature of NOCDs towards MeOH in comparison to other organic solvents (as shown in Fig. 2a). Hence, we have chosen MeOH for further experiments.
Fig. 2(c and d) show that the absorption peaks at frequencies that go from 340 to 351 nm as the solvent is changed. Fig. 2(e and f) show images of NOCDs solutions in different organic volatile solvents under daylight and UV light with an illumination intensity of 365 nm. The observed variation in the emission signal of NOCDs when dispersed in different solvents suggests that the polar–polar interaction led to changes in the optical properties of NOCDs. The observed changes in the optical properties of NOCDs in volatile organic compounds could be due to the change of polarization, solvent relaxation, and energy transfer between solvent molecules and NOCDs. The main outcome here is the drastic change in PL intensity of NOCDs in the presence of MeOH.
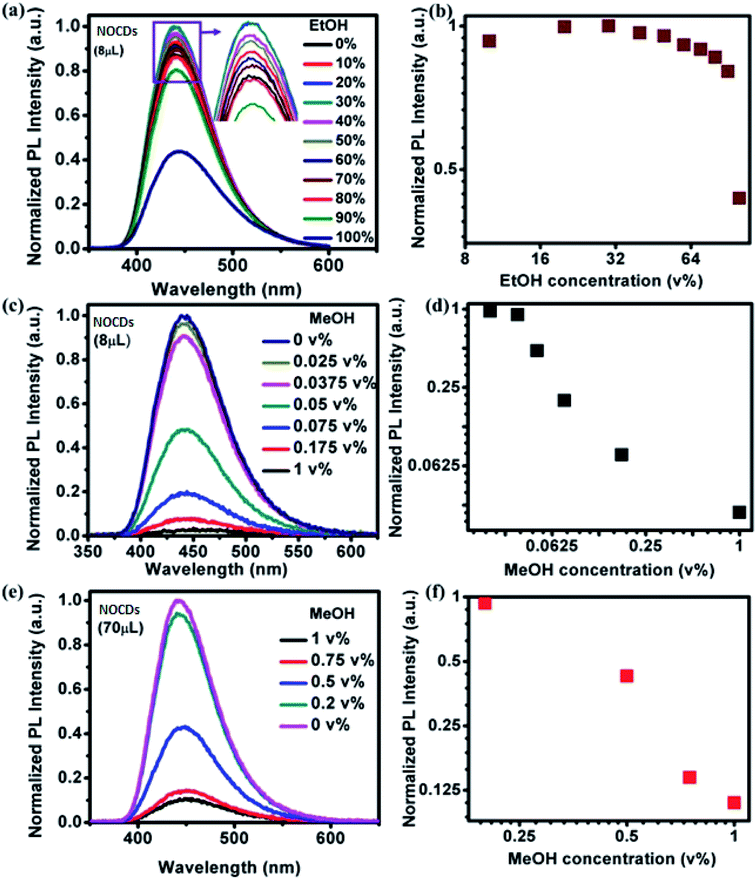
Fig. 3a shows the effect of varying the concentration of EtOH in the PL spectra of 8 μL of NOCDs and Fig. 3b shows the corresponding normalized peak intensities. The peak position remains fixed and its intensity grows slightly as the volume concentration of EtOH increases up to 40% of EtOH and then decreases. Fig. 3c and d are similar, but they correspond to different concentrations of MeOH, much smaller than those of EtOH in Fig. 3a. As opposed to the EtOH case (Fig. 3b), as the MeOH concentration increases (Fig. 3c and d), the PL intensity is reduced very fast. Besides, using as-prepared NOCDs, the minimum detection limit of MeOH was found to be 0.025 v%. To extend the detection range we increased the volume of NOCDs to 70 μL. Fig. 3e and f show the corresponding spectra and maxima intensity and they show that the detection range was increased up to 1 v%. In addition, these NOCDs used to detect the MeOH concentration in real alcoholic beverages as discussed below.
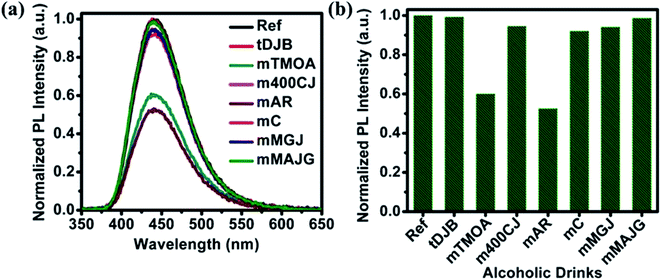
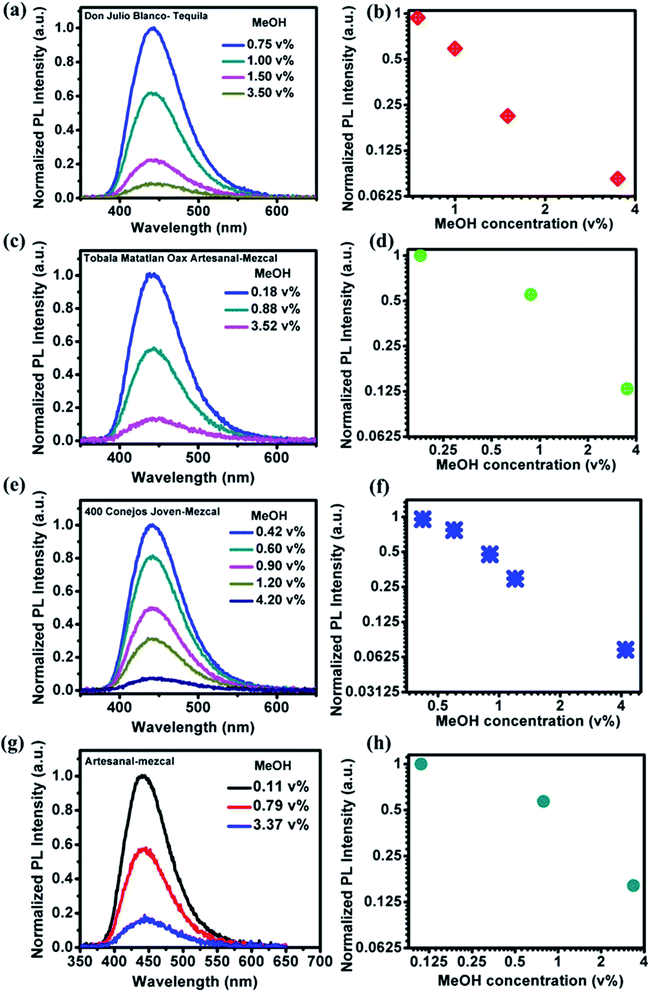
PL emission corresponding to different concentration of MeOH in different v% of alcohols can be found in Fig. S5 and S6.† The summarized results using two different amounts of NOCDs (shown in Fig. 4) reveal the dependence of the PL peak intensity variation on the total alcohol content. For 10, 40 and 90% of total alcohol content, using 8 μL of NOCDs, the measurable detection range of MeOH was 0.0125 to 1v% and using 70 μL of NOCDs, the detection range of MeOH increases to 10 v%. At higher concentrations of alcohol, along with a decrease in the PL intensity, a redshift (Fig. S5e and S6e†) of the corresponding emission band is observed. An increase in total alcohol content is found to decrease probe sensitivity. The limit of detection (LOD) of MeOH in DI water (Fig. S5e†) was calculated using LOD = 3 × SD/m (where the signal to noise ratio is 3, SD is standard deviation and m is their slope corresponding to the linear range in MeOH concentration vs. PL intensity graph).11 The calculated value was found to be ≈0.005 v% which is lower than the already reported values (Table 1). We further studied the practical application of the NOCDs by testing MeOH spiked branded and unbranded alcoholic beverages. PL measurements done with unspiked unbranded beverages (Fig. 5) diluted with water, reveals PL signal quenching up to 50 and 60% with Artesanal mezcal (mAR) and Tobala Matatlan Oax Artesanal-Mezcal (mTMOA) respectively. Don Julio Blanco-Tequila (tDJB) and Mezcal Agasajo-Joven (mMAJG) con gusano showed no change in the PL signal.
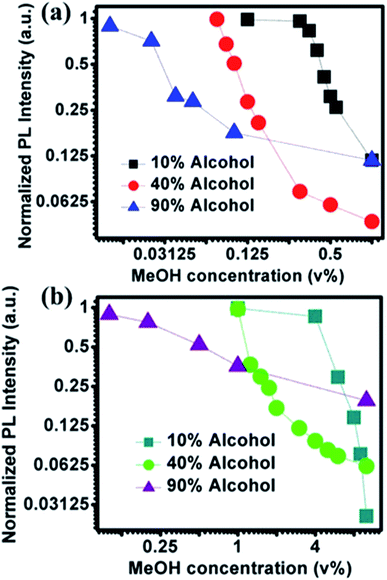 | ||
| Fig. 4 Effect of NOCDs concentration on detection range: peak PL signal for different v% of MeOH at three different fixed v% of alcohols (EtOH + MeOH) measured at two different concentrations of NOCDs mimicking the real alcoholic beverages (such as Beer with 3–12%, Tequila: 40% and Vodka: 90%) (a) 8 μL NOCDs and (b) 70 μL NOCDs. (Normalized PL intensity vs. wavelength for each alcohol% is given in Fig. S5 and S6†). | ||
| Probe | Technique | LOD | Ref. |
|---|---|---|---|
| CdS QDs | Photochemical | 0.14 μg L−1 | 22 |
| Methylobacterium organophilium/gold nanoparticles immobilized eggshell membrane | Gas chromatography | 0.047 mM | 23 |
| Alhagi maurorum L. (company) | Gas chromatography | 300 mg L−1 | 24 |
| Silicon epoxy coated platinum nanoparticles | Electrochemical | 10 mM | 25 |
| PdNPs@SBA-15-PrEn | Electrochemical | 12 μM | 26 |
| Carbon nanotube coated carbon fiber | Electrical split ring resonator gas sensing | 300 ppm | 27 |
| Functionalized pentacenequinone | Colorimetric and fluorometric dual-modal | 0.038% in ethanol | 28 |
| N,N-Bis(5-nitro-salicylaldehyde)azine | Fluorometric detection | 70 v% | 29 |
| Pd-doped SnO2 | Gas chromatography and a chemoresistive gas sensor | 1 ppm of methanol at 50% RH | 30 |
| NOCDs | Fluorometric | approx. 0.005 v% of MeOH in DI water | Present study |
| NOCDs | Fluorometric | 0.11 v% (visual detection) of MeOH in real alcoholic beverage (mAR) | Present study |
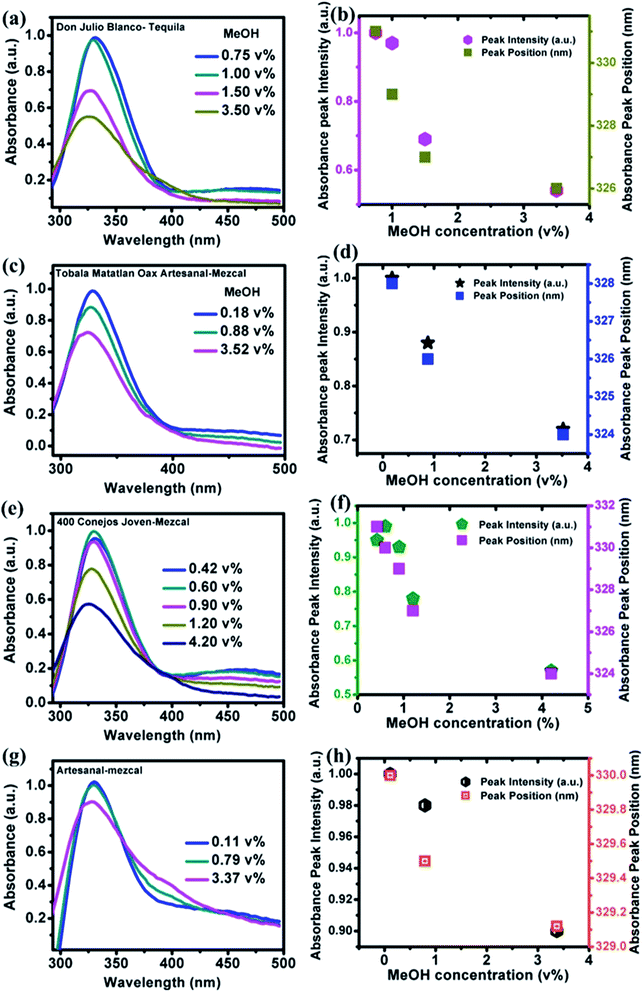
PL and absorbance spectra of NOCDs from MeOH spiked beverages are shown in Fig. 6 and 7 respectively. From the spectra, it is observed that the peak intensity decreased as the MeOH concentration increases, while the peak position shifted to lower wavelength for all the alcoholic beverages. Generally, in aprotic solvents, dipole–dipole interactions play a vital role in the peak shift.14 Herein, the observed peak shift is attributed to the dipole–dipole interactions between the functional groups present in NOCDs and –OH groups in alcoholic beverages. For a fixed concentration of nanoprobes (8 μL NOCDs in the total volume of 2 mL), the observed minimum detection limit of MeOH concentrations were 0.75, 0.18, 0.42 and 0.11 v% while the maximum detection limits (can be optionally enhanced by increasing the NOCDs' concentration) were 3.50, 3.52, 4.20 and 3.37 v% for Don Julio Blanco-Tequila (tDJB), Tobala Matatlan Oax Artesanal Mezcal (mTMOA), 400 Conejos Joven-Mezcal (m400CJ) and Artesanal mezcal (mAR) respectively. From Fig. 6g, the minimum visual detection of MeOH in mAR was found to be 0.11 v%, which is less as compared to MeOH in DI water, due to the effect of other alcohol species present in the mAR. As the reference is the PL signal of our nanoprobes in each pristine (unspiked beverage) sample, the proposed method can be implemented directly without doing pH studies and moreover sensitivity of our proposed (scalable, easy to synthesize and implement) nanoprobes is found to be much higher than the responses reported in the literature (shown in Table 1).22–30
3.3 Possible PL quenching mechanism
After the characterization of NOCDs in the presence of MeOH, the extinction of the signal can possibly be jointly/independently due to the following factors: (i) although luminescence signal from the small-sized (confirmed from TEM and HRTEM images of Fig. S2(a)† and 8(i) respectively) CDs has been attributed to the radiative recombination of electron–hole pairs on the surface of the particles,31 doping induced enhancement of photogenerated charge carriers and hence an enhanced emission in CDs have also been reported and explored recently (e.g., dopants such as N generate defect surface states).32 Depending on the dopant type and concentration, the nature and the number of defect states on the surface are expected to vary.20 As trapping of the photoinduced charge carriers can suppress the luminescence signal, it can be controlled by the electron-donating capacity of the surrounding molecules. The electron donor species can stabilize the holes on the surface.33,34 MeOH is an electron donor and being a smaller molecule than the other tested solvents, it can easily penetrate the functional groups surrounding the NOCDs for direct electron donation to the core and/or surface states. Fig. 8 shows the schematic representation of PL quenching mechanism of NOCDs in MeOH. (ii) HRTEM image (Fig. 8(ii)) reveal the aggregation of NOCDs in the presence of MeOH molecules, which contribute towards the PL quenching and the similar behaviour has been reported for the acetone molecules.12 | ||
| Fig. 8 Schematic representation of PL quenching mechanism (i) NOCDs in water and (ii) NOCDs in methanol. | ||
4. Conclusion
In summary, solvent-dependent fluorescence from NOCDs with an excitation wavelength-independent PL was synthesized via a simple hydrothermal route. Benefiting from the sensitivity towards solvent polarity, an efficient approach for the detection of MeOH content in alcoholic beverages has been demonstrated. After the calibration of the probing system, the tests performed on real alcoholic beverages (Tequila and Mezcal) from different sources (traditional as well as standard companies) validated the sensitivity and specificity of the proposed sensor. Therefore, it is believed that these NOCDs can be an effective tool for the rapid, highly sensitive and selective detection of MeOH, which will have a great prospect in alcoholic beverages in the future.Authors contribution
M. L., R. A. D. and N. K. R. B. contributed equally to the work.Conflicts of interest
The authors have no conflict of interest to declare.Acknowledgements
M. Latha & R. Aruna-Devi acknowledge the postdoctoral fellowships from PRODEP (Programa para el Desarrollo Profesional Docente en Educación Superior). V. A. acknowledges the financial support from CONACyT project Ciencias Basicas A1-S-30393. WLM acknowdeges the support from DGAPA-UNAM IN 11119.References
- S. K. Tulashie, A. P. Appiah, G. D. Torku, A. Y. Darko and A. Wiredu, Int. J. Food Contam., 2017, 4, 1–5 CrossRef
.
- M. R. L. V. Leal, T. L. Valle, J. C. Feltan, C. R. L. Carvalho, in Sugarcane bioethanol – R&D for Productivity and Sustainability, ed. E. Blucher, São Paulo, 2014, ch. 3, pp. 519–540 Search PubMed
.
- E. I. Ohimain, Springerplus, 2016, 5, 1–10 CrossRef CAS PubMed
.
- http://www.ipsnoticias.net/1994/12/mexico-muertos-por-bebida-envenenada-suman-ya-48/.
- M. L. Wang, J. T. Wang and Y. M. Choong, J. Food Compos. Anal., 2004, 17, 187–196 CrossRef CAS
.
- H. Li, H. Zhan, S. Fu, M. Liu and X. S. Chai, J. Chromatogr. A, 2007, 1175, 133–136 CrossRef CAS PubMed
.
- H. C. Hu and X. S. Chai, J. Chromatogr. A, 2012, 1222, 1–4 CrossRef CAS PubMed
.
- S. H. Chen, H. L. Wu, C. H. Yen, S. M. Wu, S. J. Lin and H. S. Kou, J. Chromatogr. A, 1998, 799, 93–99 CrossRef CAS
.
- A. Pérez-Ponce and S. Garrigues, Analyst, 2002, 123, 1817–1821 RSC
.
- T. M. Allen, T. M. Falconer, M. E. Cisper, A. J. Borgerding and C. W. Wilkerson, Anal. Chem., 2001, 73, 4830–4835 CrossRef CAS PubMed
.
- N. K. R. Bogireddy, V. Barba and V. Agarwal, ACS Omega, 2019, 4, 10702–10713 CrossRef CAS PubMed
.
- P. Das, S. Ganguly, S. Mondal, M. Bose, A. K. Das, S. Banerjee and N. C. Das, Sens. Actuators, B, 2018, 266, 583–593 CrossRef CAS
.
- M. Zheng, Y. Li, Y. Zhang and Z. Xie, RSC Adv., 2016, 6, 83501–83504 RSC
.
- D. Chao, W. Lyu, Y. Liu, L. Zhou, Q. Zhang, R. Deng and H. Zhang, J. Mater. Chem. C, 2018, 6, 7527–7532 RSC
.
- J. Wang, Y. Zhu and L. Wang, Chem. Rec., 2019, 19(10), 2083–2094 CrossRef CAS PubMed
.
- J. Wei, H. Li, Y. Yuan, C. Sun, D. Hao, G. Zheng and R. Wang, RSC Adv., 2018, 8, 37028–37034 RSC
.
- N. K. R. Bogireddy, R. C. Silva, M. A. Valenzuela and V. Agarwal, J. Hazard. Mater., 2020, 386, 121643 CrossRef CAS PubMed
.
- Z. H. Gao, Z. Z. Lin, X. M. Chen, H. P. Zhong and Z. Y. Huang, Anal. Methods, 2016, 8, 2297–2304 RSC
.
- J. Jiang, Y. He, S. Li and H. Cui, Chem. Commun., 2012, 48, 9634–9636 RSC
.
- J. Niu, H. Gao, L. Wang, S. Xin, G. Zhang, Q. Wang, L. Guo, W. Liu, X. Gao and Y. Wang, New J. Chem., 2014, 38, 1522–1527 RSC
.
- Y. Wang, H. Meng, M. Jia, Y. Zhang, H. Li and L. Feng, Nanoscale, 2016, 8, 17190–17195 RSC
.
- J. Barroso, B. D. Buitrago, L. Saa, M. Moller, N. Briz and V. Pavlov, Biosens. Bioelectron., 2018, 101, 116–122 CrossRef CAS PubMed
.
- G. Wena, X. Wena, S. Shuanga and M. M. F. Choi, Sens. Actuators, B, 2014, 201, 586–591 CrossRef
.
- M. N. Gazani, S. Shariati and A. Rafizadeh, Journal of Analytical & Pharmaceutical Research, 2017, 6(2), 00170 Search PubMed
.
- D.-S. Park, M.-S. Won, R. N. Goyal and Y.-B. Shima, Sens. Actuators, B, 2012, 174, 45–50 CrossRef CAS
.
- Z. Karimia, M. Shamsipurb, M. A. Tabrizic and S. Rostamniad, Anal. Biochem., 2018, 548, 32–37 CrossRef PubMed
.
- S. K. Singh, P. Azad, M. J. Akhtar and K. K. Kar, ACS Appl. Nano Mater., 2018, 19, 4746–4755 CrossRef
.
- M. Zhao, Y. Yue, C. Liu, P. Hui, S. He, L. Zhao and X. Zeng, Chem. Commun., 2018, 54, 8339–8342 RSC
.
- U. Saha, M. Dolai and G. S. Kumar, New J. Chem., 2019, 43, 8982 RSC
.
- J. van den Broek, S. Abegg, S. E. Pratsinis and A. T. Güntner, Nat. Commun., 2019, 10, 4220 CrossRef CAS
.
- H. Ding, J. Wei and H. Xiong, Nanoscale, 2014, 6, 13817–13823 RSC
.
- Q. Xu, J. Zhao and Y. Liu, J. Mater. Sci., 2015, 50, 2571–2576 CrossRef CAS
.
- X. Wang, L. Cao, F. Lu, M. J. Meziani, H. Li, G. Qi, B. Zhou, B. A. Harruff, F. Kermarrec and Y. Sun, Chem. Commun., 2009, 25, 3774–3776 RSC
.
- E. Sotelo-gonzalez, A. M. Coto-garcia, M. T. Fernandez-argüelles, J. M. Costa-fernandez and A. Sanz-medel, Sens. Actuators, B, 2012, 174, 102–108 CrossRef CAS
.
Footnote |
| † Electronic supplementary information (ESI) available. See DOI: 10.1039/d0ra02694h |
| This journal is © The Royal Society of Chemistry 2020 |

