 Open Access Article
In vitro anticancer activity of parent and nano-encapsulated samarium(III) complex towards antimicrobial activity studies and FS-DNA/BSA binding affinity
Saeid Asadpour *ab,
Zahra Aramesh-Boroujeni
 *cd and
Shohreh Jahani
 e
e
aDepartment of Chemistry, Faculty of Sciences, Shahrekord University, Shahrekord 115, Iran. E-mail: s.asadpour@sku.ac.ir
bNanotechnology Research Center, Shahrekord University, 8818634141, Shahrekord, Iran
cDepartment of Clinical Laboratory, AlZahra Hospital, Isfahan University of Medical Sciences, Isfahan, Iran. E-mail: zaramesh.boroujeni@gmail.com
dYoung Researchers and Elite Club, Najafabad Branch, Islamic Azad University, Najafabad, Isfahan, Iran
eNoncommunicable Diseases Research Center, Bam University of Medical Sciences, Bam, Iran
First published on 28th August 2020
Abstract
Based on the potential anticancer properties of lanthanide complexes, the anticancer activity of the Sm(III) complex containing a 2,2′-bipyridine ligand (bpy) and its interaction with FS-DNA (Fish-Salmon DNA) and BSA (Bovine Serum Albumin) were examined experimentally and by molecular docking in this paper. Absorption and fluorescence spectroscopic methods were used to define the thermodynamic parameters, binding constant (Kb), and the probable binding mechanism. It was concluded that the Sm complex interacts with FS-DNA through a minor groove with a Kb of 105 M−1. Also, the Kb for the BSA binding at 298 K was found to be 5.89 × 10⁵ M−1, showing relatively a high tendency of the Sm complex to DNA and BSA. Besides, the Sm complex was docked to BSA and DNA by the autodock program. The results of the docking calculations were in good agreement with the experimental examinations. Additionally, the antifungal and antibacterial properties of this complex were investigated. The anticancer tests on the effect of the Sm complex, starch nano-encapsulation, and lipid nano-encapsulation in MCF-7 and A-549 cell lines were performed by the MTT method. It can be observed that the Sm complex and its nanocarriers presented a selective inhibitory effect on various cancer cell growths.
1. Introduction
Lanthanide coordination chemistry has developed to cater to a varied range of applications. These compounds are used in luminescent biology sensors, materials science, and self-assemblies of contrast-enhancing factors, as well as in medicine such as anticancer, antibacterial, and fungicidal properties.1–7 The binding of lanthanide compounds with macromolecules (e.g., DNA and proteins) is an exciting part for both biochemists and inorganic chemists.8,9The interactions of compounds with DNA propose that these compounds can have potential pharmaceutical and biological activities that depend on the affinity of the interaction mode with DNA. When designing potential antitumor factors, non-intercalation compounds are more favorable than intercalation compounds. Hence, abundant compounds produce considerable active antitumor factors that bind through grooves of DNA. Given the success in the tumor therapy of DNA groove binders, it is considered valuable to investigate the existing compounds as groove binders.8 Furthermore, serum albumins are the most abundant protein in blood that show significant role in the distribution, metabolism, and transport of various exogenous compounds (containing drugs, amino acids, fatty acids, and pharmaceuticals).10
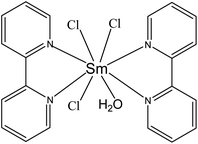
In continuation of recent research work,11–17 the synthesis, characterization, and interaction of the Sm-complex, [Sm(bpy)2Cl3(OH2)] (Scheme 1), with FS-DNA and BSA by different types of experimental techniques and docking calculation are reported in this paper. Moreover, the parent, lipid nano-encapsulated (LNEP) and starch nano-encapsulated (SNEP) forms of the Sm complex were prepared, and the anti-cancer properties of these compounds were assessed.
2. Experimental
2.1. Materials and instrumentation
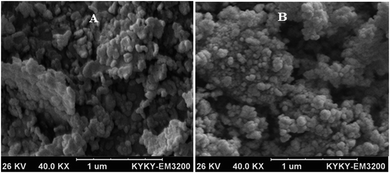
FS-DNA was purchased from Fluka Biochemika, and other materials were obtained from Aldrich Chem. Co. and Merck. All solvents and chemicals were of analytical grade. The FT-IR spectra were performed as KBr pellets by a SHIMADZU spectrometer. The electronic spectra were carried out by a JASCO (V-670) spectrophotometer. Emission spectra were performed by PERKIN ELMER, LS-3. A model Perkin Elmer 240 elemental analyzer carried out the CHN (elemental) analyses, and a Bruker 400 Ultrashield NMR recorded the NMR spectra in D2O. For determining the percentage of the Sm complex in LNEP and SNEP, these compounds were analyzed by an ICP-Spectro ciros CCD instrument (inductively coupled plasma spectrometer). The surface morphology of the LNEP and SNEP nanocomposites was examined with SEM, KYKY, EM 3200.2.2. Synthesis and characterization of the samarium complex
The Sm complex was synthesized in accordance with the literature method.18 An ethanolic solution (5 mL) of samarium chloride (100 mg, 2.74 × 10⁻⁴ mol) was added dropwise to the 2,2′-bipyridine (85.6 mg, 5.48 × 10⁻⁴ mol) dissolved in ethanol (5 mL). The resultant mixture was refluxed at 60 °C for four hours. After filtering the resulting precipitate, it was washed with cold ethanol and dried (yield 76%). Anal. found (calc.) (C20H18Cl3N4OSm): C, 40.75 (40.90); H, 3.10 (3.07); N, 9.64 (9.54). FT-IR (cm−1): 1596 (C![[double bond, length as m-dash]](https://www.rsc.org/images/entities/char_e001.gif) N), 1434–1476 (C
N), 1434–1476 (C![[double bond, length as m-dash]](https://www.rsc.org/images/entities/char_e001.gif) C), 735–766 (C–H). 1H NMR (400 MHz, D2O): δ (ppm) 4.73 (H2O, broad) and 8.32, 7.68, 7.22 (H-bpy, broad). Electronic absorption (H2O): 231, 280 nm.
C), 735–766 (C–H). 1H NMR (400 MHz, D2O): δ (ppm) 4.73 (H2O, broad) and 8.32, 7.68, 7.22 (H-bpy, broad). Electronic absorption (H2O): 231, 280 nm.
2.3. FS-DNA and BSA binding
All binding studies of the Sm complex were performed in tris(hydroxymethyl)-aminomethane at pH 7.2 (Tris–HCl buffer having NaCl (50 mM) and Tris (5 mM) and adjusted with HCl in pH = 7.2). The DNA concentration was defined spectrophotometrically with ε260 = 6600 M−1 cm−1 (the molar extinction coefficient at 260 nm). The absorbance ratio (A260/A280) was monitored to check the DNA purity. The absorbance proportion at 260 nm and 280 nm was in the range 1.8 < A260/A280 < 2 and showed that the DNA was free of protein and impurities.19Moreover, the concentrations of EtBr and BSA were found by UV-vis spectrometry by assuming ε480 = 5450 M−1 cm−1 and ε280 = 44![[thin space (1/6-em)]](https://www.rsc.org/images/entities/char_2009.gif) 300 M−1 cm−1 for EtBr and BSA, respectively.20,21 All solutions were not used for more than four days, and also stored at four degrees Celsius. The stability of the Sm complex in aqueous solution was tested by monitoring the absorption spectrum of the Sm complex at different incubation times. The slight changes of the spectra after 48 hours showed the stability of the Sm complex during the interaction studies.
300 M−1 cm−1 for EtBr and BSA, respectively.20,21 All solutions were not used for more than four days, and also stored at four degrees Celsius. The stability of the Sm complex in aqueous solution was tested by monitoring the absorption spectrum of the Sm complex at different incubation times. The slight changes of the spectra after 48 hours showed the stability of the Sm complex during the interaction studies.
2.4. Docking setup
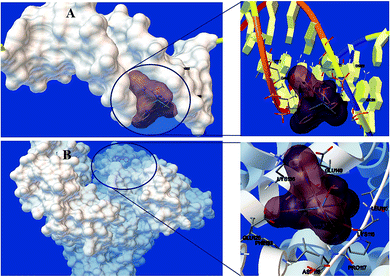
The Auto Dock 4.2.6 program was applied to perform the docking calculations by the Lamarckian genetic algorithm. The BSA structure (code: 3v03) and DNA sequence duplex (code: 1BNA) were obtained from the Protein Data Bank. The quantum chemical software was employed to optimize the Sm complex structure by DFT.21,22 During the docking process, all complex bonds were kept free, while BSA and DNA stayed rigid. The grid map of 70 × 70 × 70 points and 0.375 Å spacing were made. Next, 200 independent calculations with 25 million energy evaluations were obtained.232.5. Cytotoxicity
The LNEP and SNEP of the Sm complex were synthesized in accordance with the literature.24 The anticancer properties of the terbium complexes, LNEP and SNEP, were studied by MTT examination on the A-549 and MCF-7 cell lines, as explained previously.9 The unwanted cytotoxicity potential of these compounds was also studied on normal human fibroblast (HFB) cells. These cell lines were incubated for one day in a humidified 5% CO2 incubator at 37 °C, in the presence of different concentrations of the Sm complex, SNEP, and LNEP. After this step, the solution of MTT (10 μL, 12 mM) was added, and then the plates were incubated for four hours. The culture media was rejected. After the addition of DMSO (50 μL), the wells were washed with phosphate-buffered saline and incubated for ten minutes. IC50 is the 50% inhibition concentration, which is calculated by an ELISA reader at 545 nm through the following eqn (1):25| % Cell cytotoxicity = [1 − (drug absorption/control absorption)] × 100 | (1) |
For evaluating the influence of SNEP and LNEP on the anticancer properties, the cellular penetration examination was performed. The cell lines of A-549, MCF-7 and HFB with the cell culture (100 μL) medium including 7.51 μg Sm complex (128 μM), 12.26 μg SNEP or 11.51 μg LNEP (equivalent to 7.51 μg Sm complex) were incubated for one day in a 5% CO2 incubator. After eliminating the supernatant, these mixes (the cells having Sm-complex) were treated with CHCl3 and HNO3. All studies were done three times. Two commercial anti-cancer drugs of 5-fluorouracil (5-FU) and methotrexate were used as a positive control under the same conditions.26
2.6. Microbiological investigations
The zone of inhibition testing, the plate-counting technique, the minimum inhibitory concentration (MIC), and the inoculation time were applied to determine the antimicrobial activity of the Sm-complex against MRSA, VRE, E. faecium, E. faecalis, P. aeruginosa, A. baumannii, E. coli, K. pneumonia, S. typhi, and fungi C. albicans.27,28 In addition, chloramphenicol was used as a positive control.In the inhibition zone diameter method, a stock inoculum with 700 CFU mL−1 was applied for dyes on the Muller Hinton (MH) agar plate. Afterward, discs of filter paper saturated with the antimicrobial matter (Sm-complex, 5 mg mL−1) were transported on the agar. The incubation was carried out at 37 °C for one day to take the zone of inhibition. The broth dilution technique was used for the plate-counting methods and MIC. Tubes containing MH broth (5.0 mL) with ten-fold dilutions of antimicrobial agents (0.005–50 mg L−1) were inoculated with 700 CFU mL−1 of bacteria and fungi. The tubes were also incubated at 37 degrees centigrade for one day. Then, the incubation tubes were studied without shaking for visible turbidity. The MIC was found as the lowest dilution of this compound that produced no noticeable turbidity.
After the minimum inhibitory concentration was detected, 0.1 mL of inoculum from the content of the tube, without visible turbidity was subculture onto the agar plate and also incubated for one day. Then, the number of grown colonies on the subculture was contrasted to the number of CFU mL−1 in the initial inoculum. The minimum bactericidal concentration (MBC) was referred to as the lowest dilution of the lanthanide compound, which allowed for less than 0.1% of the initial inoculum to live. These studies were performed three times.
3. Results and discussion
3.1. Spectral characterization
In Fig. 1(A), the infrared spectrum of the free ligand was compared with that of the Sm complex to define the deviances that may have to happen with complexation. The infrared spectrum of 2,2′-bipyridine indicated the peaks in the frequency range of 1596, 1434–1476, and 735–766 cm−1 for ν(C![[double bond, length as m-dash]](https://www.rsc.org/images/entities/char_e001.gif) N), ν(C
N), ν(C![[double bond, length as m-dash]](https://www.rsc.org/images/entities/char_e001.gif) C) and ν(C–H), respectively. In the Sm complex, these bands shift significantly to a lower wavenumber. Moreover, the IR spectrum of the Sm complex indicated new peaks at 423 and 3000–3356 cm−1 ascribable to the Sm–N and O–H stretching vibrations, respectively.29
C) and ν(C–H), respectively. In the Sm complex, these bands shift significantly to a lower wavenumber. Moreover, the IR spectrum of the Sm complex indicated new peaks at 423 and 3000–3356 cm−1 ascribable to the Sm–N and O–H stretching vibrations, respectively.29
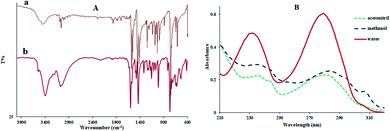 | ||
| Fig. 1 (A) FT-IR spectra of (a) 2,2′-bipyridine ligand, (b) Sm complex. (B) The UV-vis spectra of the Sm-complex in different solvents ([Sm-complex] = 1 × 10⁻⁵ M). | ||
Fig. 1(B) displays the UV-vis spectra of the Sm complex in various solvents, where the changes of the maximum absorption wavelength (λmax) were apparent. The polarity of the solvent was the chief cause, which affects λmax. Depending on the solute–solvent bindings, the energy of the excited and ground states of the solute may decrease or increase. Therefore, λmax changes to higher or lower values. The UV-vis spectra of the Sm complex indicated two peaks in the range of 215–320 nm. From Fig. 1(B), by replacing the solvent from water to acetonitrile, a redshift of the n→π* transition band (λmax values were 280, 284, and 281 nm in water, acetonitrile, and methanol, respectively) was detected. The 1H NMR spectrum of the Sm-complex displayed three broad bands at 7.22, 7.68, and 8.32 ppm, which were equivalent to the aromatic ring protons, and a broad band at 4.73 ppm equivalent to the hydrogen of water. In the Sm complex, the 1H NMR spectra underwent massive changes and shifts in comparison with the free ligand spectra.30 This shows a reduction in the deshielding effect of the electron density in the aromatic ring after coordination to the Sm ion.
3.2. DNA binding experiments
| [Q]/(εa − εf) = [Q]/(εb − εf) + 1/Kb(εb − εf) | (2) |
In the above equation, the extinction coefficients εf, εb, and εa correspond to the extinction coefficients for the Sm-complex in a free state, the fully bound form, and Aobsd/[Complex], respectively, and [Q] is the FS-DNA concentration. Kb at 298 K was 1.20 × 10⁵ M−1 (Fig. 2(B)), which was lower than that of the classic intercalation compound, EtBr (1.4 × 10⁶ M−1).33 The binding mode between the Sm-complex and FS-DNA (non-intercalation) was revealed to be different from that of EtBr (intercalation).
Quenching can occur by various mechanisms, which are generally categorized as dynamic (the collisional procedure) and static quenching (the formation of the fluorophore–quencher system in the ground state). Generally, the static and dynamic quenching mechanisms were determined by the excited-state lifetime and study of the temperature on the Stern–Volmer equation (eqn (3)).34,35 eqn (3) explains the emission quenching process:
 | (3) |
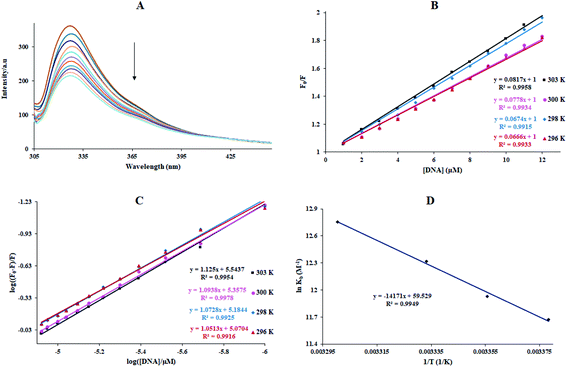
In the above equation, KSV is the quenching constant, [Q] is the FS-DNA concentration, F0 and F express the emission intensity in the absence and presence of FS-DNA, respectively. This equation τ0 is the fluorophore lifetime without any quencher (τ0 = 108 s) and kq is the fluorophore quenching rate constant. The KSV and kq values were found at various temperatures, and these values are presented in Table 1 and Fig. 3(B). In this study, the kq amounts (in the area of 1012 M−1 s−1) were higher than the maximum of kq in the biomolecules (2.0 × 10¹⁰ M−1 s−1 (ref. 36)), indicating that the emission quenching generally occurred from static quenching instead of collision quenching. From Table 1, with the temperature increasing from 296 K to 303 K, KSV slightly increased from 6.66 × 10⁵ M−1 to 8.17 × 10⁵ M−1, while the high value of KSV was due to the collision quenching. Thus, we proposed that the probable quenching mechanism may be static. The binding stoichiometry (n) and Kb for the binding between FS-DNA and the Sm complex were determined using the following equation:
 | (4) |
| T (K) | KSV × 10−4 (M−1) | kq × 10−12 (M−1 s−1) | n | Kb × 10−5 (M−1) | ΔG° (kJ mol−1) | ΔH° (kJ mol−1) | ΔS° (J mol−1 K−1) | |
|---|---|---|---|---|---|---|---|---|
| UV | Fluorescence | |||||||
| 296 | 6.66 ± 0.04 | 6.66 ± 0.04 | 1.05 | 1.17 ± 0.03 | −28.73 ± 0.02 | |||
| 298 | 6.74 ± 0.05 | 6.74 ± 0.05 | 1.07 | 1.20 ± 0.04 | 1.51 ± 0.05 | −29.55 ± 0.05 | 117.82 ± 0.05 | 494.92 ± 0.03 |
| 300 | 7.78 ± 0.03 | 7.78 ± 0.03 | 1.09 | 2.24 ± 0.02 | −30.72 ± 0.03 | |||
| 303 | 8.17 ± 0.02 | 8.17 ± 0.02 | 1.12 | 3.47 ± 0.05 | −32.13 ± 0.04 | |||
The Kb values of the Sm-complex were found at 296, 298, 301, and 303 K (Table 1 and Fig. 3(C)). Since the n values were close to 1, this showed that there was just one binding site. The Kb values confirmed the considerable high affinity of FS-DNA to the Sm-complex.
According to the values of the entropy change (ΔS°) and enthalpy change (ΔH°), the nature of the interaction between the complex and biomacromolecules (such as proteins and DNA) can be concluded as follows: (1) ΔS° > 0 and ΔH° close to 0, electrostatic interactions; (2) ΔS° < 0 and ΔH° < 0, hydrogen bond and van der Waals interactions; (3). ΔS° > 0 and ΔH° > 0, hydrophobic forces. For discriminating the binding model between FS-DNA and the Sm complex, ΔS°, ΔH° and the free energy change (ΔG°) can be given by the following eqn (5) and (6):
 | (5) |
| ΔG° = ΔH° − TΔS° | (6) |
The linear van't Hoff plot based on ln![[thin space (1/6-em)]](https://www.rsc.org/images/entities/char_2009.gif) K against 1/T (Fig. 3(D)) allows for acquiring ΔH°, ΔS°, and ΔG° (eqn (6)). Table 1 reveals the thermodynamic values of the Sm complex. The positive signs of ΔS° and ΔH° exposed that hydrophobic binding plays the main role in the interaction of FS-DNA with the Sm complex. Also, the negative value of ΔG° showed that the DNA binding process was spontaneous.
K against 1/T (Fig. 3(D)) allows for acquiring ΔH°, ΔS°, and ΔG° (eqn (6)). Table 1 reveals the thermodynamic values of the Sm complex. The positive signs of ΔS° and ΔH° exposed that hydrophobic binding plays the main role in the interaction of FS-DNA with the Sm complex. Also, the negative value of ΔG° showed that the DNA binding process was spontaneous.
3.3. Protein-binding
The Kb at 298 K was found to be 1.06 × 10⁵ M−1 for the BSA–Sm complex. It is well-known that Kb in the range of 104 to 106 M−1 is acceptable for the carrier-drug compounds.20 Thus, the Kb value of the Sm complex shows that this protein can be considered a suitable carrier for the Sm complex transfer in blood.
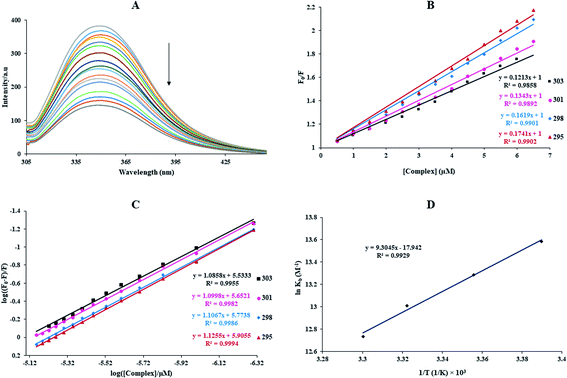
For studying the quenching process, the emission quenching data of kq and KSV are given by the eqn (3), and also revealed in Table 2 and Fig. 7(B). As shown in Fig. 7 and Table 2, KSV was reduced and the kq values were more significant than 2.0 × 10¹⁰ M−1 s−1 (the maximum kq of the biomolecules) with increased temperature. It is plausible that the possible quenching mechanism of the interaction of BSA to the Sm complex was static.
| T (K) | KSV × 10−5 (M−1) | kq × 10−12 (M−1 s−1) | n | Kb × 10−5 (M−1) | ΔG° (kJ mol−1) | ΔH° (kJ mol−1) | ΔS° (J mol−1 K−1) | |
|---|---|---|---|---|---|---|---|---|
| UV | Fluorescence | |||||||
| 295 | 1.74 ± 0.05 | 1.74 ± 0.05 | 1.12 | 7.94 ± 0.04 | −33.32 ± 0.03 | |||
| 298 | 1.62 ± 0.04 | 1.62 ± 0.04 | 1.10 | 1.06 ± 0.03 | 5.89 ± 0.04 | −32.92 ± 0.04 | −77.35 ± 0.03 | −149.17 ± 0.04 |
| 301 | 1.34 ± 0.04 | 1.34 ± 0.04 | 1.09 | 4.47 ± 0.05 | −32.55 ± 0.04 | |||
| 303 | 1.21 ± 0.03 | 1.21 ± 0.03 | 1.08 | 3.39 ± 0.02 | −32.07 ± 0.05 | |||
The numbers of binding sites and the Kb at different temperatures for the binding of BSA with the complex can be calculated by eqn (4), and is indicated in Table 2 and Fig. 7(C). The Kb value for the Sm complex was determined to be 5.89 ± 0.04 × 10⁵ M−1 at room temperature. The n in BSA was approximated to 1, showing that a single site in BSA was reactive to the Sm-complex. The result showed that there was a strong interaction force of BSA with the Sm complex.
The van't Hoff equation was performed to give the thermodynamics parameters (ΔS°, ΔH°, and ΔG°) of the Sm complex–BSA system. The obtained thermodynamic parameters for the interaction of BSA with the Sm complex are listed in Table 2. Both negative signs of ΔS° and ΔH° indicated that the BSA–complex interaction was an entropic and exothermic reducing process, and the negative signs of ΔG° showed that the BSA binding procedure was spontaneous. In addition, hydrogen bonds and van der Waals forces play a significant role in this procedure.43
 | (7) |
| R06 = 8.79 × 10⁻²⁵K2n−4∅J | (8) |
 | (9) |
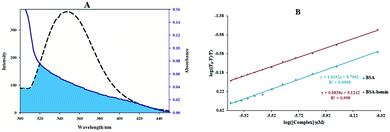
Herein, ε(λ) is the molar electronic coefficient of the Sm complex at wavelength λ, and F(λ) is the BSA fluorescence intensity. In the study conditions, K2 = 2/3, n = 1.336 and ∅ = 0.15.44 Accordingly, the R0, r, J values, and E were determined and are listed in Table 3. All of the r and R values are 0.5R0 < r < 1.5R0, and on the 2–8 nm scale, showing that the energy transfer between BSA and Sm-complex has occurred.39
| E | J (cm3 L mol−1) × 10−13 | R0 (nm) | r (nm) |
|---|---|---|---|
| 0.22 | 4.65 | 2.23 | 2.77 |
3.4. Docking studies
| Macromolecule | Binding energy (kcal mol−1) | Ki (μM) |
|---|---|---|
| DNA | −7.51 | 3.25 |
| BSA | −6.95 | 8.69 |
3.5. Anticancer activity
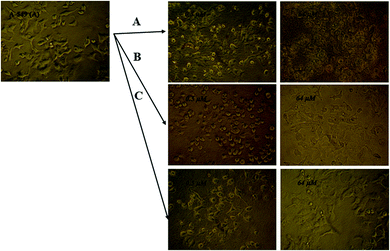 | ||
| Fig. 11 Microscopic photographs of the A-549 cancer cells in the presence and absence of various concentrations of (A) LNEP, (B) SNEP and (C) Sm-complex. | ||
 | ||
| Fig. 12 Plots of cytotoxicity percentage various concentrations of the Sm-complex, SNPE and LNEP against the MCF-7 and A-549 cell lines. | ||
| Cell lines | The drug concentration causing a 50% reduction in cellular viability (IC50) (μg mL−1) | ||||
|---|---|---|---|---|---|
| Sm-complex | SNEP | LNEP | 5-fluorouracil | Methotrexate | |
| MCF-7 | 5.78 | 3.42 | 1.65 | 47.5 | 27.9 |
| A-549 | 9.5 | 6.91 | 3.35 | 43.9 | 26.9 |
| HFB | 105.4 | 103.2 | 104.6 | 50.8 | 36.0 |
The comparison of the anticancer activity and cytotoxicity effects of 5-fluorouracil and methotrexate as well-known commercial anticancer drugs, with the Sm-complex, SNEP, and LNEP (Table 5), emphasized the comparable anticancer activity and reduced toxicity of the Sm-complex and its nano-carriers.
3.6. Antimicrobial assay
Different methods were used to investigate the antimicrobial activity of the Sm-complex against bacteria and fungi. Table 6 reports the values of the zone of inhibition, inoculation time, MBC, and MIC. These complexes displayed significantly enhanced properties against different bacteria and fungi, especially C. albicans, A. baumannii, E. coli, and MRSA.| Bacteria type | Bacteria or fungi | Inoculation time (h) | Zone of inhibition (mm) | MIC (μg mL−1) | MBC (mg mL−1) |
|---|---|---|---|---|---|
| Fungi | C. albicans | 24 | 40 | 31 | 1.0 |
| Gram-negative | E. coli | 48 | 12 | 62 | 4.0 |
| A. baumannii | 48 | 25 | 31 | 2.0 | |
| P. aeruginosa | 48 | 21 | 62 | 4.0 | |
| K. pneumoniae | 24 | 18 | 125 | 1.0 | |
| S. typhi | 24 | 19 | 62 | 2.0 | |
| Gram-positive | VRE | 24 | 28 | 125 | 4.0 |
| E. faecalis | 48 | 26 | 31 | 4.0 | |
| E. faecium | 48 | 24 | 62 | 4.0 | |
| MRSA | 24 | 32 | 62 | 2.0 |
The MIC values for MRSA, S. typhi, P. aeruginosa, E. coli and C. albicans were found to be 62, 62, 62, 62 and 31 μg mL−1 for Sm-complex, respectively, which are very close to the positive control chloramphenicol. The MIC values for chloramphenicol are 62, 125, 31, 62 and >1000 μg mL−1, respectively, for MRSA, S. typhi, P. aeruginosa, E. coli and C. albicans.
An effect of this lanthanide complex concentration with 700 CFU of S. typhi illustrations is shown in Fig. 13(A). The substantial decrease in the extent of bacterial colonies was detected in 4.0 mg of the Sm-complexes, displaying the antimicrobial properties upon increasing the Sm complex concentrations. The MH standard with 5 mg mL−1 of Sm-complex and 700 CFU of S. typhi supplemented for various time distances. Fig. 13(B) and Table 6 showed that the S. typhi colonies were killed entirely after 24 hours of injection of the Sm-complex, and the calculation of the bacterial reduction was nearly 100% after 4–48 hours of vaccination.
4. Conclusion
In this study, the strength and mechanism of the interaction of the Sm complex with DNA and BSA were comprehensively examined by different methods, including electronic spectroscopy, fluorescence spectra, and docking examinations. DNA binding studies suggested that the Sm-complex interacts with the minor groove, which was further affirmed by theoretical investigations. The Kb values showed the high tendency of FS-DNA to bind the Sm complex. The study of the interaction of BSA to the Sm-complex proved that the binding process is driven by enthalpy and is spontaneous. Also, the primary binding forces are hydrogen bonding and van der Waals interactions. According to the site marker competitive study and docking results, the Sm complex bound to BSA in subdomain IB (site III). Additionally, this complex illustrates significant antifungal and antibacterial properties. Also, the drug carrier forms of the Sm complex (SNEP and LNEP) were prepared. All of these compounds exhibited significant antitumor properties against the cell lines, A-549 and MCF-7. The anticancer activity of LNEP and SNEP was higher than that of the Sm complex because of their higher cellular diffusion. The findings of this paper suggest the Sm complex as a suitable candidate for potential applications as an antitumor and antimicrobial agent.Conflicts of interest
The authors declare that they have no known competing financial interests or personal relationships that could have appeared to influence the work reported in this paper. Also, there are no conflicts of interest.Acknowledgements
This paper has been financially supported by the research deputy of the University of Shahrekord (the grant number = 141/2753).References
- Z.-F. Chen, M.-X. Tan, Y.-C. Liu, Y. Peng, H.-H. Wang, H.-G. Liu and H. Liang, Synthesis, characterization and preliminary cytotoxicity evaluation of five lanthanide(III)–plumbagin complexes, J. Inorg. Biochem., 2011, 105(3), 426–434 CrossRef CAS PubMed.
- I. Kostova and T. Stefanova, Synthesis, characterization and cytotoxic/cytostatic activity of La(III) and Dy(III) complexes, J. Trace Elem. Med. Biol., 2010, 24(1), 7–13 CrossRef CAS PubMed.
- K. H. Thompson and C. Orvig, Editorial: Lanthanide compounds for therapeutic and diagnostic applications, Chem. Soc. Rev., 2006, 35(6), 499 RSC.
- S. P. Fricker, The therapeutic application of lanthanides, Chem. Soc. Rev., 2006, 35(6), 524–533 RSC.
- T. Premkumar and S. Govindarajan, Antimicrobial study on trivalent lighter rare-earth complexes of 2-pyrazinecarboxylate with hydrazinium cation, World J. Microbiol. Biotechnol., 2006, 22(10), 1105–1108 CrossRef CAS.
- A. J. Amoroso and S. J. A. Pope, Using lanthanide ions in molecular bioimaging, Chem. Soc. Rev., 2015, 44(14), 4723–4742, 10.1039/C4CS00293H.
- A. Cârâc, R. Boscencu, R. M. Dinică, J. F. Guerreiro, F. Silva, F. Marques, M. P. C. Campello, C. Moise, O. Brîncoveanu and M. Enăchescu, Synthesis, characterization and antitumor activity of two new dipyridinium ylide based lanthanide(III) complexes, Inorg. Chim. Acta, 2018, 480, 83–90 CrossRef.
- K. Raja, A. Suseelamma and K. H. Reddy, Synthesis, spectral properties and DNA binding and nuclease activity of lanthanide(III) complexes of 2-benzoylpyridine benzhydrazone: X-ray crystal structure, Hirshfeld studies and nitrate-π interactions of cerium(III) complex, J. Chem. Sci., 2016, 128(1), 23–35 CrossRef CAS.
- D. Yinhua, M. M. Foroughi, Z. Aramesh-Boroujeni, S. Jahani, M. Peydayesh, F. Borhani, M. Khatami, M. Rohani, M. Dusek and V. Eigner, The synthesis, characterization, DNA/BSA/HSA interactions, molecular modeling, antibacterial properties, and in vitro cytotoxic activities of novel parent and niosome nano-encapsulated Ho(III) complexes, RSC Adv., 2020, 10(39), 22891–22908, 10.1039/D0RA03436C.
- X. Hu, Z. Tong, Y. Wang, D. Liao, Y. Yin and F. Wen, Investigation of the interaction between protein and europium doped polymer, J. Macromol. Sci., Part A: Pure Appl.Chem., 2019, 56(1), 42–51 CrossRef CAS.
- Z. Aramesh-Boroujeni, A.-K. Bordbar, M. Khorasani-Motlagh, N. Fani, E. Sattarinezhad and M. Noroozifar, Computational and experimental study on the interaction of three novel rare earth complexes containing 2,9-dimethyl-1,10-phenanthroline with human serum albumin, J. Iran. Chem. Soc., 2018, 15(7), 1581–1591, DOI:10.1007/s13738-018-1356-5.
- Z. Aramesh-Boroujeni, A.-K. Bordbar, M. Khorasani-Motlagh, E. Sattarinezhad, N. Fani and M. Noroozifar, Synthesis, characterization, and binding assessment with human serum albumin of three bipyridine lanthanide(III) complexes, J. Biomol. Struct. Dyn., 2019, 37(6), 1438–1450, DOI:10.1080/07391102.2018.1464959.
- Z. Aramesh-Boroujeni, S. Jahani, M. Khorasani-Motlagh, K. Kerman, N. Aramesh, S. Asadpour and M. Noroozifar, Experimental and theoretical investigations of Dy(III) complex with 2,2′-bipyridine ligand: DNA and BSA interactions and antimicrobial activity study, J. Biomol. Struct. Dyn., 2019, 1–18, DOI:10.1080/07391102.2019.1689170.
- Z. Aramesh-Boroujeni, S. Jahani, M. Khorasani-Motlagh, K. Kerman and M. Noroozifar, Evaluation of DNA, BSA binding, DNA cleavage and antimicrobial activity of ytterbium(III) complex containing 2,2'-bipyridine ligand, J. Biomol. Struct. Dyn., 2020, 38(6), 1711–1725, DOI:10.1080/07391102.2019.1617788.
- Z. Aramesh-Boroujeni, S. Jahani, M. Khorasani-Motlagh, K. Kerman and M. Noroozifar, Evaluation of parent and nano-encapsulated terbium(III) complex toward its photoluminescence properties, FS-DNA, BSA binding affinity, and biological applications, J. Trace Elem. Med. Biol., 2020, 61, 126564, DOI:10.1016/j.jtemb.2020.126564.
- Z. Aramesh-Boroujeni, N. Aramesh, S. Jahani, M. Khorasani-Motlagh, K. Kerman and M. Noroozifar, Experimental and computational interaction studies of terbium(III) and lanthanide(III) complexes containing 2,2′-bipyridine with bovine serum albumin and their in vitro anticancer and antimicrobial activities, J. Biomol. Struct. Dyn., 2020, 1–12, DOI:10.1080/07391102.2020.1792988.
- Z. Aramesh-Boroujeni, S. Jahani, M. Khorasani-Motlagh, K. Kerman and M. Noroozifar, Parent and nano-encapsulated ytterbium(III) complex toward binding with biological macromolecules, in vitro cytotoxicity, cleavage and antimicrobial activity studies, RSC Adv., 2020, 10(39), 23002–23015, 10.1039/D0RA03895D.
- H. A. Hussain, A. A. Ansari and K. Iftikhar, Optical absorption and NMR spectroscopic studies on paramagnetic trivalent lanthanide complexes with 2,2′-bipyridine.: the solvent effect on 4f–4f hypersensitive transitions, Spectrochim. Acta, Part A, 2004, 60(4), 873–884 CrossRef CAS.
- H.-J. Yu, S.-M. Huang, L.-Y. Li, H.-N. Jia, H. Chao, Z.-W. Mao, J.-Z. Liu and L.-N. Ji, Synthesis, DNA-binding and photocleavage studies of ruthenium complexes [Ru(bpy)2(mitatp)]2+ and [Ru(bpy)2(nitatp)]2+, J. Inorg. Biochem., 2009, 103(6), 881–890, DOI:10.1016/j.jinorgbio.2009.03.005.
- M. Anjomshoa, S. J. Fatemi, M. Torkzadeh-Mahani and H. Hadadzadeh, DNA- and BSA-binding studies and anticancer activity against human breast cancer cells (MCF-7) of the zinc(II) complex coordinated by 5,6-diphenyl-3-(2-pyridyl)-1,2,4-triazine, Spectrochim. Acta, Part A, 2014, 127, 511–520, DOI:10.1016/j.saa.2014.02.048.
- E. Moradinia, M. Mansournia, Z. Aramesh-Boroujeni and A. K. Bordbar, New transition metal complexes of 9,10-phenanthrenequinone p-toluyl hydrazone Schiff base: synthesis, spectroscopy, DNA and HSA interactions, antimicrobial, DFT and docking studies, Appl. Organomet. Chem., 2019, 33(5), e4893, DOI:10.1002/aoc.4893.
- F. Neese, The ORCA program system, Wiley Interdiscip. Rev.: Comput. Mol. Sci., 2012, 2(1), 73–78 CAS.
- G. M. Morris, D. S. Goodsell, R. S. Halliday, R. Huey, W. E. Hart, R. K. Belew and A. J. Olson, Automated docking using a Lamarckian genetic algorithm and an empirical binding free energy function, J. Comput. Chem., 1998, 19(14), 1639–1662 CrossRef CAS.
- S. Dianat, A. Bordbar, S. Tangestaninejad, B. Yadollahi, S. Zarkesh-Esfahani and P. Habibi, In vitro antitumor activity of parent and nano-encapsulated mono cobalt-substituted Keggin polyoxotungstate and its ctDNA binding properties, Chem.-Biol. Interact., 2014, 215, 25–32 CrossRef CAS PubMed.
- M. Mohamadi, A. Hassankhani, S. Y. Ebrahimipour and M. Torkzadeh-Mahani, In vitro and in silico studies of the interaction of three tetrazoloquinazoline derivatives with DNA and BSA and their cytotoxicity activities against MCF-7, HT-29 and DPSC cell lines, Int. J. Biol. Macromol., 2017, 94, 85–95, DOI:10.1016/j.ijbiomac.2016.09.113.
- A. Abbasi Kajani, A.-K. Bordbar, M. A. Mehrgardi, S. H. Zarkesh-Esfahani, H. Motaghi, M. Kardi, A. R. Khosropour, J. Ozdemir, M. Benamara and M. H. Beyzavi, Green and Facile Synthesis of Highly Photoluminescent Multicolor Carbon Nanocrystals for Cancer Therapy and Imaging, ACS Appl. Bio Mater., 2018, 1(5), 1458–1467 CrossRef CAS.
- E. Köksal, H. Tohma, Ö. Kılıç, Y. Alan, A. Aras, I. Gülçin and E. Bursal, Assessment of antimicrobial and antioxidant activities of Nepeta trachonitica: analysis of its phenolic compounds using HPLC-MS/MS, Sci. Pharm., 2017, 85(2), 24 CrossRef PubMed.
- U. M. Kocyigit, Y. Budak, M. B. Gürdere, N. Dürü, P. Taslimi, İ. Gülçin and M. Ceylan, Synthesis and investigation of anticancer, antibacterial activities and carbonic anhydrase, acetylcholinesterase inhibition profiles of novel (3aR, 4S, 7R, 7aS)-2-[4-[1-acetyl-5-(aryl/heteroaryl)-4,5-dihydro-1H-pyrazol-3-yl]phenyl]-3a, 4, 7, 7a-tetrahydro-1H-4,7-methanoisoindole-1,3(2H)-diones, Monatsh. Chem., 2019, 150(4), 721–731 CrossRef CAS.
- S. Jahani, M. Khorasani-Motlagh and M. Noroozifar, DNA interaction of europium(III) complex containing 2,2′-bipyridine and its antimicrobial activity, J. Biomol. Struct. Dyn., 2016, 34(3), 612–624 CrossRef CAS PubMed.
- W.-Z. Shen, G. Trötscher-Kaus and B. Lippert, 1H NMR spectroscopic identification of binding modes of 2,2′-bipyridine ligands in complexes of square-planar d 8 metal ions, Dalton Trans., 2009, 39, 8203–8214 RSC.
- A. Haque, I. Khan, S. I. Hassan and M. S. Khan, Interaction studies of cholinium-based ionic liquids with calf thymus DNA: spectrophotometric and computational methods, J. Mol. Liq., 2017, 237, 201–207 CrossRef CAS.
- D. He, L. Wang, L. Wang, X. Li and Y. Xu, Spectroscopic studies on the interactions between novel bisnaphthalimide derivatives and calf thymus DNA, J. Photochem. Photobiol., B, 2017, 166, 333–340, DOI:10.1016/j.jphotobiol.2016.12.003.
- U. Chaveerach, A. Meenongwa, Y. Trongpanich, C. Soikum and P. Chaveerach, DNA binding and cleavage behaviors of copper(II) complexes with amidino-O-methylurea and N-methylphenyl-amidino-O-methylurea, and their antibacterial activities, Polyhedron, 2010, 29(2), 731–738, DOI:10.1016/j.poly.2009.10.031.
- N. Shahabadi and M. Falsafi, Experimental and molecular docking studies on DNA binding interaction of adefovir dipivoxil: Advances toward treatment of hepatitis B virus infections, Spectrochim. Acta, Part A, 2014, 125, 154–159 CrossRef CAS PubMed.
- F. Cui, G. Hui, X. Jiang and G. Zhang, Interaction of 3′-azido-3′-deamino daunorubicin with DNA: multispectroscopic and molecular modeling, Int. J. Biol. Macromol., 2012, 50(4), 1121–1126 CrossRef CAS PubMed.
- B.-L. Wang, D.-Q. Pan, K.-L. Zhou, Y.-Y. Lou and J.-H. Shi, Multi-spectroscopic approaches and molecular simulation research of the intermolecular interaction between the angiotensin-converting enzyme inhibitor (ACE inhibitor) benazepril and bovine serum albumin (BSA), Spectrochim. Acta, Part A, 2019, 212, 15–24 CrossRef CAS PubMed.
- F. Jalali and P. S. Dorraji, Interaction of anthelmintic drug (thiabendazole) with DNA: spectroscopic and molecular modeling studies, Arabian J. Chem., 2017, 10, S3947–S3954, DOI:10.1016/j.arabjc.2014.06.001.
- T. Sarwar, H. M. Ishqi, S. U. Rehman, M. A. Husain, Y. Rahman and M. Tabish, Caffeic acid binds to the minor groove of calf thymus DNA: a multi-spectroscopic, thermodynamics and molecular modelling study, Int. J. Biol. Macromol., 2017, 98, 319–328, DOI:10.1016/j.ijbiomac.2017.02.014.
- X.-B. Fu, Z.-H. Lin, H.-F. Liu and X.-Y. Le, A new ternary copper(II) complex derived from 2-(2′-pyridyl) benzimidazole and glycylglycine: synthesis, characterization, DNA binding and cleavage, antioxidation and HSA interaction, Spectrochim. Acta, Part A, 2014, 122, 22–33 CrossRef CAS PubMed.
- S. Yadav, I. Yousuf, M. Usman, M. Ahmad, F. Arjmand and S. Tabassum, Synthesis and spectroscopic characterization of diorganotin (IV) complexes of N′-(4-hydroxypent-3-en-2-ylidene) isonicotinohydrazide: chemotherapeutic potential validation by in vitro interaction studies with DNA/HSA, DFT, molecular docking and cytotoxic activity, RSC Adv., 2015, 5(63), 50673–50690 RSC.
- F. A. Qais, K. Abdullah, M. M. Alam, I. Naseem and I. Ahmad, Interaction of capsaicin with calf thymus DNA: a multi-spectroscopic and molecular modelling study, Int. J. Biol. Macromol., 2017, 97, 392–402 CrossRef PubMed.
- G.-F. Shen, T.-T. Liu, Q. Wang, M. Jiang and J.-H. Shi, Spectroscopic and molecular docking studies of binding interaction of gefitinib, lapatinib and sunitinib with bovine serum albumin (BSA), J. Photochem. Photobiol., B, 2015, 153, 380–390 CrossRef CAS PubMed.
- Q. Gan, X. Fu, W. Chen, Y. Xiong, Y. Fu, S. Chen and X. Le, Synthesis, DNA/HSA interaction spectroscopic studies and in vitro cytotoxicity of a new mixed ligand Cu(II) complex, J. Fluoresc., 2016, 26(3), 905–918 CrossRef CAS PubMed.
- A. T. Buddanavar and S. T. Nandibewoor, Multi-spectroscopic characterization of bovine serum albumin upon interaction with atomoxetine, Arabian J. Chem., 2017, 7(3), 148–155 Search PubMed.
- P. Bolel, N. Mahapatra and M. Halder, Optical spectroscopic exploration of binding of cochineal red A with two homologous serum albumins, J. Agric. Food Chem., 2012, 60(14), 3727–3734 CrossRef CAS PubMed.
| This journal is © The Royal Society of Chemistry 2020 |

