 Open Access Article
Development of a panchromatic photosensitizer and its application to photocatalytic CO2 reduction†
Mari
Irikura
,
Yusuke
Tamaki
* and
Osamu
Ishitani
 *
*
Department of Chemistry, School of Science, Tokyo Institute of Technology, O-okayama 2-12-1-NE-1, Meguro-ku, Tokyo, 152-8550, Japan. E-mail: tamaki@chem.titech.ac.jp; ishitani@chem.titech.ac.jp
First published on 28th September 2021
Abstract
We designed and synthesized a heteroleptic osmium(II) complex with two different tridentate ligands, Os. Os can absorb the full wavelength range of visible light owing to S–T transitions, and this was supported by TD-DFT calculations. Excitation of Os using visible light of any wavelength generates the same lowest triplet metal-to-ligand charge-transfer excited state, the lifetime of which is relatively long (τem = 40 ns). Since excited Os could be reductively quenched by 1,3-dimethyl-2-(o-hydroxyphenyl)-2,3-dihydro-1H-benzo[d]imidazole, Os displays high potential as a panchromatic photosensitizer. Using a combination of Os and a ruthenium(II) catalyst, CO2 was photocatalytically reduced to HCOOH via irradiation with 725 nm light, and the turnover number reached 81; irradiation with light at λex > 770 nm also photocatalytically induced HCOOH formation. These results clearly indicate that Os can function as a panchromatic redox photosensitizer.
Introduction
In recent years, various photocatalytic reactions toward artificial photosynthesis for CO2 reduction,1,2 H2 evolution,3 and water oxidation4 using metal complexes have attracted attention. Because these reactions are multi-electron processes, two functions are required: a redox photosensitizer that absorbs visible light and initiates electron transfer from its excited state and a catalyst that accepts electrons or holes and activates substrates through multi-electron processes. For effective utilization of solar light, absorption of visible light over a wide range of wavelengths by redox photosensitizers is highly important. For example, light in the 280–550 nm wavelength range covers only 14% of total solar irradiance in AM1.5G conditions, while 280–800 nm light covers 40%.5 The use of a panchromatic redox photosensitizer that can absorb the full wavelength range of visible light is promising for increasing the utilization efficiency of solar energy.Photoredox catalysts, another name for redox photosensitizers, also play critical roles in many photochemical organic reactions.6 In these photocatalytic reactions, light absorption by co-existing components, such as a catalyst and/or substrate, frequently causes side reactions and the inner-filter effect, which lowers the efficiency of photocatalysis by inhibiting light absorption by the photosensitizer. For this reason, the development of redox photosensitizers that can absorb longer wavelength light is also important.
Ruthenium(II) tris-diimine complexes, [Ru(N^N)3]2+ (N^N = diimine ligand), are the most frequently used redox photosensitizers because they absorb visible light, owing to singlet metal-to-ligand charge-transfer (1MLCT) transitions, and their lowest triplet MLCT (3MLCT) excited states that are rapidly and quantitatively produced by the intersystem crossing from the 1MLCT states have long lifetimes ranging from several hundred ns to several μs.7,8 They also have appropriate redox potentials for various reactions. However, [Ru(N^N)3]2+ as photosensitizers have the disadvantage of limited visible light absorption, typically [Ru(bpy)3]2+ (bpy = 2,2′-bipyridine) can absorb only the light at λabs < 550 nm; therefore, many of the reported [Ru(N^N)3]2+-type redox photosensitizers cannot utilize lower-energy visible light. A simple strategy to extend the wavelength range of light absorption is to decrease the energy gap between the highest occupied molecular orbital (HOMO) and lowest unoccupied molecular orbital (LUMO); however, this usually shortens the lifetime of the excited state owing to the energy gap law and decreases the reducing/oxidizing power of the complex. For this reason, the reported ruthenium(II) complexes with panchromatic and near-infrared absorption, which are employed in dye-sensitized solar cells,9,10 cannot be utilized as redox photosensitizers for photocatalytic reactions. One example of a ruthenium(II) photosensitizer with longer-wavelength absorption is a trinuclear ruthenium(II) complex bridged by 1,4,5,8,9,12-hexaazatriphenylene (HAT), [{(dmb)2Ru}3(μ-HAT)]6+ (dmb = 4,4′-dimethyl-2,2′-bipyridine), which has been used as a redox photosensitizer to drive H2 evolution.11 In this case, the ion-pair adducts of [{(dmb)2Ru}3(μ-HAT)]6+ and ascorbate anions have been reported to afford static reductive quenching and increased reducing power, which compensated for the disadvantage of a smaller HOMO–LUMO gap. However, the reducing power of this adduct is still insufficient for driving CO2 reduction, which requires stronger reducing power than does H2 evolution.
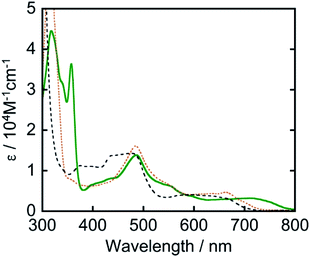
Another strategy for achieving longer-wavelength absorption is to utilize the direct transition from the ground state to the triplet excited state (S–T transition). Although this is usually a spin-flip-forbidden transition, many osmium(II) complexes give S–T absorption bands owing to strong spin–orbit coupling due to the heavy atom effect of osmium. For example, [Os(tpy)2]2+ (tpy = 2,2′:6′,2′′-terpyridine) has given an S–T absorption band at 600–750 nm and been employed as a photosensitizer for organic synthesis12 and H2 evolution.13 We also previously reported that [Os(5dmb)2(dmb)]2+ (5dmb = 5,5′-dimethyl-2,2′-bipyridine) functions as a photosensitizer and catalyzes CO2 reduction in combination with a rhenium(I) catalyst under red light irradiation (λex > 620 nm).14 However, these osmium(II) complexes do not absorb the full wavelength range of visible light up to 800 nm (Fig. 1).
Therefore, in this study, we developed a redox photosensitizer that displays panchromatic absorption. A heteroleptic osmium(II) complex with two different tridentate ligands, [(mbip)Os(mtpy)]2+ (Os in Chart 1: mbip = bis(N-methylbenzimidazolyl)pyridine; mtpy = 4′-methyl-2,2′:6′,2′′-terpyridine), was designed and synthesized. The stronger σ-donation of the methylbenzimidazole units should induce longer-wavelength absorption. Although a similar complex, [(mbip)Os(tpy)]2+, has been reported, its photochemical and photosensitizing properties have not been investigated.15 In this study, the photophysical, photochemical, and photosensitizing properties of Os were investigated, and Os was successfully applied to the photocatalytic reduction of CO2 as the first panchromatic redox photosensitizer in combination with a ruthenium(II) catalyst, Ru(CO) (Chart 1).
Results and discussion
The heteroleptic osmium(II) complex with two tridentate ligands was synthesized through the three steps shown in eqn (1). [(mbip)OsCl3] was dimerized into [Os(mbip)(μ-Cl)Cl]2 to remove the byproduct of [Os(mbip)2]2+ by exploiting the insolubility of [Os(mbip)(μ-Cl)Cl]2 in ethanol. The target complex, Os, was isolated using ion-exchange column chromatography.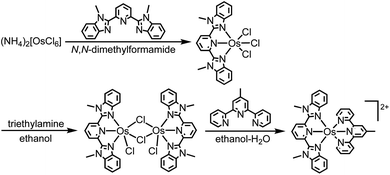 | (1) |
The ultraviolet-visible (UV-vis) absorption spectrum of Os measured in N,N-dimethylacetamide (DMA) is shown in Fig. 1. Os gave longer-wavelength absorption bands at 620–800 nm (λmax = 709 nm, ε = 3.20 × 10³ M−1 cm−1) attributable to S–T transitions to 3MLCT excited states as well as bands attributed to π–π* transitions of the tridentate ligands at 300–360 nm and 1MLCT transitions at λmax = 487 nm (ε = 1.38 × 10⁴ M−1 cm−1). The S–T transition bands should be observed because of the heavy atom effect of osmium, which enhances spin–orbit coupling. The spectra of other osmium(II) complexes that have been used as photosensitizers are also shown in Fig. 1. It should be noted that only Os can absorb full-wavelength range of visible light with a relatively high molar absorptivity.
The geometry, molecular orbitals, and absorption spectrum of Os were analyzed using density functional theory/time-dependent density functional theory (DFT/TD-DFT) calculations using Gaussian 16.16 The geometry optimization of Os was performed in DMA using the B3LYP exchange–correlation functional and LanL2DZ basis set for osmium and 6-311++G(d,p) for the ligands. Tridentate ligands mbip and mtpy were coordinated on osmium perpendicular to each other. Fig. 2 shows the frontier molecular orbitals of Os, and Table S1† summarizes their characteristics. HOMO−2, HOMO−1, and HOMO received major contributions from the osmium(II) center and minor contributions from the ligands. The energy levels of the LUMO and LUMO+1 were very close (ΔE = 0.04 eV). The LUMO and LUMO+1 received major contributions from mbip and mtpy, respectively. LUMO+2 and LUMO+3 were distributed on both mbip and mtpy.
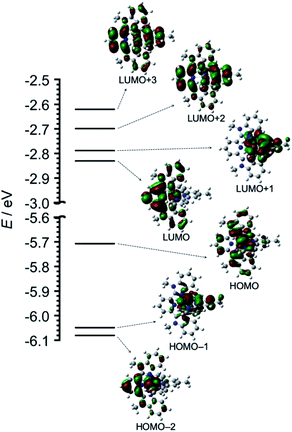 | ||
| Fig. 2 DFT-calculated energy diagram and isodensity plots of frontier molecular orbitals of Os. The left portions of the structures are mbip. All orbitals were computed at an isovalue of 0.02. | ||
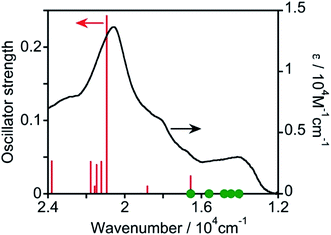
Then, TD-DFT calculations were performed based on the geometry optimized using DFT calculations. Fig. 3 displays the calculated oscillator strengths of the excitations and the observed spectrum, and Table 1 summarizes the characteristics of the excitations. The observed 1MLCT absorption band at λmax = 487 nm was consistent with the singlet-to-singlet (S–S) transition at 20![[thin space (1/6-em)]](https://www.rsc.org/images/entities/char_2009.gif) 940 cm−1 (= 478 nm, #17 in Table 1) with a high oscillator strength of 0.242. This excitation received a major contribution from the HOMO−1 → LUMO+1 transition (57%) and a partial contribution from the HOMO−2 → LUMO (24%) and HOMO → LUMO+2 (16%) transitions, indicating that the excitation is predominantly the MLCT from osmium(II) to the mtpy ligand. Because TD-DFT calculations using Gaussian 16 do not consider spin–orbit couplings, the oscillator strength of every S–T transition cannot be calculated. A spin-forbidden S–T transition gains strength by borrowing the intensity of the oscillator strength of the spin-allowed S–S transition (fs). Considering the coupling of S–T transitions with S–S transitions, effective coupling should occur only between S–T and S–S transitions involving different d orbitals and common π* orbitals.17–20 As shown in Table 1, therefore, the S–T transitions of #1 and #3 couple with the S–S transition of #17, which has high oscillator strength (fs = 0.242), although the energy gaps are relatively large (ΔES–T = 6–7 × 103 cm−1). The S–T transitions of #2 and #4 strongly couple with the S–S transition of #6, which has low oscillator strength (fs = 0.024) because of the smaller energy gap (ΔES–T = 1–2 × 103 cm−1). The S–T transition of #7 can couple weakly with the S–S transitions of #18 (fs = 0.044), #21 (fs = 0.039), and #23 (fs = 0.044). Thus, the S–T transitions of #1 to #4 should gain oscillator strength by coupling with spin-allowed S–S transitions. They have lower energy than the lowest-energy S–S transition (#6) and their energy is consistent with the observed absorption band in the lower-energy region (1.3–1.6 × 104 cm−1). Therefore, these S–T transitions should contribute to absorption in the longer-wavelength region.
940 cm−1 (= 478 nm, #17 in Table 1) with a high oscillator strength of 0.242. This excitation received a major contribution from the HOMO−1 → LUMO+1 transition (57%) and a partial contribution from the HOMO−2 → LUMO (24%) and HOMO → LUMO+2 (16%) transitions, indicating that the excitation is predominantly the MLCT from osmium(II) to the mtpy ligand. Because TD-DFT calculations using Gaussian 16 do not consider spin–orbit couplings, the oscillator strength of every S–T transition cannot be calculated. A spin-forbidden S–T transition gains strength by borrowing the intensity of the oscillator strength of the spin-allowed S–S transition (fs). Considering the coupling of S–T transitions with S–S transitions, effective coupling should occur only between S–T and S–S transitions involving different d orbitals and common π* orbitals.17–20 As shown in Table 1, therefore, the S–T transitions of #1 and #3 couple with the S–S transition of #17, which has high oscillator strength (fs = 0.242), although the energy gaps are relatively large (ΔES–T = 6–7 × 103 cm−1). The S–T transitions of #2 and #4 strongly couple with the S–S transition of #6, which has low oscillator strength (fs = 0.024) because of the smaller energy gap (ΔES–T = 1–2 × 103 cm−1). The S–T transition of #7 can couple weakly with the S–S transitions of #18 (fs = 0.044), #21 (fs = 0.039), and #23 (fs = 0.044). Thus, the S–T transitions of #1 to #4 should gain oscillator strength by coupling with spin-allowed S–S transitions. They have lower energy than the lowest-energy S–S transition (#6) and their energy is consistent with the observed absorption band in the lower-energy region (1.3–1.6 × 104 cm−1). Therefore, these S–T transitions should contribute to absorption in the longer-wavelength region.
| # | Energy/cm−1 | Oscillator strength | Multiplicity | Major transitions | ||
|---|---|---|---|---|---|---|
| a Calculated using TD-DFT at the B3LYP/LanL2DZ (Os)/6-311++G(d,p) level of theory. The HOMO and LUMO are represented by H and L, respectively. | ||||||
| 1 | 14![[thin space (1/6-em)]](https://www.rsc.org/images/entities/char_2009.gif) 054 054 |
Triplet | H → L (98%) | |||
| 2 | 14![[thin space (1/6-em)]](https://www.rsc.org/images/entities/char_2009.gif) 470 470 |
H−2 → L (82%) | H–1 → L+1 (15%) | |||
| 3 | 14![[thin space (1/6-em)]](https://www.rsc.org/images/entities/char_2009.gif) 819 819 |
H → L+1 (96%) | ||||
| 4 | 15![[thin space (1/6-em)]](https://www.rsc.org/images/entities/char_2009.gif) 613 613 |
H−2 → L (15%) | H–1 → L+1 (79%) | |||
| 7 | 16![[thin space (1/6-em)]](https://www.rsc.org/images/entities/char_2009.gif) 579 579 |
H → L+2 (30%) | H → L+3 (60%) | |||
| 6 | 16![[thin space (1/6-em)]](https://www.rsc.org/images/entities/char_2009.gif) 564 564 |
0.024 | Singlet | H → L+1 (98%) | ||
| 12 | 18![[thin space (1/6-em)]](https://www.rsc.org/images/entities/char_2009.gif) 820 820 |
0.010 | H−1 → L+1 (11%) | H → L+2 (81%) | ||
| 17 | 20![[thin space (1/6-em)]](https://www.rsc.org/images/entities/char_2009.gif) 940 940 |
0.242 | H−2 → L (24%) | H–1 → L+1 (57%) | H → L+2 (16%) | |
| 18 | 21![[thin space (1/6-em)]](https://www.rsc.org/images/entities/char_2009.gif) 219 219 |
0.044 | H−1 → L+2 (92%) | |||
| 21 | 21![[thin space (1/6-em)]](https://www.rsc.org/images/entities/char_2009.gif) 466 466 |
0.039 | H−2 → L+2 (99%) | |||
| 23 | 21![[thin space (1/6-em)]](https://www.rsc.org/images/entities/char_2009.gif) 778 778 |
0.044 | H−2 → L+3 (98%) | |||
Fig. 4 shows the cyclic voltammogram of Os measured in an Ar-saturated DMA solution. Three reversible redox couples were observed at +0.35, −1.57, and −1.89 V vs. Ag/AgNO3. The oxidation wave at Eox1/2 = +0.35 V was attributed to the one-electron oxidation of osmium(II), and the reduction waves at Ered1/2 = −1.57 and −1.89 V were attributed to the subsequent one-electron reduction of the tridentate ligands. These results indicate that the one-electron-reduced species (OERS) of Os has relatively strong reducing power and is stable at least on the time scale of cyclic voltammetry measurement at a scan rate of 0.2 V s−1.
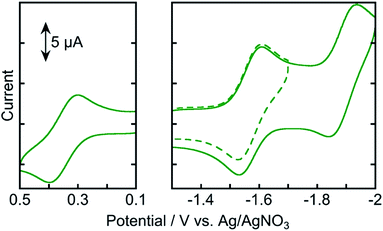 | ||
| Fig. 4 Cyclic voltammograms of Os (0.5 mM) in an Ar-saturated DMA solution containing Et4NBF4 (0.1 M) as a supporting electrolyte with a Ag/AgNO3 (10 mM) reference electrode. Scan rate was 0.2 V s−1. | ||
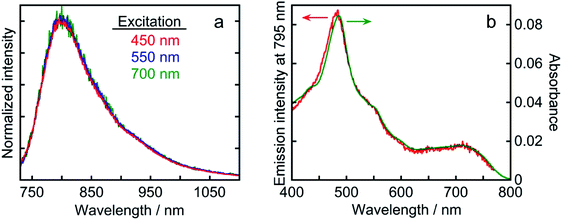
Os exhibited phosphorescence at λmax = 795 nm in an Ar-saturated DMA solution upon excitation with visible light (λex = 456 nm). The emission quantum yield was Φem = 0.3%. The emission lifetime was determined to be τem = 40 ns from single-exponential fitting of the transient emission (Fig. S1†). Although longer-wavelength absorption and a longer lifetime in the excited state are commonly in a trade-off relationship because of the energy gap law which gives faster non-radiative decay at smaller energy gap, Os displayed panchromatic absorption and a relatively long lifetime, enabling initiation of the electron transfer process. These results indicate that Os has essential photophysical properties as a redox photosensitizer. Fig. 5 displays the emission spectra following excitation with visible light at three different wavelengths and the excitation spectrum derived from emission intensity. The emission spectra of Os following the excitation of the 1MLCT or 3MLCT absorption band at λex = 450, 550, and 700 nm had very similar shapes (Fig. 5a). The shape of the excitation spectrum derived from the emission intensity at λmax = 795 nm is quite similar to that of the absorption spectrum of Os (Fig. 5b). These results clearly indicate that both the 1MLCT and 3MLCT excited states of Os relax to the same lowest 3MLCT excited state very rapidly, and this excited state deactivates to the ground state through radiative and non-radiative decay processes. Therefore, visible-light irradiation of Os at any wavelength generates the same lowest 3MLCT excited state with τem = 40 ns.
Fig. S2† shows the emission spectra of Os in CO2-saturated DMA solutions containing 1,3-dimethyl-2-(o-hydroxyphenyl)-2,3-dihydro-1H-benzo[d]imidazole (BI(OH)H) at five different concentrations. The emission intensities decreased at higher BI(OH)H concentrations, indicating that BI(OH)H quenches the excited state of Os (Fig. S2a†). By using Stern–Volmer plots of the emission quenching (Fig. S2b†) and the lifetime of the emission (τem = 40 ns), the quenching rate constant was determined to be kq = 1.8 × 10⁸ M−1 s−1. The quenching fraction of excited Os due to BI(OH)H (0.2 M) was ηq = 60% according to the equation ηq = kqτem[BI(OH)H]/(1 + kqτem[BI(OH)H]); the reaction conditions were the same as those for photocatalytic CO2 reduction described below. To determine the product after excited Os was quenched by BI(OH)H, the absorption spectral changes during photoirradiation were measured.
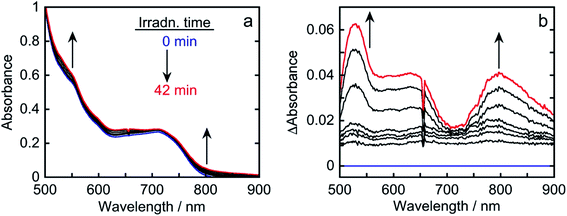
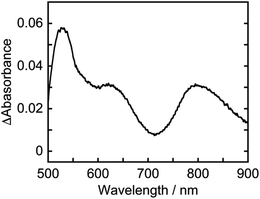
The absorption spectra of a CO2-saturated DMA solution containing only Os (0.1 mM) and BI(OH)H (0.2 M), without a catalyst, during irradiation and the difference spectra from the post- and pre-irradiation spectra are shown in Fig. 6a and b, respectively. Fig. 6b clearly shows that new broad absorption bands appeared at λmax = 530 and 800 nm and increased during irradiation. The shapes of the difference spectra were fairly similar to that of the OERS of Os (Os˙−) obtained through electro-spectroscopy using an optically transparent thin-layer electrochemical (OTTLE) cell (Fig. 7). The absorption bands due to photoirradiation disappeared after aeration of the solution, which also supports the formation of Os˙−, because this reduced species should be oxidized by O2. These results clearly indicate that the 3MLCT excited state of Os was reductively quenched by BI(OH)H to give Os˙− (eqn (2)).
 | (2) |
This reductive quenching process was also supported by thermodynamics. The 0-0 transition energy of Os was determined to be E00 = 1.59 eV from the Franck–Condon fitting of an emission spectrum with the vibronic structure measured in frozen DMA (Fig. S3†). It is noteworthy that this value was consistent with the E00 = 1.6 eV obtained from the mirror image of S–T absorption and phosphorescence (Fig. S4†). The reduction potential of Os in the lowest excited state was calculated to be E(*Os/Os˙−) = Ered1/2 + E00 = −1.57 + 1.59 = +0.02 V vs. Ag/AgNO3. The oxidation potential of BI(OH)H was measured to be Eox1/2(BI(OH)H˙+/BI(OH)H) = −0.09 V from the cyclic voltammograms with a fast scan rate of 200 V s−1 using a micro glassy carbon working electrode (Fig. S5†). Therefore, electron transfer from BI(OH)H to the excited state of Os in the reductive quenching process should be exothermic. Hence, we can summarize the photochemistry of Os in the presence of BI(OH)H as follows: Os can absorb the full wavelength range of visible light, giving the lowest 3MLCT excited state, which is reduced by BI(OH)H to generate its relatively stable OERS.
The photocatalytic reduction of CO2 was performed using Os as a redox photosensitizer. Ru(bpy)(CO)2Cl2 (Ru(CO)), which has been used frequently as a catalyst for CO2 reduction,21–23 was employed because its reduction potential has been reported to be Ep = −1.51 V vs. Ag/AgNO3,24 that is, electron transfer should proceed thermodynamically from Os˙− (E1/2(Os/Os˙−) = −1.57 V) to Ru(CO). A CO2-saturated DMA solution containing Os (50 μM), Ru(CO) (50 μM), and BI(OH)H (0.2 M) as a sacrificial electron donor was irradiated using a 725 nm LED light source, affording HCOOH with high selectivity (Fig. 8). After irradiation for 40 h, 8.1 μmol of HCOOH was produced along with 0.3 μmol of CO and a negligible amount of H2 (<0.01 μmol), corresponding to turnover numbers of TONHCOOH = 81, TONCO = 3, and TONH2 < 1. The selectivity for HCOOH was 96%. The quantum yield for HCOOH formation was determined to be ΦHCOOH = 0.061% (Fig. S6†). Since the quenching fraction was ηq = 60% when [BI(OH)H] = 0.2 M, the efficiency of HCOOH formation after the reductive quenching was ΦHCOOH/ηq = 0.1%. Table 2 summarizes the results of control experiments without Os, Ru(CO), BI(OH)H, light irradiation, or CO2. Entry 1 shows the result for the system with all components; that is, Os, Ru(CO), and BI(OH)H with irradiation for 3 h under CO2 gave TONHCOOH = 19. Irradiation of solutions without Os (entry 2), Ru(CO) (entry 3), or BI(OH)H (entry 4) did not lead to even a catalytic amount of the products. Control experiments in the dark (entry 5) or using an Ar-saturated solution (entry 6) yielded no photocatalysis products. Because only Os absorbs irradiated light at 725 nm under the photocatalytic reaction conditions (Fig. S7†), these results indicate that Os functioned as a redox photosensitizer and drove the photocatalytic formation of HCOOH.
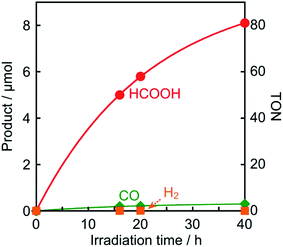 | ||
| Fig. 8 Photocatalytic formation of HCOOH (●), CO (◆), and H2 (■): CO2-saturated DMA solutions (2 mL) containing Os (50 μM), Ru(CO) (50 μM), and BI(OH)H (0.2 M) were irradiated with 725 nm light. | ||
| Entry | Absence | Product/μmol (TON) | ||
|---|---|---|---|---|
| HCOOH | CO | H2 | ||
| a A CO2-saturated DMA solution (2 mL) containing Os (50 μM), Ru(CO) (50 μM), and BI(OH)H (0.2 M) was irradiated with 725 nm light. b Photocatalytic reactions were performed without Os, Ru(CO), or BI(OH)H. c The solution was placed in the dark for 3 h. d An Ar-saturated solution was used. | ||||
| 1 | — | 1.9 (19) | 0.05 | n.d. |
| 2b | Os | 0.04 | n.d. | n.d. |
| 3b | Ru(CO) | n.d. | n.d. | n.d. |
| 4b | BI(OH)H | n.d. | n.d. | n.d. |
| 5c | Light irradiation | n.d. | n.d. | n.d. |
| 6d | CO2 | n.d. | n.d. | n.d. |
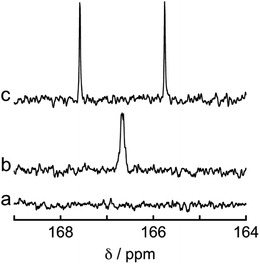
To determine the source of the carbon atom in the produced HCOOH, isotope labeling experiments were performed using 13CO2. Fig. 9a and b show the 13C{1H} NMR spectra of a DMF-d7 solution containing Os (0.5 mM), Ru(CO) (50 μM), and BI(OH)H (0.2 M) under a 13CO2 (447 mmHg) atmosphere before and after irradiation at 725 nm using an LED for 60 h, respectively. After irradiation, a new signal appeared at 166.7 ppm, which was attributed to an equilibrium mixture of H13COOH and H13COO− (Fig. 9b). A doublet (1JCH = 183 Hz) signal at 8.71 ppm in the 1H NMR spectrum of the same solution (Fig. 10) was attributed to the methine proton of the equilibrium mixture of H13COOH and H13COO−. The absence of a clear singlet signal at 8.71 ppm attributable to the methine proton of an equilibrium mixture of H12COOH and H12COO− indicates that HCOOH was produced through the reduction of CO2. An identical J value of 183 Hz from the 13C–1H coupling observed in the 13C NMR spectrum without 1H decoupling (Fig. 9c) also supports the formation of H13COOH. Therefore, we can conclude that CO2 can be photocatalytically reduced to HCOOH using a system consisting of Os as the photosensitizer, Ru(CO) as the catalyst, and BI(OH)H as the reductant.
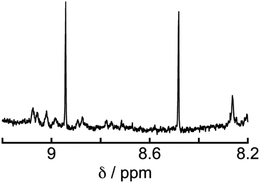 | ||
| Fig. 10 1H NMR spectrum of the solution in Fig. 9 after irradiation. | ||
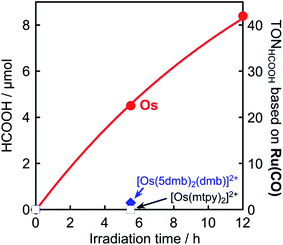
It is noteworthy that this system provides the first example of photocatalytic CO2 reduction driven by only light at λex > 700 nm. We investigated the possibility of using even longer wavelengths. Irradiation with light only at λex > 770 nm using a xenon lamp with a short-cut filter (LI0780, Asahi Spectra Co.) to a CO2-saturated DMA solution (4 mL) of Os (0.6 mM), Ru(CO) (50 μM), and BI(OH)H (0.2 M) for 5.5 h also gave 4.5 μmol of HCOOH, although those using [Os(5dmb)2(dmb)]2+ or [Os(mtpy)2]2+ instead of Os scarcely produced HCOOH (Fig. 11, Table 3). This should be due to the poor absorption of [Os(5dmb)2(dmb)]2+ and [Os(mtpy)2]2+ at λ > 750 nm as shown in Fig. 1. Further irradiation for 12 h in the same condition using Os gave 8.4 μmol of HCOOH which corresponds to TONHCOOH = 3.5 based on Os used and TONHCOOH = 42 based on Ru(CO) used. Therefore, Os can function as a panchromatic redox photosensitizer.
| Photosensitizer | Irradiation time/h | HCOOH/μmol | TONHCOOHOs | TONHCOOHRu(CO) |
|---|---|---|---|---|
| a A CO2-saturated DMA solution (4 mL) containing osmium(II) photosensitizer (0.6 mM), Ru(CO) (50 μM), and BI(OH)H (0.2 M) was irradiated using light at λex > 770 nm. | ||||
| Os | 5.5 | 4.5 | 1.9 | 23 |
| 12 | 8.4 | 3.5 | 42 | |
| [Os(5dmb)2(dmb)]2+ | 5.5 | 0.3 | 0.1 | 1.5 |
| [Os(mtpy)2]2+ | 5.5 | n.d. | — | — |
Experimental
General procedures
1H NMR spectra were obtained in chloroform-d or acetonitrile-d3 using a JEOL ECA400II (400 MHz) system to identify the synthesized ligands and complexes. The residual protons of chloroform-d or acetonitrile-d3 were used as internal standards. Electrospray ionization-mass spectrometry (ESI-MS) was performed using a Shimadzu LCMS-2010A system with acetonitrile as the mobile phase. UV-vis absorption spectra were measured using a JASCO V-670 spectrophotometer. Prior to the emission measurements, the solutions were purged with Ar to remove dissolved O2. Emission spectra and excitation spectra derived from emission intensity were measured using a HORIBA Fluorolog-3-21 spectrofluorometer equipped with an NIR-PMT R5509-43 near-infrared detector. The emission lifetime was determined using a HORIBA FluoroCube time-correlated single-photon counting system. The excitation light source was a NanoLED-460 pulse lamp (456 nm; pulse duration: 1.3 ns). The emission quantum yield was determined using a Quantaurus-QY Plus C13534-01 quantum yield analyzer (HAMAMATSU) using a xenon lamp with a band-pass filter (475 ± 25 nm) as the light source. Emission-quenching experiments were performed in CO2-saturated solutions containing Os and BI(OH)H at five different concentrations. The quenching rate constant, kq, was obtained from the slope of the Stern–Volmer plots of emission intensity against BI(OH)H concentration. The redox potentials of Os were measured in an Ar-saturated DMA solution containing Os (0.5 mM) and Et4NBF4 (0.1 M) as a supporting electrolyte via cyclic voltammetry using an ALS CHI-620Ex electrochemical analyzer with a glassy carbon working electrode (diameter: 3 mm), Ag/AgNO3 (10 mM) reference electrode, and Pt counter electrode. The scan rate was 0.2 V s−1. To determine the redox potential of BI(OH)H, a fast scan rate of 200 V s−1 was applied while using a micro glassy carbon electrode (diameter: 33 μm).Emission spectral fitting
Franck–Condon analysis of the emission spectrum obtained in DMA frozen using liquid nitrogen was conducted to determine the 0-0 transition energy, E00, according to the equation below:25where I(ν) is the normalized intensity in the emission spectrum (wavenumber), Si are the Huang–Rhys parameters of vibronic couplings reflecting the distortion in the acceptor modes, νi are the energies of the acceptor modes, and ν1/2 is the FWHM of the 0-0 vibronic component in the emission spectrum.
Photocatalysis
Photocatalytic reactions were performed in DMA solutions containing Os (50 μM), Ru(CO) (50 μM), and BI(OH)H (0.2 M). After it was purged with CO2 for 20 min, the solution was irradiated. To determine the TON, a 2 mL solution in an 11 mL test tube was irradiated using a merry-go-round-type photoirradiation apparatus with an LED light source (725 nm), Iris-MG (CELL System Co.). The quantum yield was determined using a QYM-01 Shimadzu photoreaction quantum yield evaluation system; a 3.5 mL solution in a quartz cubic cell (11 mL; light pass length: 1 cm) was irradiated with 480 nm light from a 300 W xenon lamp equipped with a band-pass filter (480 nm; FWHM: 10 nm). The temperature of the solution during irradiation was maintained at 25 ± 0.1 °C using an IWAKI CTS-134A constant temperature system. The gaseous products of the photocatalysis, namely, CO and H2, were analyzed using gas chromatography-thermal conductivity detector (GC-TCD) (GL Sciences GC323). HCOOH was analyzed using a capillary electrophoresis system (Agilent Technologies 7100L).UV-vis absorption spectral changes during irradiation
A CO2-saturated DMA solution (4 mL) containing Os (0.1 mM) and BI(OH)H (0.2 M) in a quartz cubic cell (light pass length: 1 cm) was irradiated at 480 nm using a xenon lamp equipped with a 480 nm band-pass filter (Asahi Spectra Co.) and a 5 cm-long water filter. During irradiation, UV-vis absorption spectral changes were measured using a Photal MCPD-9800 spectrophotometer. The temperature of the solution was maintained at 25 ± 0.1 °C using an IWAKI CTS-134A constant temperature system.Electrochemical spectroscopy
A UV-vis OTTLE cell (light pass length: 1.0 mm) equipped with a Pt mesh working electrode, Ag/AgNO3 (10 mM) reference electrode, and Pt counter electrode was employed for UV-vis electrochemical spectroscopy. UV-vis absorption spectral changes were measured using a Photal MCPD-9800 spectrometer. A CO2-saturated DMA solution containing Os (0.5 mM) and Et4NBF4 (0.1 M) as the supporting electrolyte was electrolyzed using an ALS CHI-620Ex electrochemical analyzer.Quantum chemical calculation
The calculations were performed using the Gaussian 16 program16 using the B3LYP exchange–correlation functional. Geometry optimization was performed in DMA using a general basis set with the Los Alamos National Laboratory effective core potential LanL2DZ basis set for osmium and 6-311++G(d,p) for the other elements. The geometry was fully optimized without symmetry constraints. Frequency calculations were performed with the same level of theory to ensure that the optimized geometry was a local minimum. The fractional contributions of various groups to each molecular orbital were calculated using GaussSum26 based on Mulliken population analysis.TD-DFT excited state calculations of the singlet–singlet and singlet–triplet transitions were performed in DMA using the geometry optimized by DFT calculations; the same LanL2DZ and 6-311++G(d,p) basis sets were used.
Isotope labeling experiment using 13CO2
An isotope labeling experiment using 13CO2 was performed in a DMF-d7 solution containing Os (0.5 mM), Ru(CO) (50 μM), and BI(OH)H (0.2 M). The solution was deaerated using the freeze–pump–thaw method prior to the introduction of 13CO2 (447 mmHg). 13C{1H}, 13C, and 1H NMR spectra were measured using a JEOL ECA400II spectrometer (100 MHz for 13C NMR and 400 MHz for 1H NMR) before and after irradiation for 60 h using a LED (725 nm) of Iris-MG (CELL System co.) as a light source. The residual carbons and protons of DMF-d7 were used as internal standards for these measurements.Materials
DMA was dried over 4 Å molecular sieves, distilled under reduced pressure, and kept under Ar before use. Et4NBF4 was dried under vacuum at 100 °C overnight prior to use. Ru(bpy)(CO)2Cl2,27 BI(OH)H,28,29 bis(N-methylbenzimidazolyl)pyridine (mbip),30 and 4′-methyl-2,2′:6′,2′′-terpyridine (mtpy)31 were synthesized according to methods reported in the literature.Synthesis
![[thin space (1/6-em)]](https://www.rsc.org/images/entities/char_2009.gif) :
:![[thin space (1/6-em)]](https://www.rsc.org/images/entities/char_2009.gif) 1 v/v) containing NH4PF6 (0–14 mM)). Yield: 69 mg (0.060 mmol, 24%). 1H NMR (400 MHz, acetonitrile-d3) δ/ppm: 8.75 (s, 2H), 8.68 (d, 2H, J = 8.2 Hz), 8.30 (d, 2H, J = 7.8 Hz), 7.71 (dd, 1H, J = 8.2, 8.2 Hz), 7.61–7.53 (m, 4H), 7.39 (dd, 2H, J = 7.8, 7.8 Hz), 7.21 (d, 2H, J = 5.5 Hz), 7.00–6.94 (m, 4H), 6.00 (d, 2H, J = 8.2 Hz), 4.52 (s, 6H), 3.36 (s, 3H). ESI-MS (acetonitrile) m/z: 388 ([M − 2PF6−]2+), 923 ([M − PF6−]+). Anal. Calcd for C37H30F12N8OsP2·H2O: C, 40.96; H, 2.97; N, 10.33. Found: C, 40.83; H, 3.03; N, 10.39.
1 v/v) containing NH4PF6 (0–14 mM)). Yield: 69 mg (0.060 mmol, 24%). 1H NMR (400 MHz, acetonitrile-d3) δ/ppm: 8.75 (s, 2H), 8.68 (d, 2H, J = 8.2 Hz), 8.30 (d, 2H, J = 7.8 Hz), 7.71 (dd, 1H, J = 8.2, 8.2 Hz), 7.61–7.53 (m, 4H), 7.39 (dd, 2H, J = 7.8, 7.8 Hz), 7.21 (d, 2H, J = 5.5 Hz), 7.00–6.94 (m, 4H), 6.00 (d, 2H, J = 8.2 Hz), 4.52 (s, 6H), 3.36 (s, 3H). ESI-MS (acetonitrile) m/z: 388 ([M − 2PF6−]2+), 923 ([M − PF6−]+). Anal. Calcd for C37H30F12N8OsP2·H2O: C, 40.96; H, 2.97; N, 10.33. Found: C, 40.83; H, 3.03; N, 10.39.
Conclusion
Os absorbed the entire wavelength range of visible light up to 800 nm, generating the same triplet lowest excited state. The lifetime of the resulting excited state was τem = 40 ns, which is relatively long and enabled the initiation of electron-transfer processes. Owing to longer-wavelength absorption by S–T transitions, Os exhibited both panchromatic absorption and a relatively long lifetime in the excited state. Excited Os was reductively quenched by BI(OH)H with a rate constant of kq = 1.8 × 10⁸ M−1 s−1, giving an OERS with a reducing power of E1/2(Os˙−) = −1.57 V vs. Ag/AgNO3. In combination with Ru(CO) as a catalyst, Os functioned as a redox photosensitizer and drove the photocatalytic reduction of CO2 to HCOOH under light irradiation at λex = 725 nm. This is the first example of photocatalytic CO2 reduction via irradiation with λex > 700 nm light.Author contributions
YT and OI designed the study. MI and YT performed all experiments. YT and OI wrote the manuscript.Conflicts of interest
There are no conflicts to declare.Acknowledgements
The work was supported by JSPS KAKENHI Grant Number JP18H05355 and JP17H06440 in Scientific Research on Innovative Areas “Innovations for Light-Energy Conversion (I4LEC)”, and JP18K14238.References
- H. Takeda, C. Cometto, O. Ishitani and M. Robert, ACS Catal., 2017, 7, 70–88 CrossRef CAS
.
- Y. Tamaki and O. Ishitani, ACS Catal., 2017, 7, 3394–3409 CrossRef CAS
.
- H. Ozawa and K. Sakai, Chem. Commun., 2011, 47, 2227–2242 RSC
.
- S. Fukuzumi, J. Jung, Y. Yamada, T. Kojima and W. Nam, Chem.–Asian J., 2016, 11, 1138–1150 CrossRef CAS PubMed
.
- G. P. Smestad, F. C. Krebs, C. M. Lampert, C. G. Granqvist, K. L. Chopra, X. Mathew and H. Takakura, Sol. Energy Mater. Sol. Cells, 2008, 92, 371–373 CrossRef CAS
.
- C. K. Prier, D. A. Rankic and D. W. C. MacMillan, Chem. Rev., 2013, 113, 5322–5363 CrossRef CAS PubMed
.
- D. W. Thompson, A. Ito and T. J. Meyer, Pure Appl. Chem., 2013, 85, 1257–1305 CAS
.
- A. Juris, V. Balzani, F. Barigelletti, S. Campagna, P. Belser and A. von Zelewsky, Coord. Chem. Rev., 1988, 84, 85–277 CrossRef CAS
.
- A. Hagfeldt, G. Boschloo, L. Sun, L. Kloo and H. Pettersson, Chem. Rev., 2010, 110, 6595–6663 CrossRef CAS PubMed
.
- F. Bella, C. Gerbaldi, C. Barolo and M. Grätzel, Chem. Soc. Rev., 2015, 44, 3431–3473 RSC
.
- Y. Tsuji, K. Yamamoto, K. Yamauchi and K. Sakai, Angew. Chem., Int. Ed., 2018, 57, 208–212 CrossRef CAS PubMed
.
- B. D. Ravetz, N. E. S. Tay, C. L. Joe, M. Sezen-Edmonds, M. A. Schmidt, Y. Tan, J. M. Janey, M. D. Eastgate and T. Rovis, ACS Cent. Sci., 2020, 6, 2053–2059 CrossRef CAS PubMed
.
- Y. Miyake, K. Nakajima, K. Sasaki, R. Saito, H. Nakanishi and Y. Nishibayashi, Organometallics, 2009, 28, 5240–5243 CrossRef CAS
.
- Y. Tamaki, K. Koike, T. Morimoto, Y. Yamazaki and O. Ishitani, Inorg. Chem., 2013, 52, 11902–11909 CrossRef CAS PubMed
.
- J.-Y. Shao and Y.-W. Zhong, Inorg. Chem., 2013, 52, 6464–6472 CrossRef CAS PubMed
.
-
M. J. Frisch, G. W. Trucks, H. B. Schlegel, G. E. Scuseria, M. A. Robb, J. R. Cheeseman, G. Scalmani, V. Barone, G. A. Petersson, H. Nakatsuji, X. Li, M. Caricato, A. V. Marenich, J. Bloino, B. G. Janesko, R. Gomperts, B. Mennucci, H. P. Hratchian, J. V. Ortiz, A. F. Izmaylov, J. L. Sonnenberg, D. Williams-Young, F. Ding, F. Lipparini, F. Egidi, J. Goings, B. Peng, A. Petrone, T. Henderson, D. Ranasinghe, V. G. Zakrzewski, J. Gao, N. Rega, G. Zheng, W. Liang, M. Hada, M. Ehara, K. Toyota, R. Fukuda, J. Hasegawa, M. Ishida, T. Nakajima, Y. Honda, O. Kitao, H. Nakai, T. Vreven, K. Throssell, J. A. Montgomery, Jr., J. E. Peralta, F. Ogliaro, M. J. Bearpark, J. J. Heyd, E. N. Brothers, K. N. Kudin, V. N. Staroverov, T. A. Keith, R. Kobayashi, J. Normand, K. Raghavachari, A. P. Rendell, J. C. Burant, S. S. Iyengar, J. Tomasi, M. Cossi, J. M. Millam, M. Klene, C. Adamo, R. Cammi, J. W. Ochterski, R. L. Martin, K. Morokuma, O. Farkas, J. B. Foresman, and D. J. Fox, Gaussian 16, Revision A.03, Gaussian, Inc., Wallingford CT, 2016 Search PubMed
.
- Z. Abedin-Siddique, Y. Yamamoto, T. Ohno and K. Nozaki, Inorg. Chem., 2003, 42, 6366–6378 CrossRef PubMed
.
- Z. Abedin-Siddique, T. Ohno, K. Nozaki and T. Tsubomura, Inorg. Chem., 2004, 43, 663–673 CrossRef CAS PubMed
.
- K. Nozaki, J. Chin. Chem. Soc., 2006, 53, 101–112 CrossRef CAS
.
- S. Obara, M. Itabashi, F. Okuda, S. Tamaki, Y. Tanabe, Y. Ishii, K. Nozaki and M. Haga, Inorg. Chem., 2006, 45, 8907–8921 CrossRef CAS PubMed
.
- J.-M. Lehn and R. Ziessel, J. Organomet. Chem., 1990, 382, 157–173 CrossRef CAS
.
- H. Ishida, K. Fujiki, T. Ohba, K. Ohkubo, K. Tanaka, T. Terada and T. Tanaka, J. Chem. Soc., Dalton Trans., 1990, 2155–2160 RSC
.
- Y. Kuramochi, O. Ishitani and H. Ishida, Coord. Chem. Rev., 2018, 373, 333–356 CrossRef CAS
.
- Y. Kuramochi, J. Itabashi, K. Fukaya, A. Enomoto, M. Yoshida and H. Ishida, Chem. Sci., 2015, 6, 3063–3074 RSC
.
- G. H. Allen, R. P. White, D. P. Rillema and T. J. Meyer, J. Am. Chem. Soc., 1984, 106, 2613–2620 CrossRef CAS
.
- N. M. O'boyle, A. L. Tenderholt and K. M. Langner, J. Comput. Chem., 2008, 29, 839–845 CrossRef PubMed
.
- P. A. Anderson, G. B. Deacon, K. H. Haarmann, F. R. Keene, T. J. Meyer, D. A. Reitsma, B. W. Skelton, G. F. Strouse, N. C. Thomas, J. A. Treadway and A. H. White, Inorg. Chem., 1995, 34, 6145–6157 CrossRef CAS
.
- E. Hasegawa, T. Seida, N. Chiba, T. Takahashi and H. Ikeda, J. Org. Chem., 2005, 70, 9632–9635 CrossRef CAS PubMed
.
- X.-Q. Zhu, M.-T. Zhang, A. Yu, C.-H. Wang and J.-P. Cheng, J. Am. Chem. Soc., 2008, 130, 2501–2516 CrossRef CAS PubMed
.
- J. J. Concepcion, J. W. Jurss, M. R. Norris, Z. Chen, J. L. Templeton and T. J. Meyer, Inorg. Chem., 2010, 49, 1277–1279 CrossRef CAS PubMed
.
- Y. Tamaki and O. Ishitani, Faraday Discuss., 2017, 198, 319–335 RSC
.
Footnote |
| † Electronic supplementary information (ESI) available: DFT-calculated characteristics of Os; emission quenching experiment; Franck–Condon analysis of emission spectrum with vibronic structure of Os; mirror image of S–T absorption and phosphorescence of Os; cyclic voltammogram of BI(OH)H; quantum yield for HCOOH production; visible absorption spectra of Os, Ru(CO) and BI(OH)H. See DOI: 10.1039/d1sc04045f |
| This journal is © The Royal Society of Chemistry 2021 |

