 Open Access Article
Nucleation kinetics of lithium phosphate precipitation†
Michael
Emmanuel‡
a,
Paszkál
Papp‡
a,
Gábor
Schuszter
 a,
Ágota
Deák
a,
László
Janovák
a,
Ágota
Tóth
a,
Ágota
Deák
a,
László
Janovák
a,
Ágota
Tóth
 a and
Dezső
Horváth
 *b
*b
aDepartment of Physical Chemistry and Materials Science, University of Szeged, Rerrich Béla tér 1., Szeged, H-6720, Hungary
bDepartment of Applied and Environmental Chemistry, University of Szeged, Rerrich Béla tér 1., Szeged, H-6720, Hungary. E-mail: horvathd@chem.u-szeged.hu
First published on 9th May 2022
Abstract
Lithium phosphate is an important material today in battery technology and catalysis, the source of which is gradually depleting. In this work we provide insights into the kinetics of lithium phosphate precipitation in a supersaturated solution, by monitoring the turbidity of a well-stirred reactant mixture at different concentrations and temperatures. The analysis of experimental data has revealed that nucleation can be described by a power law resembling mass action kinetics. The constructed reaction kinetic model that includes consecutive reversible complex formation preceding the heterogeneous reaction provides data which quantitatively match the experimental results, allowing detailed explanation of the mechanism of nucleation. Classical nucleation theory applied for the homogeneous nucleation of sparingly soluble salts is also consistent with the experiments.
1 Introduction
The importance of crystal shape and stability to industrial processes and pharmaceutical products1–4 prompted many research into the structural arrangement, physical and chemical properties, and medical activities of different crystals. The formation of crystalline materials through nucleation and growth is an intricate network in which a heterogeneous chemical reaction is coupled to various transport processes. The former brings in nonlinearity by the existence of positive feedback during growth, allowing self-organization and self-assembly. A rapid increase of reaction rate in such systems can be observed after an induction time characterized by small rates under suitable conditions. The control of transport processes involved hence provides the possibility of fine tuning the morphology of synthesized crystals. Microfluidic techniques due to their well-defined fluid flow have successfully been utilized in studying precipitation reactions.5–6 In droplet-based microfluidics in confinement, for example, calcium carbonate polymorph control7–10 has been achieved and protein crystallization5 has been studied to understand phase behavior. On a larger scale, flow-driven systems also provide morphology control.11 The dihydrate form of calcium oxalate, generally a by-product in well-stirred systems, can be formulated in the presence of spatial gradients generated by flow.12,13 Spatial separation of cobalt oxalate from a mixture has been achieved in a gravity-current-driven system in a Hele–Shaw crystallizer,14,15 and lysozyme crystallization has been studied using a meso-oscillatory flow reactor showing various morphologies at different concentrations.16,17 Biomimetic conditions have also been applied for calcium carbonate18 and guanine19 crystallization providing possible control. In many experiments the reactants are initially spatially separated and injection brings them into contact, in which case the pumping order can also change the morphology of the formed crystals, as observed for cerium phosphate20 or in reverse chemical gardens.21,22 Hence, the method of mixing11–14,20,23 as well as the strength of agitation24 significantly contributes to the reaction conditions that determine the resultant crystal properties. The external control of transport processes allows the fine tuning of the time scales associated with them. These, in turn, couple to the chemical time scale of precipitation; therefore, a posteriori knowledge of the latter is essential in interpreting the outcome of the resultant reaction–diffusion–advection system.The rate of nucleation can be determined by monitoring the turbidity, focused beam reflectance count,25 pH changes,26 and conductivity.25,27 For small supersaturation classical nucleation theory is used to describe nucleation,28,4 whereas the kinetic approach is more often applied for barely soluble electrolytes at high supersaturation29,30 as well as for nanoparticle formation.31 In this work we go beyond binary electrolytes, where several kinetic studies have been performed,29,32 and investigate the nucleation of lithium phosphate in a well-stirred system.
Lithium phosphate is a key compound in the recycling of lithium ion batteries. Thorough knowledge of its precipitation may prove to be important in enhancing the technology. It can also maintain a chemical garden, a growing hollow structure that separates the inner liquid containing lithium ion from the outer phosphate solution. In earlier work, we have shown that in a microfluidic device, polycrystalline lithium phosphate particles grow with orientation dependent rates. This is a direct consequence of the coupling between diffusional and advective transport.
In this work, we aim at studying the kinetics of precipitation of lithium phosphate by determining the induction times obtained through turbidity measurements at different concentrations and temperatures in a well-stirred system. For the qualitative description we construct a reaction kinetic model applicable to nucleation at high supersaturation far from thermodynamic equilibrium. Finally a microscopy study of the crystals and their X-ray diffraction data are presented to determine the morphology of the solid particles.
2 Experimental section
We prepared filtered stock solutions of lithium chloride and sodium phosphate from analytical grade chemicals of LiCl (BDH) and Na3PO4·12H2O (Sigma-Aldrich) using ion-exchanged water (Purite RO100, κ = 2.1 μS cm−1 at 25 °C).The precipitation was monitored by measuring turbidity at 340 nm with a UV-spectrophotometer (UV-3100PC) equipped with an in-built magnetic stirrer and a thermostated cuvette holder (VWR A-100). The background turbidity was set with 2 mL LiCl solution in a standard, commercially available quartz cuvette with 1 cm × 1 cm × 4 cm size, after which 1 mL solution was withdrawn. The reaction was started by pipetting 1 mL Na3PO4 solution into the cuvette and stirring it. The turbidity measurement was repeated at least four times for each set of concentrations with stoichiometric ratio R = [Li+]0/[PO3−4]0 = 3, where the concentrations with 0 in subscript represent the initial concentrations of the reactants with the initial concentration of sodium phosphate ranging from 0.060 M to 0.20 M.
Thermal effects were studied at stoichiometric ratios with [Na3PO4]0 = 0.030 M at different temperatures ranging between 25 and 50 °C with 0.01 °C precision. After each experiment, the cuvette was removed and placed in 1 M HCl for a 5 min-long sonication (Elmasonic S 60 H) to dissolve any precipitate from the cuvette wall and crevices prior to washing and rinsing with deionized water.
The changes in the crystal morphology and size were studied at temperatures of 25, 36, and 50 °C by mixing 100 mL 0.18 M LiCl with 100 mL 0.06 M Na3PO4. Aliquots of 60 mL of the reacting mixture were withdrawn at various times, filtered using a syringe filter cap (cellulose acetate membrane, 0.2 μm), washed with ion-exchanged water, and air dried.
The density of the solid lithium phosphate powder was measured to be 2.397 g cm−3 by a helium gas multivolume pycnometer (Micromeritics 1305).
2.1 Characterization
Crystal samples were collected at temperatures of (25.0 ± 0.2) °C, (36.0 ± 0.2) °C, and (50.0 ± 0.2) °C, at different stages of the crystallization process. The dried crystals were examined under a scanning electron microscope (Hitachi S4700) with a vacuum accelerating voltage of 20 kV to obtain higher resolution, after sputtering the sample with gold in a vacuum for 2 minutes to improve surface conduction. The sizes of at least 300 crystal particles from several SEM images were measured using ImageJ software and their distribution was also determined. X-ray diffractograms of the powdered Li3PO4 samples were recorded on a Philips X-ray diffractometer (PXRD) with CuKα = 0.1542 nm, as the radiation source at ambient temperature in the 2–70° (2θ) range in 0.02° steps. The crystallinity was determined using Match! software and the crystallite sizes were calculated from Scherrer's equation.3 Results and discussion
3.1 Kinetics and thermodynamics
Upon mixing the reactants, the solution turbidity remains almost zero during the induction time (1) as shown in Fig. 1. This is followed by a rapid increase in turbidity, termed the growth region (2), during which growth is dominated by the increase in either the number of nucleation sites or crystal size until a maximum turbidity or plateau is reached. The solution finally becomes saturated with the precipitate (3) with only slow aggregation taking place beyond the time span of the experiment. The increase of reactant concentration not only shortens the induction time by increasing the reaction rate but also increases the turbidity at the end of the growth period due to the production of more precipitate.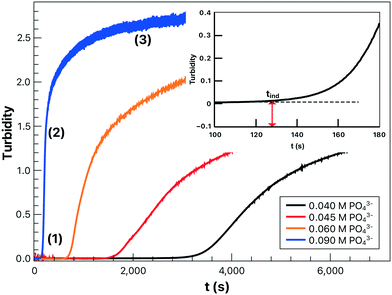 | ||
| Fig. 1 Turbidity profiles for lithium phosphate at different initial reactant concentrations and (inset) the determination of induction time at 25 °C with R = 3. | ||
The induction time, defined as the time at which the initial part of the turbidity curve starts to deviate from the linear background (see the inset of Fig. 1), is inversely proportional to the initial rate of nucleation. Hence the concentration dependence is sought as a power law in the form of
 | (1) |
The experimentally determined exponent in the power law b has a value of 4.22 ± 0.04. This indicates that the association of reactant ions takes place in the apparent rate determining step for nucleation.
In our experiments we have not observed the dependence of induction time on the material of the cuvette as shown in the ESI,† and the parallel runs have yielded reproducible results, indicating that the unavoidable dust particles have no significant effects. This suggests that homogeneous nucleation dominates the process in accordance with the very high supersaturation used (S = 1.0 × 10⁴ – 2 × 10⁶), where supersaturation S is defined as
 | (2) |
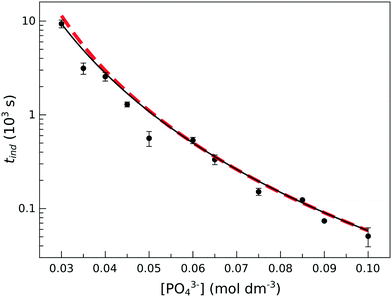 | ||
| Fig. 2 Induction time as a function of initial phosphate concentration at T = 25 °C. The black solid line shows the power-law fitting according to eqn (1). The red dashed line represents the calculated induction times from the kinetic model based on eqn (9)–(13). | ||
This concentration dependence can also be related to the classical nucleation theory (CNT), according to which the nucleation rate J can be expressed as a function of supersaturation33 as
 | (3) |
 | (4) |
 | (5) |
 | (6) |
 | (7) |
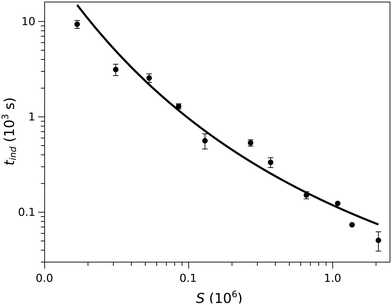 | ||
| Fig. 3 The induction time as a function of supersaturation. The black line shows the dependence according to the classical nucleation theory. | ||
Because of the temperature dependence of the rate coefficients, the induction time is expected to increase exponentially with T−1 as
 | (8) |
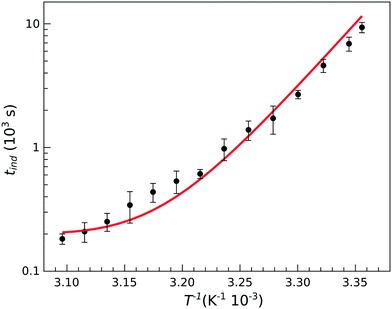 | ||
| Fig. 4 Temperature dependence of the induction time for stoichiometric composition with [PO43−]0 = 0.030 M. The solid line shows the results of modeling. | ||
However, at higher temperatures there is a deviation from the simple exponential dependence because nucleation is found to be slower than expected. The apparent activation energy at temperatures above 35 °C is about half of that found at lower temperatures (86.3 kJ mol−1vs. 175 kJ mol−1). This suggests that the rate determining step in the nucleation process is preceded by reaction steps so that the apparent rate coefficient contains several others with different activation energies.
3.2 Modeling the precipitation reactions
In our experimental study supersaturation is high, and the system is far from thermodynamic equilibrium; therefore, we follow a reaction kinetic approach for the description of the onset of precipitation. We first consider the stepwise reversible reactions between lithium and phosphate ions according to | (9) |
 | (10) |
 | (11) |
 | (12) |
 | (13) |
Lithium complexes are kinetically unstable and do not accumulate; therefore, the reverse directions of eqn (9)–(11) are favored, i.e., kic0 ≪ k−i for i ∈ [1,3] at room temperature. The overall equilibrium constant K is
 | (14) |
The differential equations are solved using the backward differentiation method of the CVODE package with a time step of 0.01 s, relative tolerance of 10−12 and absolute tolerance of 10−11 mol dm−3. The induction time in the calculations is defined as the time required to form a sufficient amount of Li3PO4(aq) to make up a particle with 1 μm diameter in a (200 × 200 × 200) μm3 unit volume corresponding to 1.3 × 10⁻⁶ M concentration.
Parameter fitting is obtained by applying the weighted least squares method on the induction times with respect to the experimentally determined values at various concentrations. For the room temperature parameter set, the values of ki (i = 1…3) and k4 are varied to find the best fit for all data points.
For the forward steps (i = 1…3), we follow Logan's description of diffusion controlled reactions,37 for which Ea = ![[Fraktur B]](https://www.rsc.org/images/entities/char_e17f.gif) + RT where
+ RT where ![[Fraktur B]](https://www.rsc.org/images/entities/char_e17f.gif) can be expressed from the temperature dependence of dynamic viscosity as η =
can be expressed from the temperature dependence of dynamic viscosity as η = ![[Fraktur A]](https://www.rsc.org/images/entities/char_e17e.gif)
![[thin space (1/6-em)]](https://www.rsc.org/images/entities/char_2009.gif) exp(
exp(![[Fraktur B]](https://www.rsc.org/images/entities/char_e17f.gif) /(RT)). This yields E(a,i) = 19.5 kJ mol−1 (i = 1…3) for our model. The activation energies are linked to the reaction enthalpy of the net reaction (ΔrH0 = 16.5 kJ mol−1),36 which we have also taken into account. In the fitting procedure, therefore, the values of E(a,−i) (i = 1…3) and E(a,4) are varied to find the best match for the entire data set with different temperatures. The activation energies, similarly to the rate coefficients, do not decouple for the homogeneous consecutive reaction of eqn (9)–(11), so that we use one value for them, which represents a mean activation energy and rate coefficient, respectively.
/(RT)). This yields E(a,i) = 19.5 kJ mol−1 (i = 1…3) for our model. The activation energies are linked to the reaction enthalpy of the net reaction (ΔrH0 = 16.5 kJ mol−1),36 which we have also taken into account. In the fitting procedure, therefore, the values of E(a,−i) (i = 1…3) and E(a,4) are varied to find the best match for the entire data set with different temperatures. The activation energies, similarly to the rate coefficients, do not decouple for the homogeneous consecutive reaction of eqn (9)–(11), so that we use one value for them, which represents a mean activation energy and rate coefficient, respectively.
For the induction times at room temperature, there is a linear relationship between lgk4 and lgki, (i = 1…3) within the best fit obtained for the experimental data, as shown by the fit parameter (Σ) representing the goodness of fit in Fig. S2 in the ESI.† The individual fits for various k4 here remain indistinguishable (see Fig. S3 in the ESI†).
When temperature dependence is considered, the results with different values of k4 decouple, as seen by the deviating curves in Fig. S4 in the ESI.† In addition, the appearance of a well-defined minimum for the fitting function ensures the optimization of activation energies (see Fig. S5†). With the best set of parameters, the induction times can be reconstructed by the model with an average error of 17%, which falls in the range of experimental errors (13%). The high order with respect to the reactant concentration (see Fig. 2), the dependence of induction time on supersaturation (see Fig. S1 in the ESI†) and the decrease in the apparent activation energy (see Fig. 4) are returned by our model calculations. This results from the relations E(a,i) < E(a,−i) and E(a,4) > E(a,i).
3.3 Microstructure
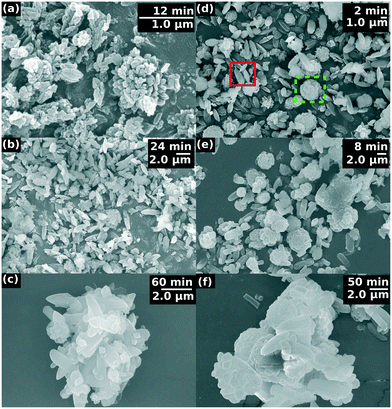
Two different crystalline structural forms can be distinguished in the SEM images of the final product of the precipitation process, as illustrated in Fig. 5. One of the forms is a flat-sheet-like crystal, and the other is a floral shaped crystal arising from the aggregation of fractured flat-sheet-like crystals because of the agitation via vigorous stirring. During fracturing, defects develop where oriented attachment is favored, changing the symmetry of the final morphology.At the induction time, flat-sheet-like crystals appear mono-dispersed with a size of ≈ 0.1 μm and a polydispersity index PDI = 0.07 (for definition see the ESI†) at 36 °C. The crystals then start to grow and aggregate resulting in polydispersed particles of size ≈ 1.0 μm and PDI = 0.28. By the end of the investigation time the crystals reach ≈ 2.0 μm with a polydispersity of PDI = 0.27 (see Fig. 6a). A similar trend is observed in the size distribution at 50 °C (see Fig. 6b).
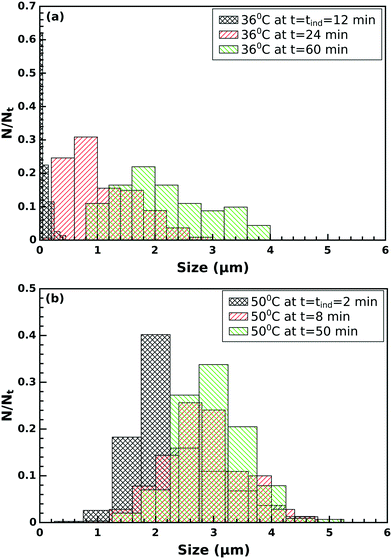 | ||
| Fig. 6 Particle size distribution (a) at 36 °C and (b) at 50 °C at different times for flat-sheet-like crystals. | ||
X-ray diffraction data has revealed that the crystals formed are orthorhombic belonging to the Pmn21 space group, known as β-Li3PO4 (see the ESI†), independent of the temperature between 25 and 50 °C. At moderate temperature, the average crystallite size, summarized in Table 1, increases as precipitation progresses. Crystallinity ranges from 59% to 83%, with lower values corresponding to the room-temperature case. Crystallinity increases with time, suggesting that there is a form of ordering taking place from the appearance of the first nucleus. There is one exception, at higher temperature, where the particles are aggregated leading to a decrease in crystallinity.
| T | t | a | b | c | D | w c,X |
|---|---|---|---|---|---|---|
| (°C) | (min) | (Å) | (Å) | (Å) | (Å) | % |
| 25 | 180 | 6.1724 | 5.3025 | 4.8856 | 181 | 59 |
| 36 | 12 | 6.0385 | 5.2649 | 4.8900 | 224 | 68 |
| 36 | 24 | 6.0836 | 5.2774 | 4.6766 | 222 | 71 |
| 36 | 60 | 6.1257 | 5.2548 | 4.8950 | 252 | 79 |
| 50 | 2 | 6.1292 | 5.2774 | 4.7395 | 268 | 72 |
| 50 | 8 | 6.1292 | 5.2527 | 4.8768 | 313 | 83 |
| 50 | 50 | 6.1250 | 5.2649 | 4.8900 | 326 | 69 |
9![[thin space (1/6-em)]](https://www.rsc.org/images/entities/char_2009.gif) 012 012![[thin space (1/6-em)]](https://www.rsc.org/images/entities/char_2009.gif) 500 500 |
6.1150 | 5.2394 | 4.8554 | — | — | |
4 Conclusion
At high supersaturation where solid particles nucleate and grow fast, making monitoring with dynamic light scattering ineffective, turbidity measurement is found to be useful for the study of nucleation kinetics. We have shown that a power law resembling the law of mass action can be applied to describe the nucleation of lithium phosphate with initial reactant concentrations in a stoichiometric ratio.The simple model that involves reversible complex formations prior to nucleation can provide a quantitative description of the nucleation rate. The high exponent in the power law results from the equilibria associated with the complexation reaction being shifted towards the reactants although a minor contribution from heterogeneous nucleation cannot be excluded. The constructed model is also capable of returning the temperature dependence of induction time, which cannot be described with a single activation energy. The deviation from the classical Arrhenius equation is characterized by longer induction times at higher temperatures. This originates from the greater activation energy of the heterogeneous reaction step compared to those of the preceding homogeneous complex formations, as shown by our model calculations.
Independent of the temperature and concentration, but maintaining R = 3, crystals of flat-sheet-like and floral shapes are produced. They belong to the orthorhombic space group, classified by SEM and XRD measurements. The crystallite sizes and crystallinity increase slightly as the reaction temperature increases.
The study has also shown that a kinetic approach for the description of nucleation can be extended to general electrolytes, beyond binary, even at high supersaturation.
Author contributions
Michael Emmanuel: experimental investigation, formal analysis, writing – original draft, Paszkál Papp: modeling investigation, calculations, program writing, writing – original draft, Gábor Schuszter: SEM measurements, Ágota Deák and László Janovák: XRD measurements, Dezső Horváth and Ágota Tóth: conceptualization, methodology, validation, funding acquisition. All the authors contributed to writing – review and editing.Conflicts of interest
There are no conflicts to declare.Acknowledgements
This work has been supported by the National Research, Development and Innovation Office (NN125746 and K138844). PP gratefully acknowledges the support of the New National Excellence Program (ÚNKP-21-3) of the Ministry of Innovation and Technology from the source of the National Research, Development and Innovation Fund. Project no. TKP2021-NVA-19 has been implemented with the support provided by the Ministry of Innovation and Technology of Hungary from the National Research, Development and Innovation Fund, financed under the TKP2021-NVA funding scheme. We thank the University of Szeged Open Access Fund (5748) for support.References
- T. Sasaki, Y. Ida, A. Tanaka, I. Hisaki, N. Tohnai and M. Miyata, Chiral crystallization by non-parallel face contacts on the basis of three-axially asymmetric twofold helices, CrystEngComm, 2013, 15, 8237–8240 RSC
.
- B. Rimez, J. Conte, E. Lecomte-Norrant, P. Cognet, C. Gourdon and B. Scheid, Continuous-flow tubular crystallization to discriminate between two competing crystal polymorphs. 2. Antisolvent crystallization, Cryst. Growth Des., 2018, 18, 6440–6447 CrossRef CAS
.
- Y. Liu, B. Gabriele, R. J. Davey and A. J. Cruz-Cabeza, Concerning elusive crystal forms: The case of paracetamol, J. Am. Chem. Soc., 2020, 142, 6682–6689 CrossRef CAS PubMed
.
- C. Devos, T. Van Gerven and S. Kuhn, A review of experimental methods for nucleation rate determination in large-volume batch and microfluidic crystallization, Cryst. Growth Des., 2021, 21, 2541–2565 CrossRef CAS
.
- J. Ferreira, F. Castro, F. Rocha and S. Kuhn, Protein crystallization in a droplet-based microfluidic device: Hydrodynamic analysis and study of the phase behaviour, Chem. Eng. Sci., 2018, 191, 232–244 CrossRef CAS
.
- Q. Wang and O. Steinbock, Chemical garden membranes in temperature-controlled microfluidic devices, Langmuir, 2021, 37, 2485–2493 CrossRef CAS PubMed
.
- A. Yashina, F. Meldrum and A. Demello, Calcium carbonate polymorph control using droplet-based microfluidics, Biomicrofluidics, 2012, 6, 22001–22011 CrossRef PubMed
.
- Y. Wang, M. Zeng, F. C. Meldrum and H. K. Christenson, Using confinement to study the crystallization pathway of calcium carbonate, Cryst. Growth Des., 2017, 17, 6787–6792 CrossRef CAS
.
- L. Li, J. R. Sanchez, F. Kohler, A. Røyne and D. K. Dysthe, Growth of calcite in confinement, Crystals, 2017, 7, 361 CrossRef
.
- L. Li, J. R. Sanchez, F. Kohler, A. Røyne and D. K. Dysthe, Microfluidic control of nucleation and growth of CaCO3, Cryst. Growth Des., 2018, 18, 4528–4535 CrossRef CAS
.
- B. Bohner, G. Schuszter, D. Horváth and Á. Tóth, Morphology control by flow-driven self-organizing precipitation, Chem. Phys. Lett., 2015, 631–632, 114–117 CrossRef CAS
.
- B. Bohner, G. Schuszter, O. Berkesi, D. Horváth and Á. Tóth, Self-organization of calcium oxalate by flow-driven precipitation, Chem. Commun., 2014, 50, 4289–4291 RSC
.
- G. Laffite, C. Leroy, C. Bonhomme, L. Bonhomme-Coury, E. Letavernier, M. Daudon, V. Frochot, J. P. Haymann, S. Rouziére, I. T. Lucas, D. Bazin, F. Babonneau and A. Abou-Hassan, Calcium oxalate precipitation by diffusion using laminar microfluidics: toward a biomimetic model of pathological microcalcifications, Lab Chip, 2016, 16, 1157–1160 RSC
.
- E. Tóth-Szeles, G. Schuszter, A. Tóth, Z. Kónya and D. Horváth, Flow-driven morphology control in the cobalt-oxalate system, CrystEngComm, 2016, 18, 2057–2064 RSC
.
- E. Tóth-Szeles, B. Bohner, A. Tóth and D. Horváth, Spatial separation of copper and cobalt oxalate by flow-driven precipitation, Cryst. Growth Des., 2017, 17, 5000–5005 CrossRef
.
- F. Castro, A. Ferreira, J. A. Teixeira and F. Rocha, Protein Crystallization As a Process Step in a Novel Meso Oscillatory Flow Reactor: Study of Lysozyme Phase Behavior, Cryst. Growth Des., 2016, 16, 3748–3755 CrossRef CAS
.
- F. Castro, A. Ferreira, J. A. Teixeira and F. Rocha, Influence of mixing intensity on lysozyme crystallization in a meso oscillatory flow reactor, Cryst. Growth Des., 2018, 18, 5940–5946 CrossRef CAS
.
- G. Zhang, C. Verdugo-Escamilla, D. Choquesillo-Lazarte and J. M. García-Ruiz, Thermal assisted self-organization of calcium carbonate, Nat. Commun., 2018, 9, 5221 CrossRef CAS PubMed
.
- F. Chen, D. Guo, J. Gao and Y. Ma, Bioinspired crystallization of guanine, J. Phys. Chem. Lett., 2021, 12, 11695–11702 CrossRef CAS PubMed
.
- P. Pusztai, E. Tóth-Szeles, D. Horváth, A. Tóth, A. Kukovecz and Z. Kónya, A simple method to control the formation of cerium phosphate architectures, CrystEngComm, 2015, 17, 8477–8485 RSC
.
- J. J. Pagano, T. Bánsági Jr. and O. Steinbock, Tube formation in reverse silica gardens, J. Phys. Chem. C, 2007, 111, 9324–9329 CrossRef CAS
.
- F. Haudin, J. H. E. Cartwright and A. De Wit, Direct and reverse chemical garden pattern grown upon injection in confined geometries, J. Phys. Chem. C, 2015, 119, 15067–15076 CrossRef CAS
.
- M. Emmanuel, D. Horváth and Á. Tóth, Flow-driven crystal growth of lithium phosphate in microchannels, CrystEngComm, 2020, 22, 4887–4893 RSC
.
- S. Ivan and M. Egon, Homogeneous precipitation of calcium carbonates by enzyme-catalyzed reaction, J. Colloid Interface Sci., 2001, 238, 208–214 CrossRef PubMed
.
- J. Schöll, L. Vicum, M. Müller and M. Mazzotti, Precipitation of L-glutamic acid: Determination of nucleation kinetics, Chem. Eng. Technol., 2006, 29, 257–264 CrossRef
.
- N. Spanos and P. G. Koutsoukos, Kinetics of precipitation of calcium carbonate in alkaline pH at constant supersaturation. Spontaneous and seeded growth, J. Phys. Chem. B, 1998, 102, 6679–6684 CrossRef CAS
.
- T. Maqbool, P. Srikiratiwong and H. S. Fogler, Effect of temperature on the precipitation kinetics of asphaltenes, Energy Fuels, 2011, 25, 694–700 CrossRef CAS
.
- C. Brandel and J. H. ter Horst, Measuring induction times and crystal nucleation rates, Faraday Discuss., 2015, 179, 199–214 RSC
.
- N. P. Das, B. Müller, A. Tóth, D. Horváth and G. Schuszter, Macroscale precipitation kinetics: Towards complex precipitate structure design, Phys. Chem. Chem. Phys., 2018, 20, 19768–19775 RSC
.
- M. A. McDonald, H. Salami, P. R. Harris, C. E. Lagerman, X. Yang, A. S. Bommarius, M. A. Grover and R. W. Rousseau, Reactive crystallization: a review, React. Chem. Eng., 2021, 6, 364–400 RSC
.
- A. Forgács, K. Moldován, P. Herman, E. Baranyai, I. Fábián, G. Lente and J. Kalmár, Kinetic model for hydrolytic nucleation and growth of TiO2 nanoparticles, J. Phys. Chem. C, 2018, 122, 19161–19170 CrossRef
.
- N. P. Das, R. Zahorán, L. Janovák, A. Imre-Deák, A. Tóth, D. Horváth and G. Schuszter, Kinetic characterization of precipitation reactions: Possible link between a phenomenological equation and reaction pathway, Cryst. Growth Des., 2020, 20, 7392–7398 CrossRef CAS
.
-
J. W. Mullin, Crystallization, Butterworth-Heidemann, Oxford, 2001 Search PubMed
.
- O. Söhnel and J. Mullin, A method for the determination of precipitation induction periods, J. Cryst. Growth, 1978, 44, 377–382 CrossRef
.
- A. Mersmann, Calculation of interfacial tensions, J. Cryst. Growth, 1990, 102, 841–847 CrossRef CAS
.
-
Handbook of Chemistry and Physics, ed. R. C. Weast, CRC Press Inc., Cleveland, 2005 Search PubMed
.
- S. Logan, Arrhenius activation energy of reactions that are almost diffusion-controlled, J. Chem. Soc., Faraday Trans. 1, 1977, 73, 592–595 RSC
.
- C. Keffer, A. D. Mighell, F. Mauer, H. E. Swanson and S. Block, Crystal structure of twinned low-temperature lithium phosphate, Inorg. Chem., 1967, 6, 119–125 CrossRef CAS
.
Footnotes |
| † Electronic supplementary information (ESI) available. See DOI: https://doi.org/10.1039/d2ce00333c |
| ‡ These authors contributed equally to the work. |
| This journal is © The Royal Society of Chemistry 2022 |

