 Open Access Article
Development of advanced electrolytes in Na-ion batteries: application of the Red Moon method for molecular structure design of the SEI layer
Amine Bouibesab,
Norio Takenakabc,
Kei Kubota bd,
Shinichi Komaba
 bd and
Masataka Nagaoka
 *ab
*ab
aGraduate School of Informatics, Nagoya University, Furo-cho, Chikusa-ku, Nagoya 464-8601, Japan. E-mail: mnagaoka@i.nagoya-u.ac.jp
bESICB, Kyoto University, Nishikyo-ku, Kyoto 615-8245, Japan
cGraduate School of Engineering, The University of Tokyo, 7-3-1, Hongo, Bunkyo-ku, Tokyo 113-8656, Japan
dDepartment of Applied Chemistry, Tokyo University of Science, 1–3 Kagurazaka, Shinjuku, Tokyo 162-8601, Japan
First published on 5th January 2022
Abstract
This review aims to overview state-of-the-art progress in the collaborative work between theoretical and experimental scientists to develop advanced electrolytes for Na-ion batteries (NIBs). Recent investigations were summarized on NaPF6 salt and fluoroethylene carbonate (FEC) additives in propylene carbonate (PC)-based electrolyte solution, as one of the best electrolytes to effectively passivate the hard-carbon electrode with higher cycling performance for next-generation NIBs. The FEC additive showed high efficiency to significantly enhance the capacity and cyclability of NIBs, with an optimal performance that is sensitive at low concentration. Computationally, both microscopic effects, positive and negative, were revealed at low and high concentrations of FEC, respectively. In addition to the role of FEC decomposition to form a NaF-rich solid electrolyte interphase (SEI) film, intact FECs play a role in suppressing the dissolution to form a compact and stable SEI film. However, the increase in FEC concentration suppressed the organic dimer formation by reducing the collision frequency between the monomer products during the SEI film formation processes. In addition, this review introduces the Red Moon (RM) methodology, recent computational battery technology, which has shown a high efficiency to bridge the gap between the conventional theoretical results and experimental ones through a number of successful applications in NIBs.
1. Introduction
Today, rechargeable Li-ion batteries (LIBs) are widely used as a standard portable energy source for supplying electricity to various electronic devices and everyday appliances.1 However, there is still a great deal of interest in developing higher-performance rechargeable batteries for more comprehensive applications such as for electric vehicles (EVs), while ensuring their safety and economic profitability.1,2 For that, research interest in Na-ion batteries (NIBs) has rapidly increased since 2010 as a promising alternative to LIBs for large-scale energy storage.3 In fact, the abundance of sodium resources (23![[thin space (1/6-em)]](https://www.rsc.org/images/entities/char_2009.gif) 600 ppm) compared with those of lithium (20 ppm) was the apparent and straightforward reason as to why sodium ions are attractive as charge carriers for rechargeable batteries.3,4 Also, sodium's electrochemical equivalent and standard potential are advantageous for aprotic battery applications after lithium.5 However, despite some similarities in the chemistry between Na and Li systems, the practical use of NIBs seems not to be easy compared with the state-of-the-art and high-energy LIBs using graphite and LiCoO2 system.3 In fact, the energy density was shown to be much lower for the Na system when the same chemistry with the Li system is used to compare LiCoO2 and NaCoO2 cathodes.6,7 Also, the graphite, considered as a one of the favorable candidate for Li insertion hosts with a high reversible capacity (theoretically 372 mA h g−1), cannot be used in ester-based electrolyte of NIB8–12 due to the weaker binding between Na+ ions and graphite sheets which prevent their insertion into the graphite, compared to the Li ions ones.13 Hence, several studies have been executed to optimize NIB constituent materials, such as electrodes, electrolytes, and additives for a next-generation battery that possesses environmental and cost friendliness.3,14,15
600 ppm) compared with those of lithium (20 ppm) was the apparent and straightforward reason as to why sodium ions are attractive as charge carriers for rechargeable batteries.3,4 Also, sodium's electrochemical equivalent and standard potential are advantageous for aprotic battery applications after lithium.5 However, despite some similarities in the chemistry between Na and Li systems, the practical use of NIBs seems not to be easy compared with the state-of-the-art and high-energy LIBs using graphite and LiCoO2 system.3 In fact, the energy density was shown to be much lower for the Na system when the same chemistry with the Li system is used to compare LiCoO2 and NaCoO2 cathodes.6,7 Also, the graphite, considered as a one of the favorable candidate for Li insertion hosts with a high reversible capacity (theoretically 372 mA h g−1), cannot be used in ester-based electrolyte of NIB8–12 due to the weaker binding between Na+ ions and graphite sheets which prevent their insertion into the graphite, compared to the Li ions ones.13 Hence, several studies have been executed to optimize NIB constituent materials, such as electrodes, electrolytes, and additives for a next-generation battery that possesses environmental and cost friendliness.3,14,15
After that, it was demonstrated that hard-carbon (nongraphitizable carbon) and NaNi0.5Mn0.5O2 electrodes were more suitable for rechargeable Na-ion cells and operable at room temperature.5 However, the design of the advanced electrolytes remains a fundamental challenge for next-generation NIB. An appropriate electrolyte selection is essential to enhance the electrochemical performance, maximize the ionic conductivity, and suitably passivate the hard-carbon anodes with a stable solid electrolyte interphase (SEI) layer. In fact, the SEI is mainly built during the first charging cycle prior to use and is considered part of the manufacturing process.16,17 Ideally, the SEI should be an electron-insulating yet a good ion-conductive, thus kinetically preventing further electrolyte decomposition and prohibiting direct contact between electrode and electrolyte in providing good performance and long lifetime.18–22 However, previous studies showed that NIB often suffers from the short cycle lifetime, which is attributed partly to the difficulty to form a stable SEI film in the sodium system compared with the lithium system.5 This difficulty was considered to arise from the difference in the Lewis acidity of Li+ and Na+ cations as well as the solubility of their SEI components.5,23–25 In fact, the weaker Lewis acidity of Na+ cation than that of Li+ results in a weaker coulombic interaction of Na+ with anions and then the higher ion transport properties than that of Li+ cation. Consequently, the transfer of Na+ cation at the interface between the electrode and electrolyte should be faster in NIBs, as well as the dissolution of SEI compounds.23
To overcome the above drawbacks, previous studies showed that fluoroethylene carbonate (FEC) as an electrolyte additive enhances the cycling performance of NIBs.26 Since such an electrolyte additive as FEC was considered to be crucial for Na-ion battery performance, much attention has been attracted on the development of new electrolyte components and additives for Na-ion batteries, e.g., sodium-difluoro(oxalato)borate as an electrolyte salt27 and an additive,28 a ternary additive of FEC, prop-1-ene-1,3-sultone, and 1,3,2-dioxathiolane-2,2-dioxide,29 a quaternary additive,28 sodium difluorophosphate,30 and so on. Despite the recent advances of electrolyte additives, the systematic understanding of additive functionality is still underway. As broadly known in the community of Na-ion batteries, the conventional FEC additive showed high efficiency to improve the SEI layer formation and decrease the irreversible capacity at Na metal and hard-carbon electrodes.23,26 It was demonstrated that the FEC additive suppresses electrolyte decomposition as confirmed by soft X-ray photoelectron spectroscopy (XPS) measurement, leading to a decrease in the SEI thickness.26,31 Scanning electron microscopy (SEM) images showed that the SEI surface layer becomes clearly smoother in FEC-added electrolyte than in the FEC-free one, that is, the pristine electrolyte.31 In addition, the intact FEC molecules could also have a direction agent role to create an ordered orientation of electrolytes on the anode surface.32,33 It was suggested that this rearrangement of solvent molecules on the anode surface might be effective in reproducing the most suited SEI layer.32,33 However, some recent experimental studies have reported that NIB performance depends on the amount of FEC additive.26,34 The optimal performance was critically sensitive with the small amount of FEC additive, whereas the performance deteriorated by increasing the FEC amount.26,34 These experimental observations open intriguing questions about the dependency of the SEI formation on the FEC concentration. However, it is restrictive to experimentally identify the microscopic mechanism of the effect of FEC concentration because of the difficulty to directly prove the intermediate process of SEI formation on the anode surface. Thus, collaborative works of experimental and theoretical studies are necessary for a deep understanding of the microscopic mechanism of the SEI film formation.
Until today, SEI layer is considered one of the most important but least understood components in rechargeable batteries, regarding the complexity of its formation's chemical and electrochemical reactions and the insufficient direct measurement of its physical properties.35 Various computational methods have been applied, especially to enrich the understanding of the initial reduction of electrolyte components such as quantum chemical (QC) calculations,36–42 first-principle or ab initio-molecular dynamics (ab initio-MD),43–50 classical molecular dynamics (MD),51,52 and reaction force field (ReaxFF-MD) approaches.53,54 Indeed, multiple QC calculations studies were conducted to predict the reduction decomposition mechanism of electrolyte compounds.36–42 However, the application of QC calculations remain limited since the electrode effect is ignored. With significant improvements in computing power, ab initio-MD is considered as a powerful tool for studying electrolyte–electrode interfaces. This method has been used primarily to analyze the reductive decomposition process of electrolytes on an electrode surface in various battery systems.43–50 Still, ab initio-MD is limited to a relatively small scale and short time duration owing to its high computational cost. On the other hand, regarding force field molecular simulation methods, classical MD simulations were used mainly to investigate the electrolyte properties and the electric double layer.51,52 Nevertheless, ReaxFF-MD, which can qualitatively describe the forming/breaking of chemical bonds, was performed to analyze chemical reactions in rather large systems beyond the scope of ab initio-MD.53,54 However, the progress on the understanding of SEI remained still humble regarding the complexity of its heterogeneous substructure. In fact, the SEI film can be viewed as a multi-layered structure with an inorganic inner layer near the electrode/SEI interface that allows Na+ cation transport and an organic outer layer, which is heterogeneous, porous, and permeable to both Na+ and electrolyte solvent molecules, near the SEI/electrolyte interface.21,35 Recently, the heterogeneous SEI structure was successfully observed by in situ electrochemical atomic force microscopy (AFM) on a graphite electrode.55 The only limitations were in how such SEI structure is formed and what reactions dominate at each stage. Accordingly, some multiscale simulation methods were developed to elucidate such poorly understood intermediate steps of SEI film formation.
Red Moon (RM) methodology has been recently developed to model the SEI layer formation as a computational molecular technology capable of simulating a large-scale chemical reaction process from an initial state to the final one of complex chemical reaction systems.56–58 RM is a hybrid method combining Monte Carlo (MC) and MD methods that can treat the reaction process as a stochastic process.56–58 So far, this new atomistic reaction simulation has shown great applicability to reproduce the heterogeneous atomic structures of the SEI layer on the anode surface. Then, many application works have demonstrated that this method is predictive enough and, therefore, quite helpful to understand the microscopic mechanism concerning the SEI film formation in secondary batteries.59–65 Consequently, this review aims to shed light on the modeling progress of SEI formation using a new theoretical chemistry approach and correlate some predicted SEI properties with battery performance and degradation for the development of advanced secondary batteries electrolyte in NIBs.
2. Red Moon methodology: an overview
A preparatory study is required using QC calculations to perform the Red Moon (RM) method. By considering both experimental and theoretical data, QM calculation provides a chemical reaction scheme, which consists of a set of primary chemical reactions {(R1), (R2), …}, with their corresponding reaction energies and the free energies of activation. Once the chemical reaction scheme is assumed, the RM simulation is ready to be performed. The RM method consists of a combination of the following processes:1. Equilibrate the whole system through the classical NVT-MD simulation and obtain an initial configuration state r.
2. Generate reaction steps with the NVT-MC procedure and classical NVT-MD simulation, consisting of the following steps:
(i) Search for a pair (/pairs) of “reactive” atoms among reactant molecules with the whole system in a given configuration state r according to some criteria for whether possible chemical reactions (R1), (R2), … might occur. In the present study, the criterion for a candidate pair was taken to be whether the interatomic distance is less than the sum of their van der Waals (vdW) radii. As a result, a set of numbers of candidate pairs for each chemical reaction {NR1cand, NR2cand, …} among the possible primary chemical reactions is obtained in a given configuration state r.
(ii) Randomly select a chemical reaction (Ri) among (R1, R2, …) according to their corresponding relative weights of selection wR1, wR2, …, where a relative weight wRi for (Ri) is expressed by the product of NRicand and exp(−βΔERia) as follows,
wRi = NRicand![[thin space (1/6-em)]](https://www.rsc.org/images/entities/char_2009.gif) exp(−βΔERia) exp(−βΔERia)
| (1) |
In the present study, the appropriate values of ΔERia, the free energy of activation, were assumed for Scheme 1, reflecting on the characteristics of the current primary chemical reaction processes.59,60 Then, randomly select (a/) candidate pair (/pairs) among the candidate pairs for (Ri). If there are no pair for any chemical reactions, execute a short NVT-MD simulation instead of the following step (iii) and (iv) to update the configuration state.
(iii) Switch the atomic potential parameters and potential function forms of the reactant to those of the product, and virtually react it to generate a possible configuration state s, relaxing the whole system to obtain the state s through a short NVT-MD simulation.
(iv) Compute the energy change of the system ΔUrs = (Us − Ur) and accept (or reject) the reaction step according to the transition probability Wr→s under the Metropolis scheme,
| Wr→s = min{1,exp[−βΔUrs]} | (2) |
In the present study, ΔUrs is approximately estimated as follows,
| ΔUrs = ΔUMMrs + ΔUreac0 | (3) |
3. If the molecular mixture composition might scarcely change, then stop. Otherwise, return to process 2.
The MC/MD cycle of the three different types of processes mentioned above is called the “RM cycle”. By repeating the RM cycle, we can stochastically realize a succession of various types of chemical reaction many times, even if they occur competitively, and simulate reasonably dynamics of the whole system.
Indeed, the RM method has greatly succeeded in treating long-term successive complex chemical reaction processes to reproduce the SEI films' heterogeneous atomic structures on the anode surface. Also, the RM method has shown great applicability in simulating the dynamic effect on SEI film formation, such as the aggregation and the dissolution of the reduction reaction products.59–65 In addition, the RM method has recently shown a high efficiency to treat the dynamic processes of catalytic polymerization reactions.66,67 In fact, it can be applicable also to more complicated electrolyte systems such as polymer electrolytes or ionic liquids. On the other hand, it is also important to spell out some modeling limitations for this method, which must be understood carefully to overcome them in the future. For example, Marcus theory is not adopted presently in the electron transfer rate while performing RM simulation, although its incorporation would be possible in principle. In addition, the present RM method is not optimized for studying electron tunneling reactions.
3. Chemical reactions near the anode electrode and the SEI film formation in NIBs
The SEI layer formation occurs from the reduction of electrolytes at the anode surface due to the electron leakage from the anode during the first charging cycle. In fact, the electrolyte is electrochemically stable when the electrolyte's lowest unoccupied molecular orbital (LUMO) is higher than the Fermi energy of the anode; otherwise, the reduction of the electrolyte occurs. For that, the knowledge of the reductive process of the electrolyte, especially the intermediate products, should deepen the understanding of the SEI film formation. However, it is challenging to directly capture the reactions at the electrode/electrolyte interface experimentally, as some could occur at the picosecond (ps) timescale.Much effort has been provided to understand electrolyte reduction using first-principle calculations. The reductive decomposition mechanism of the complex, i.e., Na+-coordinated propylene carbonate solvent molecule (Na+-PC), was carefully investigated using sophisticated density functional theory (DFT) calculations as well as other complexes as Na+-FEC and Na+-coordinated trans-difluoroethylene carbonate (Na+-DFEC) additives.68 As results, the one-electron reduction of PC molecule undergoes a ring-opening reaction and yields sodium propyl carbonate (NaPC) by binding with Na+. Then, through a dimerization reaction of two NaPCs, the organic oligomer such as 2,3-dimethylsodium butylene dicarbonate (Na2DMBDC) is formed. The two-electron reduction of PC molecule yields the inorganic salts, i.e., sodium carbonate (Na2CO3) and propylene gas (C3H6). Experimentally, NaPC, Na2CO3, and propylene gas were observed as final products of PC-electrolyte reduction at the anode surface.5,26 Moreover, Na+–FEC complex decomposition was found more favorable in one-electron reduction (7.050 kcal mol−1) than in two-electron reduction (11.868 kcal mol−1). The one-electron reduction of Na+–FEC complex yields NaF, CHOCH2 radical, and CO2 as final products, while DFEC molecule decomposes to form Na2CO3 and C2H2F2 as the final products. On the other hand, FEC has the lowest activation barrier for reductive decomposition compared with PC and DFEC, while DFEC has the highest one. Based on these energetic results, the fast decomposition of FEC could enhance the formation of NaF-rich SEI layer. In contrast, the less favorable decomposition of DFEC could promote the presence of inactive DFEC molecules, which should cause large cavities during the SEI film formation and reduce the stability of SEI film.68
For deeper understanding, further investigations were accomplished on the molecular assembly of the reductive decomposition products. Then, RM simulations were performed to model the SEI formation in 1.1 M NaPF6/PC-based electrolyte on the carbon anode. Fig. 1 shows the model system with the reaction scheme of the PC system, assumed for RM simulations, with a charged anode surface. Only a list of primary reaction processes is adopted based on previous DFT calculations and experimental observations.5,26,59,60,68 Next, by executing RM simulations, the SEI film was successfully formed on the carbon anode surface. Fig. 2a shows the typical snapshots of four steps of the aggregation states consisting of the reductive decomposition products in NaPF6/PC-based electrolyte during different RM cycles, which could be equivalent to the time steps in SEI film formation process. Accordingly, the dissolute PC-derived products must aggregate toward the bulk electrolyte through a “near-shore aggregation mechanism”.59,60,69 Moreover, Fig. 2b shows the change in the number density of PC solvent and the reaction products as a function of RM cycles. Clearly, PC molecules were reduced first by one electron process and associated with a cation (Na+) forming NaPC with ring-opening reaction with lower activation energy. Then, NaPC complexes were also reduced forming Na2CO3 salts or dimer organic products (Na2DMBDC), which have been proposed as one of the major components in the anode SEI film, resulting from combination reactions of pairs of them via the radical dimerization. In Fig. 2c, the mass density distributions of SEI film products in NaPF6/PC-based electrolyte solution were reported. The inorganic products such as Na2CO3 salts were present near the anode surface, while the organic products, such dimers as Na2DMBDC, were extended to the outer region of the SEI film in contact with the electrolyte solution, as shown in Fig. 2c. These computational results are in excellent agreement with experimental observations in NIBs.70 On the other hand, some high peaks of dissoluted products appear in the bulk electrolyte solution due to the high transport properties of Na+ cation. To overcome such limitations, many investigations were focused on suppressing such dissolution of SEI components and optimizing the NIB electrolyte with appropriate additives.5,23,26,59,60,71
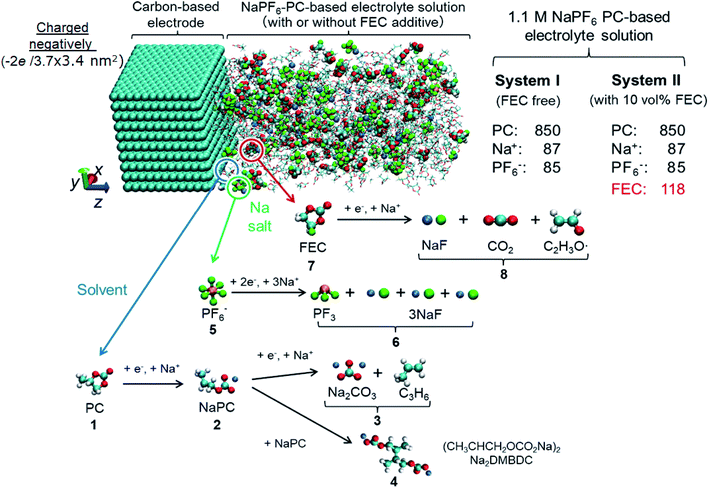 | ||
| Fig. 1 Model simulation system and reaction schemes in the PC-based electrolyte. (cyan: C, red: O, white: H, orange: P, green: F, blue: Na+). | ||
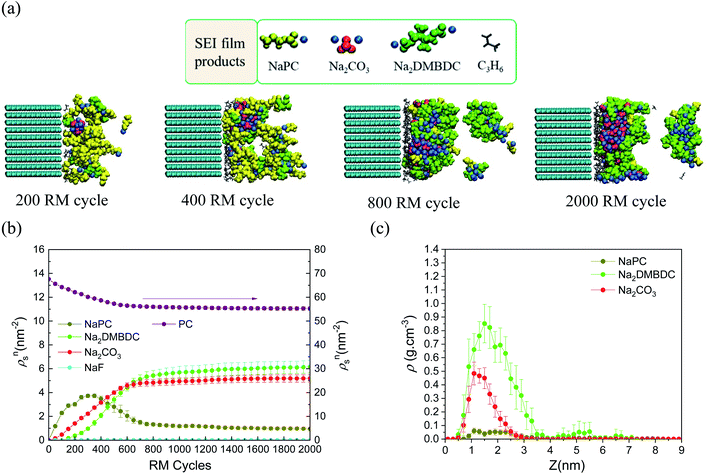 | ||
| Fig. 2 (a) Typical snapshots of SEI layer formation during RM cycles in PC-based electrolyte solution. (b) Surface number densities (ρsn) of SEI film products and solvent molecules,60 and (c) mass density distributions (ρ) of SEI products.60 Copyright 2018, American Chemical Society. | ||
4. Role of additives on the SEI formation in NIBs
Several additives were tested to improve the reversibility of electrochemical sodium insertion in NIBs. Among them, FEC, DFEC, ethylene sulfite (ES), and vinylene carbonate (VC), which are well-known to be the efficient electrolyte additives for LIBs, were examined for NIBs.23 As shown in Fig. 3, FEC was the most efficient electrolyte additive among FEC, DFEC, VC, and ES in NaPF6/PC-based electrolytes. In fact, the use of VC, ES, and DFEC as additives in NaPF6/PC solution deteriorated the initial reversible capacity.23 FEC additive was capable of the electrochemical Na deposition/dissolution with higher reversibility because of improved passivation and suppression of side reactions between Na metal and PC-based solution containing Na salts.5,23,26 In other words, FEC was effectively capable to improve the formation of a compact and dense SEI film in PC-based NIB electrolyte. Fig. 4 shows the carbon anode morphology in PC-based electrolytes with and without FEC additive after the first charging cycle. The SEM images confirm clearly that the carbon anode passivated in the properly FEC-added electrolyte has a smooth surface through an apparent increase of deposit on the carbon anode surface with the increase of FEC amount up to 10 vol%. In contrast, no apparent deposit was shown in FEC-free PC-based electrolytes.71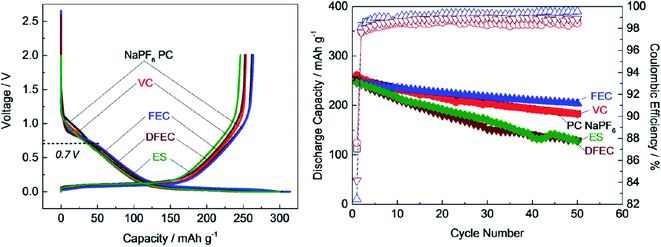 | ||
| Fig. 3 Cycle performance of hard-carbon anode in 1 mol dm−3 NaPF6 in PC-based electrolyte containing 1 vol% of FEC, VC, ES and DFEC additives.23 Copyright 2016, John Wiley & Sons, Inc. | ||
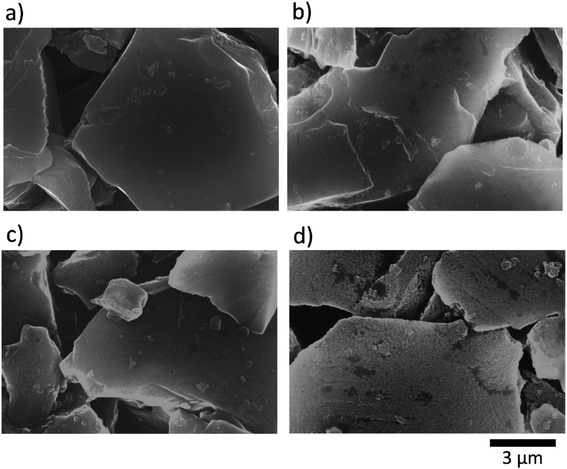 | ||
| Fig. 4 SEM images for hard-carbon electrodes; (a) pristine, and (b–d) after the first reduction–oxidation cycle test in PC-based electrolyte solutions (b) without and (c and d) with (c) 2 vol% and (d) 10 vol% FEC at a rate of 25 mA g−1 in the coin-type Na cells.70 Copyright 2014, Elsevier B. V. | ||
Furthermore, it was revealed that FEC additive reduces the irreversible capacity, as shown in Fig. 5.23 In NaPF6/PC-based electrolyte, the hard-carbon anode showed an irreversible capacity of 37.0 mA h g−1 with an initial coulombic efficiency (ICE) of 86.7% in the 1st charging/discharging cycle. By adding the FEC additive, the initial irreversible capacity was reduced to 33.6 mA h g−1, while the ICE increased to 88.1% (Fig. 5a). Accordingly, RM simulation results showed that electron consumption for SEI film formation decreased by adding FEC in the PC-based electrolyte (Fig. 5b).
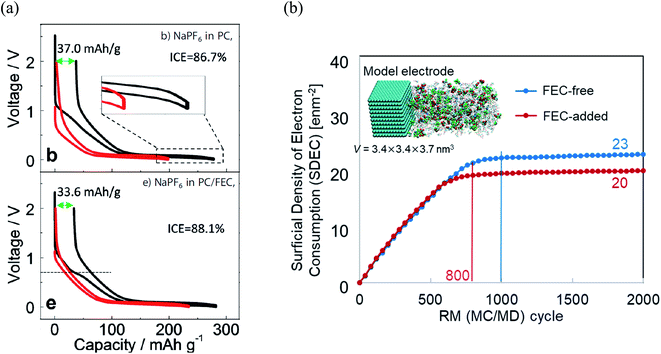 | ||
| Fig. 5 (a) Charge/discharge curves (1st cycle, black line; 30th cycle, red line) of carbon-based electrode cycled23 (Copyright 2016, John Wiley & Sons, Inc)., and (b) the electron consumption used for SEI film formation in NaPF6 PC/FEC based electrolyte on carbon-based electrode. | ||
To reveal the microscopic mechanism of FEC additive effect on the SEI film formation, we performed RM simulations in NaPF6/PC:FEC electrolyte solution. Fig. 6a shows the mass density distributions (ρm) of reaction products in the SEI films formed in NaPF6/PC-based electrolyte solution without and with FEC additive. Comparing these distributions, FEC additive suppresses the dissolution of SEI film products such as Na2DMBDC, Na2CO3 and NaPC. Thus, the thickness of SEI film was found to be reduced by approximately 32%, leading to the decrease of the total amount of consumed electrons in SEI film formation (Fig. 5b), and the surface structure of the SEI in contact with the electrolyte became smoother. Including the reaction pathway of FEC decomposition to NaF, CO2, and C2H3O (Fig. 1), the formation of NaF significantly increased as well as the aggregation of reaction products became more compact, resulting in a NaF-rich dense SEI film in the FEC-added electrolyte.
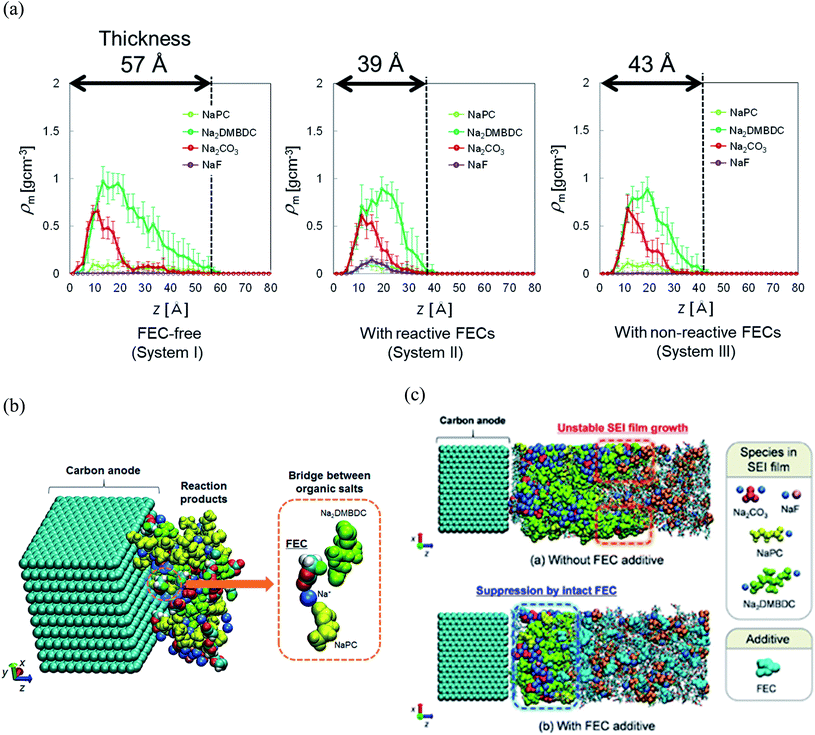 | ||
| Fig. 6 (a) Mass density distributions (ρm) of the reaction products for PC-based NaPF6 electrolyte with free, reactive and non-reactive FEC additive, (b) the typical snapshot of the reaction products at the intermediate state in the SEI film formation (500 RM cycle) in FEC-added electrolyte solution, and (c) the typical snapshot of SEI layers obtained in PC-based electrolyte solutions (top) without and (bottom) with FEC additive.60 Copyright 2015, American Chemical Society. | ||
On the other hand, we also examined the indirect role of intact FEC molecules. In particular, we also executed the “artificial” RM simulations by assuming non-reactive FEC additive. The depth-directional distribution of components in the SEI layer was found almost similar in reactive and non-reactive FEC cases, except for the NaF complexes due to the reduction of FEC (Fig. 6a). At the microscopic level, it was observed that FEC molecules can form bridges connecting among SEI film products because of the two negative parts (–F and –CO3 groups) in FEC (Fig. 6b). Such bridge formation could be essential to suppress the dissolution of SEI products leading to the formation of compact SEI film. As results, the FEC addition must lead to a compact and dense SEI film regardless of whether or not FEC reduction reactions take place. Therefore, at the microscopic level, one of the essential effects of FEC additive is the suppression of the unstable SEI film growth and the dissolution of SEI film products (Fig. 6c).
5. FEC additive concentration optimization for advanced NIB electrolytes
Selecting the appropriate additive is essential to enhance the cycling performance of NIBs. However, performance maximization is strongly related to optimizing the additive concentration and binder selection.71 For that, the concentration dependency of FEC, as the most appropriate additive, was examined experimentally in NaPF6/PC-based electrolyte to improve the carbon electrode with the binder PVDF (PolyVinylidene DiFluoride) in Na half-cell. The optimal performance was critically sensitive with a small amount of FEC.23 Then, superior capacity retention was achieved using 0.5 vol% of FEC concentration (Fig. 7a). In addition, during the initial charging process (sodium insertion into hard-carbon), the potential flat located at about 0.8 V appeared by adding the FEC additive. This potential flat, known as the reduction plateau, tends to be pronounced by increasing FEC concentration, as shown in Fig. 7b. Such results confirmed that electrolyte decomposition is influenced by FEC additive and its concentration. The increase of reduction plateau indicated the suppression of the reduction process in FEC-added electrolytes. A possible explanation was that FEC is adhered to the surface and adsorbed at the electrolyte/electrode interface before its being reduced; FEC molecules are instantly electrochemically reduced at the electrode surface when the potential is driven to low values.23 Such explanation could be confirmed by the RM simulation results discussed before, showing that the intact FEC itself has a role in enhancing the SEI film formation.59,60 However, an open question was why such positive effect of FEC was optimum at a lower concentration, while the negative effect was appeared by increasing FEC amount showing a deterioration of NIBs performance at higher concentration.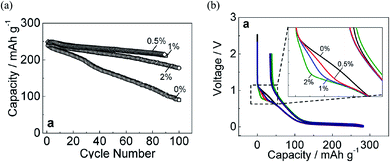 | ||
| Fig. 7 (a) Capacity retention and (b) initial charge/discharge of hard-carbon electrodes cycled in 1 mol dm−3 NaPF6 PC-based electrolyte containing 0, 0.5, 1, and 2 vol% of FEC concentration.23 Copyright 2016, John Wiley & Sons, Inc. | ||
To shed light on such mysterious effect of FEC additive, the microscopic origin of the concentration effect of FEC additive on the SEI film formation in NaPF6/PC-based electrolyte was investigated using RM simulation.60 Regardless of the FEC additive concentration, the dissolution amounts of SEI film products were numerically found lower in the FEC-added electrolytes, even when the concentration is quite small, in comparison to those in the FEC-free one. Additionally, Fig. 8a shows that the dissolution amount of NaPC product was the largest among the other ones, meaning that is more soluble in the electrolyte solution than the other ones. This feature was also experimentally confirmed in NIBs, where the NaPC complex is plainly detected in the separator as one of the main components of the dissolved reaction products.26 On the other hand, due to the dependency of the SEI film structures on the FEC concentration, the formation of dimer products (Na2DMBDC) was clearly increased at the lower concentration of FEC, and decreased by increasing FEC concentration. Conversely, the formation of NaF and Na2CO3 inorganic products increased at the higher FEC concentration (Fig. 8b), enhancing the FEC and two-electron PC reductions. Hence, the formation of the gas molecules such as C3H6 and CO2 increased at the higher FEC concentration.
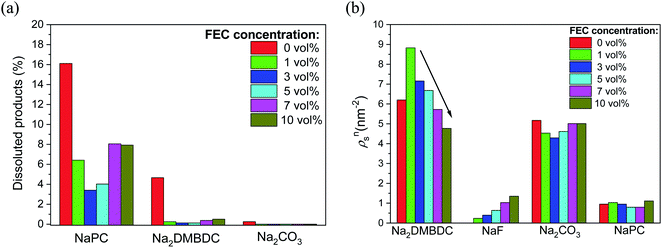 | ||
| Fig. 8 FEC concentration dependence (a) on the numbers of dissoluted SEI products, and (b) on the surface number densities (ρsn) of the SEI film products. | ||
On the other hand, the cavity inside the SEI film was estimated numerically by calculating the fractional accessible volume (FAV),72 the cavity volume ratio to the total one. Table 1 shows that FAV decreases in the low FEC concentration range from 0 to 3 vol%, leading to the denser structures of SEI films. In contrast, as the FEC concentration increases from 3 vol%, the cavity size increases, as reported in Table 1. The cavity size increased inside SEI film when dimer products (Na2DMBDC) decreased (Fig. 8b). In fact, the constitutional residues such as polar –CO3 groups of the organic salts enclosed the Na2CO3 and NaF complexes, while the remaining nonpolar –C3H6 groups mainly formed the cavities inside the SEI films.60 Thus, the increase in the organic products made the cavity size decrease, leading to the formation of denser SEI film at low FEC concentration. In addition, the formation of inorganic products as NaF and Na2CO3 decreased at the lower FEC concentration (Fig. 8b), reducing the production of the gas molecules such as C3H6 and CO2. Thus, the less presence of the gas molecules results in the formation of denser SEI film at the lower FEC concentration with small cavity sizes. In contrast, by increasing the FEC concentration, the cavity sizes increased to make the interaction energy decrease among SEI film compounds leading to the smaller stability of porous SEI film. Consequently, its durability should reduce under any mechanical impact, e.g., the collision of Na+ cations and electrolyte solvent molecules.
| FEC concentration (vol%) | ||||||
|---|---|---|---|---|---|---|
| 0.0 | 1.0 | 3.0 | 5.0 | 7.0 | 10.0 | |
| Cavity (FAV) | 0.14 ± 0.02 | 0.09 ± 0.01 | 0.07 ± 0.01 | 0.12 ± 0.01 | 0.13 ± 0.01 | 0.18 ± 0.02 |
| ΔVorg | −7.16 ± 0.96 | −9.20 ± 0.38 | −8.60 ± 0.75 | −8.03 ± 0.71 | −7.44 ± 0.98 | −6.23 ± 0.94 |
For a deep mechanistic understanding of the SEI layers, the stability of SEI film was evaluated theoretically by calculating the microscopic potential energies ΔVorg of the organic products (NaPC and Na2DMBDC) forming the organic layers in the SEI film, which should control the stability of the whole SEI film. For this treatment, we need to remember that the potential energy is expressed as a sum of the intramolecular interaction Vintra (i.e., bond, bending, and torsion energies), and the nonbonding intermolecular interaction Vnonbond. Thus, ΔVorg is obtained as follows:
 | (4) |
This review presents the main results of the bulk modulus, shear modulus, and elastic modulus in Table 2. These results show the bulk and shear moduli, B and G, were highest at 1.0 vol% concentration, showing higher resistance to compression/tension and shear deformations at the low FEC concentration. By increasing FEC concentration, the shear and bulk moduli decreased. In addition, the elastic modulus (E) was highest at 1.0 vol% concentration, leading to an optimum of the hardness characteristic of the SEI layer at the low FEC concentration.
| FEC concentration (vol%) | |||||
|---|---|---|---|---|---|
| 0.0 | 1.0 | 3.0 | 5.0 | 10.0 | |
| B (GPa) | 9.09 ± 0.87 | 13.34 ± 0.73 | 12.07 ± 0.82 | 11.28 ± 0.78 | 9.98 ± 0.67 |
| G (GPa) | 3.76 ± 0.30 | 4.36 ± 0.28 | 4.13 ± 0.23 | 4.00 ± 0.27 | 3.60 ± 0.17 |
| E (GPa) | 9.91 ± 0.92 | 11.79 ± 0.86 | 11.12 ± 0.80 | 10.73 ± 0.79 | 9.64 ± 0.76 |
To reveal the negative impact of high FEC concentration, the microscopic mechanism of the strong dependency of the organic dimer production on the FEC additive concentration was closely investigated. RM simulation results clarified that the FEC molecules coordinate with positive residues of NaPCs in the early stage of SEI film formation. Since the intact FEC molecules increase naturally near the anode surface by increasing FEC concentration, their coordination with NaPCs was enhanced at the higher concentration of FEC, as shown in Fig. 9. At the same time, FEC molecules formed a bridge between two different NaPCs (Fig. 6b). By increasing FEC concentration, the increase in the number of bridges prevented the direct contact between NaPCs so as to decrease the reaction frequency of the dimer formation. In addition, it was found that the increase in the FEC amount decreases the diffusion of NaPCs due to the higher viscosity of the FEC-added PC solvent than the FEC-free one. It was, therefore, concluded that these two effects at the higher FEC concentration lead to the decrease in the organic dimer formation and unstable SEI film by reducing the collision frequency between NaPCs. However, the SEI film should become unstable by another negative factor due to the insufficient organic dimer formation. Finally, it was computationally and microscopically shown that the appropriate adjustment of the FEC additive amount is essential to improve the high-performance NIB with the FEC additive.
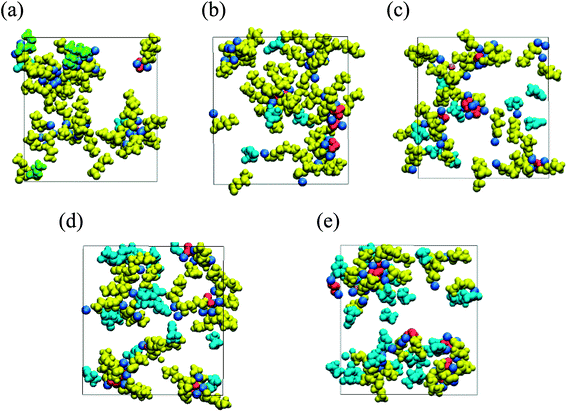 | ||
| Fig. 9 Typical snapshot of SEI film at initial stage of formation (red, Na2CO3; green, Na2DMBDC; dark yellow, NaPC; pink, NaF; cyan blue, FEC) in NaPF6/PC electrolyte solution containing (a) 1, (b) 3, (c) 5, (d) 7 and (e) 10 vol% of FEC additive concentration.60 Copyright 2018, American Chemical Society. | ||
6. Computational chemical clues of understanding the microscopic mechanism of SEI film formation in LIB's organic electrolytes
Propylene carbonate (PC) is one of the most appropriate organic solvents in NIBs with the hard-carbon electrode.5 However, PC-based electrolyte itself showed less efficiency to form a stable SEI film in LIBs with the graphite anode contrary to ethylene carbonate (EC)-based electrolyte, despite the close structural similarity between EC and PC solvents.18,74 Such contradictory behavior, especially between EC and PC solvents, opened mysterious questions since both EC and PC commonly undergo reductive ring-opening reactions to form similar dimerized products.18,74 Some studies have discussed linking the cause of this behavior difference to the gas evolution upon decomposition of solvents and the cointercalation of the PC molecules with larger molecular sizes.8,18,74,75 However, the question of why PC-derived products are unable to form a good SEI layer remains.Under the circumstances, the microscopic differences in the SEI film formation between the EC- and PC-based electrolytes on the graphite anode were investigated using the RM method.62 The SEI film formation processes have been demonstrated in both the EC- and PC-based electrolyte solutions on graphite anode for LIBs. Fig. 10a and c show the typical snapshots (side views) of reaction products at five RM cycles, i.e., 200, 400, 800, 1600, and 2000 RM cycles, in EC-based and PC-based electrolytes, respectively. In the PC-based electrolyte (Fig. 10c and d), the aggregation of the reduction products was clearly weaker than in the EC system (Fig. 10a and b), leading to the higher dissolution of SEI film products in the PC-based electrolyte. Furthermore, the accumulation of gaseous propane was conspicuous near the electrodes in the PC-based electrolyte (Fig. 10c). Such a high presence of gas could generate the graphite exfoliation observed experimentally in a PC-based solvent.8,75 Fig. 10b and d each show a front view of 10 snapshots of the typical interface structures of the SEI films near the surface of the negative electrode in the EC-based and the PC-based electrolytes. Comparing the EC-derived and the PC-derived SEI films, it was found that the pore sizes of the PC-based interface structure were more extensive than those of the EC-based one. In other words, PC-based SEI films are porous than EC-based ones. This is because of the methyl group of PC solvent molecules, which prevents a stable aggregation of the reaction products during SEI film formation. More recently, we have theoretically observed that, on a similar structural basis, the cis-versus trans-configuration difference of butylene carbonate (BC) molecule brings about a similar stabilization difference during the microscopic SEI formation processes in LIBs.65
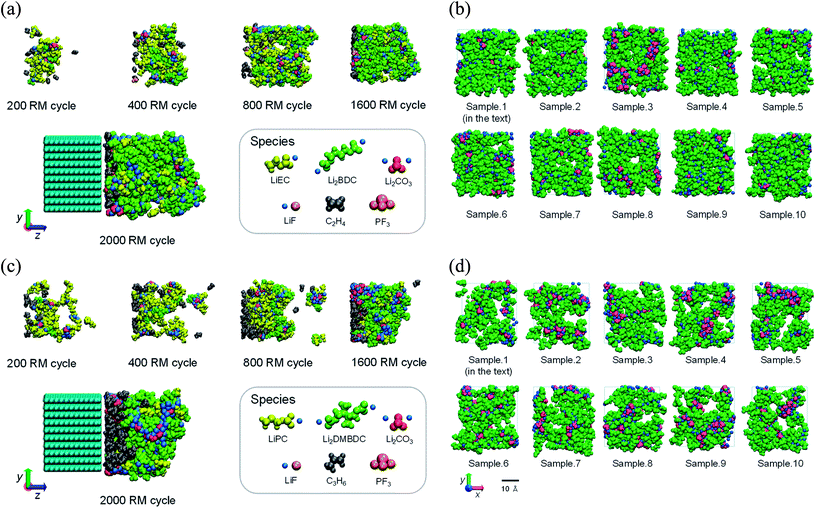 | ||
| Fig. 10 The SEI film formation processes in the (a) EC-based and (c) PC-based electrolytes. 5 typical snapshots of the changes of the aggregation states of reaction products during the RM simulation (bulk electrolyte not shown); and front view snapshots of the interface structures of (b) the EC-based and (d) the PC-based SEI films (visualized in the depth 0 ≦ z ≦ 20 Å of the view from the side of bulk electrolyte). These structures are obtained from the different 10 initial configurations.62 Copyright 2014, American Chemical Society. | ||
In this way, the RM method has fruitfully bridged the gap between the computational investigations and experimental ones from the viewpoint of SEI film formation. It can clarify the mystery of the conventional LIBs performance affected by the slight difference between EC and PC or BC, which is the presence or absence of a methyl group62 or even just the difference between the cis- and trans-isomeric configurations of a unique molecule.
7. Summary and future perspective
Research interest for NIBs has rapidly increased due to the abundance of sodium resources compared with lithium. Sodium-ion-based batteries showed a great potential to succeed both high-power and cost-effective for next-generation batteries. Nevertheless, continuous innovations of materials are still needed. This review summarizes recent investigations related to the development of advanced electrolytes in NIBs. Then, we reported both the experimental and the theoretical studies, showing the analysis is significantly advanced by the RM simulation analysis of mysterious experimental observation through modeling the aggregation process of electrolyte reduction products. Recent investigations were reviewed on the NaPF6 PC/FEC-based electrolyte as one of the best electrolytes to effectively passivate the hard-carbon electrode for higher cycling performance of NIBs. The addition of FEC reduces the initial irreversible capacity and enhances the SEI film formation leading to higher cycling performance.Furthermore, the RM simulation reveals that in addition to the familiar role of FEC decomposition to form a NaF-rich SEI film, the intact FECs themselves play a role in suppressing the dissolution of SEI film products. On the other hand, it was revealed that the optimization of FEC additive concentration maximizes the NIB's performance. The optimal performance was critically sensitive with a small amount of FEC additive. Experimentally, 0.5 vol% of FEC concentration was optimal for higher capacity and better cyclability. On the other hand, it was computationally demonstrated that the structural stability was higher at the small amount of FEC. At the same time, it decreased with the increase in the FEC amount, leading to a decrease in the NIB lifetime during charge–discharge cycles. It was also found that the role of FEC changes from positive to negative effect as the FEC concentration increases. The increase in FEC amount suppressed the organic dimer formation by reducing the collision frequency between the monomer products during the SEI film formation processes. According to RM simulation results, it was verified that the SEI film should become unstable due to the insufficient organic dimer formation.
Finally, this review introduced the recently developed RM methodology. This computational battery technology has been shown to be highly efficient in bridging the gap between the conventional theoretical results and experimental ones. Such various effects as the porosity, dissolution, and aggregation of SEI film products, which strongly influence the SEI film stability, were able to be considered in the RM simulation. Through many applications in NIBs and LIBs, this method succeeded in microscopically modeling the SEI film formation in different electrolyte systems, such as dilute or highly salt concentrated electrolytes, with recognized reliability.76 Moreover, the applicability of the RM method could be extended to new battery systems as K-ion and Mg-ion batteries, with the use of the appropriate MM force field describing correctly the Lewis acidity of each alkali cation. Currently, we are studying the elasticity of the SEI film carefully through the microscopic structural analysis to investigate the composition effect of the SEI film on its mechanical properties. Further, the voltage effect should also be considered, especially in modeling the SEI film formation process. Its function was implemented as a controlling variable77 into the original RM algorithm to improve the predictability to design a high-performance electrolyte for next-generation NIBs.
Conflicts of interest
The authors declare that there are no conflicts of interest regarding the publication of this article.Author contributions
AB, NT, and MN contributed mainly to the theoretical part of this work and KK, and SK did to the experimental one.Acknowledgements
AB acknowledges the support from the Japan Society for the Promotion of Science (JSPS) as a JSPS Postdoctoral Fellowship for Research in Japan. This work was also supported by a Grant-in-Aid for Science Research from the Ministry of Education, Culture, Sport, Science and Technology (MEXT) in Japan, and also by the MEXT programs “Elements Strategy Initiative for Catalysts and Batteries (ESICB),” Grant Number JPMXP0112101003 and “Program for Promoting Researches on the Supercomputer Fugaku” (Fugaku battery & Fuel Cell Project).References
- H. Zhang, X. Liu, H. Li, I. Hasa and S. Passerini, Angew. Chem., Int. Ed., 2021, 60, 598–616 CrossRef CAS PubMed.
- Y. Zhao, O. Pohl, A. I. Bhatt, G. E. Collis, P. J. Mahon, T. Rüther and A. Hollenkamp, Sustainable Chem., 2021, 2, 167–205 CrossRef.
- N. Yabuuchi, K. Kubota, M. Dahbi and S. Komaba, Chem. Rev., 2014, 114, 11636–11682 CrossRef CAS PubMed.
- X. Ma, K. An, J. Bai and H. Chen, Sci. Rep., 2017, 7, 1–9 CrossRef PubMed.
- S. Komaba, W. Murata and T. Ishikawa, Adv. Funct. Mater., 2011, 21, 3859–3867 CrossRef CAS.
- K. Mizushima, P. C. Jones, P. J. Wiseman and J. B. Goodenough, Mater. Res. Bull., 1980, 15, 783–789 CrossRef CAS.
- C. Delmas, J.-J. Braconnier, C. Fouassier and P. Hagenmuller, Solid State Ionics, 1981, 3, 165–169 CrossRef.
- R. Fong, U. Von Sacken and J. R. Dahn, J. Electrochem. Soc., 1990, 137, 2009 CrossRef CAS.
- K. Sawai, T. Ohzuku and T. Hirai, Chem. Express, 1990, 5, 837 CAS.
- T. Ohzuku, Y. Iwakoshi and K. Sawai, J. Electrochem. Soc., 1993, 140, 2490 CrossRef CAS.
- P. Ge and M. Fouletier, Solid State Ionics, 1988, 28, 1172–1175 CrossRef.
- M. M. Doeff, Y. P. Ma, S. J. Visco and L. C. Dejonghe, J. Electrochem. Soc., 1993, 140, L169 CrossRef CAS.
- Y. Liu, B. V. Merinov and W. A. Goddard, Proc. Natl. Acad. Sci. U.S.A., 2016, 113, 3735–3739 CrossRef CAS PubMed.
- K. Chayambuka, G. Mulder, D. L. Danilov and P. H. Notten, Adv. Energy Mater., 2018, 8, 1800079 CrossRef.
- C. Bommier and X. Ji, Small, 2018, 14, 1703576 CrossRef PubMed.
- P. Arora, R. E. White and M. Doyle, J. Electrochem. Soc., 1998, 145, 3647 CrossRef CAS.
- F. Röder, R. D. Braatz and U. Krewer, J. Electrochem. Soc., 2017, 164, E3335 CrossRef.
- K. Xu, Chem. Rev., 2004, 104, 4303–4418 CrossRef CAS PubMed.
- K. Xu, Chem. Rev., 2014, 114, 11503–11618 CrossRef CAS PubMed.
- S. J. An, J. Li, C. Daniel, D. Mohanty, S. Nagpure and D. L. Wood III, Carbon, 2016, 105, 52–76 CrossRef CAS.
- E. Peled and S. Menkin, J. Electrochem. Soc., 2017, 164, A1703 CrossRef CAS.
- A. Wang, S. Kadam, H. Li, S. Shi and Y. Qi, npj Comput. Mater., 2018, 4, 1–26 CrossRef CAS.
- M. Dahbi, T. Nakano, N. Yabuuchi, S. Fujimura, K. Chihara, K. Kubota, J. Y. Son, Y. T. Cui, H. Oji and S. Komaba, ChemElectroChem, 2016, 3, 1856–1867 CrossRef CAS.
- M. Moshkovich, Y. Gofer and D. Aurbach, J. Electrochem. Soc., 2001, 148, E155 CrossRef CAS.
- D. I. Iermakova, R. Dugas, M. R. Palacín and A. Ponrouch, J. Electrochem. Soc., 2015, 162, A7060 CrossRef CAS.
- S. Komaba, T. Ishikawa, N. Yabuuchi, W. Murata, A. Ito and Y. Ohsawa, ACS Appl. Mater. Interfaces, 2011, 3, 4165–4168 CrossRef CAS PubMed.
- J. Chen, Z. Huang, C. Wang, S. Porter, B. Wang, W. Lie and H. K. Liu, Chem. Commun., 2015, 51, 9809–9812 RSC.
- G. Yan, K. Reeves, D. Foix, Z. Li, C. Cometto, S. Mariyappan, M. Salanne and J. M. Tarascon, Adv. Energy Mater., 2019, 9, 1901431 CrossRef CAS.
- H. Che, X. Yang, H. Wang, X. Z. Liao, S. S. Zhang, C. Wang and Z. F. Ma, J. Power Sources, 2018, 407, 173–179 CrossRef CAS.
- H. Yang, J. Hwang, Y. Tonouchi, K. Matsumoto and R. Hagiwara, J. Mater. Chem. A, 2021, 9, 3637–3647 RSC.
- X. Q. Zhang, X. B. Cheng, X. Chen, C. Yan and Q. Zhang, Adv. Funct. Mater., 2017, 27, 1605989 CrossRef.
- Y. Horowitz, H. L. Han, F. A. Soto, W. T. Ralston, P. B. Balbuena and G. A. Somorjai, Nano Lett., 2018, 18, 1145–1151 CrossRef CAS PubMed.
- Y. Horowitz, H. G. Steinrück, H. L. Han, C. Cao, I. I. Abate, T. M. F. Tsao and G. A. Somorjai, Nano Lett., 2018, 18, 2105–2111 CrossRef CAS PubMed.
- X. Zhao, Q. C. Zhuang, S. D. Xu, Y. X. Xu, Y. L. Shi and X. X. Zhang, Int. J. Electrochem. Sci., 2015, 10, 2515–2534 CAS.
- A. Wang, S. Kadam, H. Li, S. Shi and Y. Qi, npj Comput. Mater., 2018, 4, 1–26 CrossRef CAS.
- T. Li and P. B. Balbuena, Chem. Phys. Lett., 2000, 317, 421–429 CrossRef CAS.
- Y. Wang, S. Nakamura, M. Ue and P. B. Balbuena, J. Am. Chem. Soc., 2001, 123, 11708–11718 CrossRef CAS PubMed.
- Y. Wang, S. Nakamura, K. Tasaki and P. B. Balbuena, J. Am. Chem. Soc., 2002, 124, 4408–4421 CrossRef CAS PubMed.
- Y. Wang and P. B. Balbuena, J. Phys. Chem. B, 2002, 106, 4486–4495 CrossRef CAS.
- J. M. Vollmer, L. A. Curtiss, D. R. Vissers and K. Amine, J. Electrochem. Soc., 2003, 151, A178 CrossRef.
- Q. Liu, A. Cresce, M. Schroeder, K. Xu, D. Mu, B. Wu, L. Shi and F. Wu, Energy Storage Mater., 2019, 17, 366–373 CrossRef.
- K. Leung and J. L. Budzien, Phys. Chem. Chem. Phys., 2010, 12, 6583–6586 RSC.
- K. Leung, Y. Qi, K. R. Zavadil, Y. S. Jung, A. C. Dillon, A. S. Cavanagh, S. H. Lee and S. M. George, J. Am. Chem. Soc., 2011, 133, 14741–14754 CrossRef CAS PubMed.
- K. Miyazaki, N. Takenaka, E. Watanabe, Y. Yamada, Y. Tateyama and A. Yamada, ACS Appl. Mater. Interfaces, 2020, 12, 42734–42738 CrossRef CAS PubMed.
- P. Ganesh, P. R. C. Kent and D. E. Jiang, J. Phys. Chem. C, 2012, 116, 24476–24481 CrossRef CAS.
- K. Ushirogata, K. Sodeyama, Y. Okuno and Y. Tateyama, J. Am. Chem. Soc., 2013, 135, 11967–11974 CrossRef CAS PubMed.
- K. Leung, S. B. Rempe, M. E. Foster, Y. Ma, J. M. M. del la Hoz, N. Sai and P. B. Balbuena, J. Electrochem. Soc., 2013, 161, A213 CrossRef.
- Y. Okuno, K. Ushirogata, K. Sodeyama and Y. Tateyama, Phys. Chem. Chem. Phys., 2016, 18, 8643–8653 RSC.
- Y. Li, K. Leung and Y. Qi, Acc. Chem. Res., 2016, 49, 2363–2370 CrossRef CAS PubMed.
- Y. Li and Y. Qi, Energy Environ. Sci., 2019, 12, 1286–1295 RSC.
- A. Bouibes, S. Saha and M. Nagaoka, Sci. Rep., 2020, 10, 1–10 CrossRef PubMed.
- P. Wróbel, P. Kubisiak and A. Eilmes, J. Phys. Chem. B, 2021, 125, 1248–1258 CrossRef PubMed.
- D. Bedrov, G. D. Smith and A. C. Van Duin, J. Phys. Chem. A, 2012, 116, 2978–2985 CrossRef CAS PubMed.
- M. M. Islam and A. C. Van Duin, J. Phys. Chem. C, 2016, 120, 27128–27134 CrossRef CAS.
- Y. Shi, H. J. Yan, R. Wen and L. J. Wan, ACS Appl. Mater. Interfaces, 2017, 9, 22063–22067 CrossRef CAS PubMed.
- M. Nagaoka, Y. Suzuki, T. Okamoto and N. Takenaka, Chem. Phys. Lett., 2013, 583, 80–86 CrossRef CAS.
- Y. Suzuki, Y. Koyano and M. Nagaoka, J. Phys. Chem. B, 2015, 119, 6776–6785 CrossRef CAS PubMed.
- Y. Suzuki and M. Nagaoka, J. Chem. Phys., 2017, 146, 204102 CrossRef PubMed.
- N. Takenaka, H. Sakai, Y. Suzuki, P. Uppula and M. Nagaoka, J. Phys. Chem. C, 2015, 119, 18046–18055 CrossRef CAS.
- A. Bouibes, N. Takenaka, T. Fujie, K. Kubota, S. Komaba and M. Nagaoka, ACS Appl. Mater. Interfaces, 2018, 10, 28525–28532 CrossRef CAS PubMed.
- N. Takenaka, T. Fujie, A. Bouibes, Y. Yamada, A. Yamada and M. Nagaoka, J. Phys. Chem. C, 2018, 122, 2564–2571 CrossRef CAS.
- N. Takenaka, Y. Suzuki, H. Sakai and M. Nagaoka, J. Phys. Chem. C, 2014, 118, 10874–10882 CrossRef CAS.
- A. Bouibes, N. Takenaka, S. Saha and M. Nagaoka, J. Phys. Chem. Lett., 2019, 10, 5949–5955 CrossRef CAS PubMed.
- T. Fujie, N. Takenaka, Y. Suzuki and M. Nagaoka, J. Chem. Phys., 2018, 149, 044113 CrossRef PubMed.
- N. Takenaka and M. Nagaoka, Chem. Rec., 2019, 19, 799–810 CrossRef CAS PubMed.
- K. Matsumoto, M. Takayanagi, Y. Suzuki, N. Koga and M. Nagaoka, J. Comput. Chem., 2019, 40, 421–429 CrossRef CAS PubMed.
- N. Misawa, Y. Suzuki, K. Matsumoto, S. Saha, N. Koga and M. Nagaoka, J. Phys. Chem. B, 2021, 125, 1453–1467 CrossRef CAS PubMed.
- U. Purushotham, N. Takenaka and M. Nagaoka, RSC Adv., 2016, 6, 65232–65242 RSC.
- K. Ushirogata, K. Sodeyama, Z. Futera, Y. Tateyama and Y. Okuno, J. Electrochem. Soc., 2015, 162, A2670 CrossRef CAS.
- F. A. Soto, P. Yan, M. H. Engelhard, A. Marzouk, C. Wang, G. Xu, Z. Chen, K. Amine, J. Liu, V. L. Sprenkle, F. El-Mellouhi, P. B. Balbuena and X. Li, Adv. Mater., 2017, 29, 1606860 CrossRef PubMed.
- M. Dahbi, T. Nakano and N. Yabuuchi, Electrochem. Commun., 2014, 44, 66–69 CrossRef CAS.
- D. Hofmann, M. Entrialgo-Castano, A. Lerbret, M. Heuchel and Y. Yampolskii, Macromolecules, 2003, 36, 8528–8538 CrossRef CAS.
- J. Wang, R. M. Wolf, J. W. Caldwell, P. A. Kollman and D. A. Case, J. Comput. Chem., 2004, 25, 1157–1174 CrossRef CAS PubMed.
- P. B. Balbuena and Y. X. Wang, Lithium-ion batteries: solid-electrolyte interphase, World Scientific, 2004 Search PubMed.
- Z. X. Shu, R. S. McMillan and J. J. Murray, J. Electrochem. Soc., 1993, 140, 922 CrossRef CAS.
- N. Takenaka, A. Bouibes, Y. Yamada, M. Nagaoka and A. Yamada, Adv. Mater., 2021, 2100574 CrossRef CAS PubMed.
- T. Inagaki and M. Nagaoka, J. Comput. Chem., 2019, 40, 2131–2145 CrossRef CAS PubMed.
| This journal is © The Royal Society of Chemistry 2022 |

