 Open Access Article
Creative Commons Attribution 3.0 Unported Licence
SERS microsensors for pH measurements in the lumen and ECM of stem cell derived human airway organoids†
William H.
Skinner
 a,
Nicola
Robinson
b,
Gareth R.
Hardisty
b,
Holly
Fleming
 c,
Ailsa
Geddis
bd,
Mark
Bradley
 d,
Robert D.
Gray
b and
Colin J.
Campbell
 *d
*d
aSchool of Physics and Astronomy, University of Exeter, Exeter EX4 4QL, UK
bCentre for Inflammation Research, The Queen's Medical Research Institute, The University of Edinburgh, 47 Little France Crescent, Edinburgh EH16 4TJ, UK
cSchool of Science and Engineering, University of Dundee, Dundee DD1 4HN, Scotland, UK
dJoseph Black Building, The University of Edinburgh, David Brewster Rd, Edinburgh EH9 3FJ, UK. E-mail: colin.campbell@ed.ac.uk
First published on 14th February 2023
Abstract
Patient derived organoids have the potential to improve the physiological relevance of in vitro disease models. However, the 3D architecture of these self-assembled cellular structures makes probing their biochemistry more complex than in traditional 2D culture. We explore the application of surface enhanced Raman scattering microsensors (SERS-MS) to probe local pH gradients within patient derived airway organoid cultures. SERS-MS consist of solid polymer cores decorated with surface immobilised gold nanoparticles which are functionalised with pH sensitive reporter molecule 4-mercaptobenzoic acid (MBA). We demonstrate that by mixing SERS-MS into the extracellular matrix (ECM) of airway organoid cultures the probes can be engulfed by expanding organoids and report on local pH in the organoid lumen and ECM.
Cellular pH measurements have been shown to report on a variety of biological phenomena including metabolic activity and immune response.1,2 Nanoparticle-based SERS pH sensing has been used to great effect in 2D cell cultures to probe pH regulation at the subcellular level.2–5 Increasingly, 3D cell cultures such as organoids are seen as better models of tissue function because they recapitulate architectural and functional aspects of in vivo tissues and organs.6,7
The SERS pH sensing toolkit developed for 2D cell cultures is not readily applicable to 3D cell culture models where cells are suspended in a volume of extracellular matrix (ECM) which restricts probe delivery and where tight cell junctions can restrict sensor penetration. Organoids also have new cellular microenvironments with their own probe delivery challenges. For example, the organoid lumen, an extracellular space enclosed by a layer of cells, is a microenvironment not found in 2D cultures. In airway cultures, the lumen mimics the airway epithelial surface. A specific challenge in measuring luminal pH is the delivery of sensors that do not subsequently enter the cells or leak out of the lumen. Microinjection has been reported as a method to deliver fluorescence pH probes into the organoid's lumen,8 however, the accuracy of fluorescence probes can be reduced by probe leaking and optical artefacts created by the 3D cellular environment.9,10 The ubiquitous importance of pH in disease makes developing pH probes suited to the requirements of organoid cell culture a necessity.
In this work, we present the fabrication of SERS microsensors (SERS-MS) and explore their potential to facilitate pH sensing in the lumen and surrounding ECM of patient-derived organoids. SERS-MS evade endosomal uptake pathways because of their size (they are approximately the same size as a cell). We selected airway organoids (AOs) as our in vitro system because of the on-going debate surrounding the role of airway surface liquid pH in the respiratory disease Cystic Fibrosis.11,12 SERS-MS were incorporated into the 3D cell cultures by mixing them with suspensions of basal epithelial cells in liquefied ECM, allowing the ECM to set into a gel and then inducing the basal cell to differentiate into AOs. As the organoids formed and expanded, they internalised SERS-MS located in the surrounding ECM. The result was a 3D cell culture with SERS-MS spread throughout the extracellular environment of AOs and some SERS-MS residing in the lumen of AOs. We collected spectra from the SERS-MS in the ECM of organoids to characterise how their secretion of metabolic acids influenced local pH. Where SERS-MS were located in the lumen of AOs, SERS spectra were collected and the lumen pH compared to the ECM pH to understand whether SERS-MS could be used to probe transepithelial pH gradients between the AO lumen and ECM. This method demonstrated a means of delivering probes to the organoid lumen by leveraging the solid phase of SERS-MS to allow organoids to expand and engulf sensors during 7–10 days of differentiation, this avoided the need for intrusive and technical probe microinjection.
We fabricated SERS-MS using commercially available amino TentaGel® microspheres (20 μm) and employed the well-documented physisorption of the amine functional group onto gold nanoparticles (AuNPs, 150 nm) to immobilise AuNPs on the microsphere surface via a simple one-step process.13,14 Amino TentaGel microspheres are copolymers consisting of crosslinked polystyrene matrix, upon which is grafted amine terminated polyethylene glycol. The interaction between the primary amines on the surface of the TentaGel beads and the AuNPs results in AuNP decorated microspheres which were visualised via scanning electron microscopy (SEM, Fig. 1A). We functionalised the gold surface, via thiol-gold bonding, with 4-mercaptobenzoic acid (MBA), a pH-sensitive reporter molecule previously applied to SERS pH sensing in the cellular environment.3,15,16
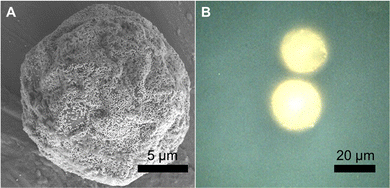 | ||
| Fig. 1 (A) Scanning electron microscope (SEM) image of dried SERS-MS. (B) Reflected brightfield microscope image of two SERS-MS in an aqueous solution. | ||
SEM images of SERS-MS showed a monolayer of gold nanoparticles formed on the microparticle surface and reflected bright field microscopy confirmed the presence of surface adsorbed AuNPs on SERS-MS in solution (Fig. 1 and Fig. S1, ESI†). The proximity of adjacent nanoparticles facilitated inter-particle plasmon coupling and created intense SERS activity restricted to individual microspheres (Fig. S1B, ESI†). The 20 μm diameter of these SERS-MS makes them unlikely to be endocytosed by non-phagocytic cells but small enough to reside inside organoids which can grow to hundreds of micrometres.7
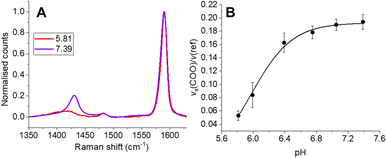
To ensure SERS-MS were accurately calibrated for the ECM environment of organoids, we encapsulated SERS-MS in a cell-free ECM, simulated AO culture conditions for 14 days, and then collected SERS-MS spectra in pH adjusted cell culture media (Fig. 2 and Fig. S2, ESI†). Previous studies have demonstrated MBA-based SERS pH sensing is influenced by the chemistry of the local ECM environment.15,17 By incubating SERS-MS in the ECM for 14 days we simulate the time the sensors spent in the ECM during AO maturation and ensured the accuracy of in situ SERS-MS pH measurements in the ECM and lumen of live AOs. MBA-based SERS pH sensing employs the intensity of the pH-sensitive vs(COO) peak at ∼1430 cm−1 relative to the aromatic ring deformation peak (v(ref)) at ∼1590 cm−1 to measure pH in the aqueous environment surrounding the sensor (Fig. 2 and Fig. S2A, ESI†).16,18 We fitted a Boltzmann curve to the pH dependence of the intensity ratio of vs(COO) and v(ref) to create a calibration curve for SERS-MS pH sensing in the ECM (Fig. 2B). Incubating SERS-MS in the ECM and calibrating the sensors in cell culture media changed the profile of the calibration curve compared to when SERS-MS were calibrated in suspension with phosphate buffer solutions (Fig. S3, ESI†). This effect has been reported for MBA SERS sensors encapsulated in a variety of hydrogels and for sensors calibrated in cell culture media.17,19 We did not observe spectral peaks associated with ECM protein absorption to the SERS-MS surface (Fig. S2A, ESI†) and concluded that the MBA self-assembled monolayer remained intact.
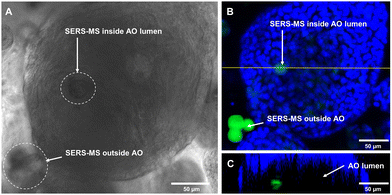
Following sensor calibration, we investigated whether SERS-MS would penetrate the lumen of primary AOs as the organoids expanded and if this would enable the first demonstration of microinjection-free probe delivery for lumen pH measurements. For organoid culture, basal epithelial cells (a stem-like cell that can form various cells of the airway) were harvested from the inferior turbinate (a structure in the nasal cavity) of healthy volunteers and expanded (described in the supplementary information). SERS-MS were added to tissue cultures on day 1 of the 3D cell culture period, this involved suspending basal epithelial cells and SERS-MS in liquefied ice-cooled ECM and pipetting the solution into a porous membrane tissue culture insert (Fig. S4, ESI†). This insert was then lowered into a reservoir of ‘AO seeding media’ (Table S1, ESI†). The ECM solution solidified as its temperature increased, with cells and SERS-MS suspended throughout its volume. Following 7 days of culture with ‘AO seeding media’ and 7–10 days of ‘AO differentiation media’ (Table S2, ESI†), clusters of basal epithelial cells underwent differentiation and expanded to form organoids (Fig. S5, ESI†). Using bright-field microscopy, we observed that some SERS-MS appeared to reside inside AOs (Fig. 3A and Fig. S6, ESI†). To further confirm SERS-MS could penetrate AOs and reside in the organoid lumen, we used confocal fluorescence microscopy to collect a z-stack of an AO and visualise the location of SERS-MS relative to the epithelial cell layer forming the periphery of the AO (the polystyrene core of the SERS-MS has intrinsic fluorescence and required no extra preparation steps to image).20
Fig. 3B shows a cluster of 3 SERS-MS in the ECM surrounding the AO and a fainter SERS-MS potentially inside the AO. Fig. 3C is an orthogonal view along the yellow line in Fig. 3B, and confirmed the SERS-MS was on the lumen side of the AO epithelial cells. In the orthogonal view, the AO has a crescent shape because imaging depth in 3D cellular structures is limited by light scattering from the different refractive indices of cellular components.21 However, imaging half of the AO was sufficient to confirm the SERS-MS was located on the lumen side of the epithelial layer. This demonstrated that culturing organoids in the presence of SERS-MS resulted in some sensors penetrating organoids and residing in the lumen. This created an opportunity to simultaneously measure pH inside the organoid lumen and in the surrounding ECM and explore whether the pH of the former was distinct from that of the latter.
First, to demonstrate the capacity of SERS-MS to measure organoid induced pH differences in the ECM, we collected spectra from SERS-MS in cell-free ECM and from SERS-MS in the ECM of two AO cultures to which fresh media had been added 1 and 2 days prior. SERS-MS were added to the ECM, with or without cells, two weeks prior to the sensing experiment to ensure consistency with the pH calibration curve in Fig. 2B. Fig. S7 (ESI†) shows the mean SERS-MS spectrum from each sample following normalisation to the intensity of the v(ref) peak. Fig. 4A zooms in on the pH sensitive vs(COO) peak and shows a successive decrease in normalised intensity between the ‘cell-free ECM’, ‘AOs day 1’ and ‘AOs day 2’. These results indicate SERS-MS are sensitive to the metabolic acidification of the ECM. By using the calibration curve in Fig. 2B, we calculated an average pH of 7.05 (Fig. S7, ESI†) in cell-free ECM, an average pH of 6.58 in the AO ECM 1 day after refreshing the cell culture media and an average pH of 6.39 two days after refreshing the cell culture media (Fig. 4B). We anticipate SERS-MS embedded in the ECM at different distances from organoids will provide information about pH gradients within organoid cultures. To explore this, we measured pH from SERS-MS proximate to the organoids and from SERS-MS more distal from the organoids in the bulk basolateral cell culture media (Fig. S8, ESI†). In the two AO cultures analysed, we found the ECM environment of AOs was acidified by 0.22 or 0.12 pH units relative to the bulk AO media. These results highlight that within the hydrogel of a 3D cell culture format separated from the bulk media by a microporous membrane, AOs secrete metabolic acids at a rate greater than the diffusion of those acids into the bulk media and therefore condition the microenvironment.
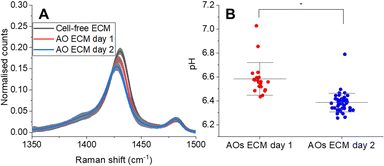 | ||
| Fig. 4 (A) Normalised mean SERS-MS spectra showing decrease in v(COO) as a result of metabolic acid build-up in the AO ECM (complete spectra presented in Fig. S7A, ESI†). The greyed-out area illustrates the standard deviation at each wavenumber. One AO culture was analysed at each time point. AO day 1 and day 2 were grown from the same donor. (B) pH values calculated from SERS-MS spectra collected from the ECM of two AO cultures grown from the same donor at day 1 and day 2 after refreshing the basolateral cell culture media. Each data point represents the pH calculated from a single SERS-MS spectrum. A two-sample t-test was used to compare pH values collected from the ECM of AOs on day 1 and day 2 (* = p < 0.05). | ||
The AO lumen models the surface of the respiratory tract. Understanding the transport of pH buffers to the airway-surface is key to understanding the pathophysiology of the respiratory disease Cystic Fibrosis.11,12 Having shown that some SERS-MS could penetrate AOs and were localized in the lumen, we collected spectra from SERS-MS inside the lumen and in the surrounding ECM of AOs grown from 3 different donors (Fig. 5). Bright-field microscopy was used to identify SERS-MS residing in the lumen of AOs and multiple SERS spectra were collected from different regions of an individual SERS-MS (Fig. S9A, ESI†). Spectra were then collected from SERS-MS located in the ECM surrounding the organoid (Fig. S9B, ESI†) to provide a baseline pH measurement to compare the lumen pH. The pH calculated from SERS-MS in each of these environments is presented in Fig. 5. In AO cultures 1 and 3, the mean pH value calculated from spectra collected from SERS-MS within the AO lumen was more acidic than those collected from the surrounding ECM. However, in culture 2 no statistically significant difference was resolved between the AO lumen pH and the ECM pH. Each AO culture was grown from a different donor and hence a degree of variation is expected. Certainly, the AOs in culture 1 acidified the ECM to a greater extent than the cells in cultures 2 and 3. This could be because they were more metabolically active or because of variation in the cell-seeding density. Furthermore, the difference between luminal and ECM pH could reflect the extent to which the epithelial cells form a tight barrier. These results highlight the potential of SERS-MS to measure lumen pH and detect pH gradients within organoid cell cultures. SERS-based lumen pH sensing could be improved by quantifying AO uptake; this would likely require AOs to be removed from the ECM to measure the faction of AOs containing fluorescent SERS-MS. Further work could also explore increasing SERS-MS uptake with surface functionalisation to target the AO lumen.
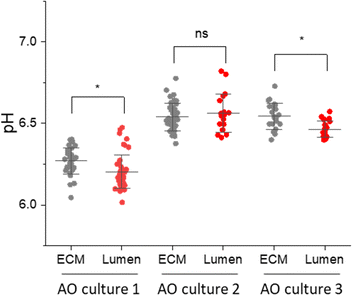 | ||
| Fig. 5 pH measurements from SERS-MS in the ECM surrounding AOs and inside the AO lumen. The media in all three cultures was refreshed 1 day prior to the experiment. Each culture was grown from a different donor. Each data point is the pH calculated from a single SERS spectrum, multiple SERS spectra were collected from individual SERS-MS (Table S3 and Fig. S9, ESI†). * = p <0.05 by a two-sample t-test comparing pH values collected from the ECM and lumen in a single sample. Error bars are centred on the mean pH value and extend to the standard deviation. | ||
In conclusion, we fabricated a microparticle-based SERS pH probe by immobilising gold nanoparticles onto polymer microspheres and demonstrated their potential to collect data on the chemical environment of a biological niche that is particularly difficult to sample. The microparticle nature of SERS-MS is unique among extracellular SERS substrates and allowed them to be suspended among and inside organoids in the ECM. This facilitated pH sensing in the ECM surrounding AOs and enabled us to show the ECM was acidified relative to the AO culture media by the build-up of metabolic acids. Using confocal fluorescence microscopy, we confirmed, organoids incorporated SERS-MS into the lumen as they expand into the surrounding ECM. By measuring pH from SERS-MS localised in the AO lumen and the AO ECM, we showed that, in some AO cultures, SERS-MS could resolve small transepithelial pH differences between the lumen and the ECM.
All authors contributed to the manuscript. W.H.S collected spectral data and conducted data analysis. N.R. and G.H. cultured organoids. H.F. developed the SERS-MS. A.G. collected Raman maps of SERS-MS. M.B., R.G., and C.J.C. aided conceptualisation and supervised the work.
This work was supported by the EPSRC CDT in Intelligent Sensing and Measurement (EP/L016753/1) and EPSRC CDT in Optical Medical Imaging (EP/L016559/1). The authors thank Dr FL Laidlaw for his help in acquiring SEM images.
Conflicts of interest
None.Notes and references
- I. A. Ges, B. L. Ivanov, A. A. Werdich and F. J. Baudenbacher, Biosens. Bioelectron., 2007, 22, 1303–1310 CrossRef CAS PubMed
.
- S. M. Law, S. J. Stanfield, G. R. Hardisty, I. Dransfield, C. J. Campbell and R. D. Gray, J. Cystic Fibrosis, 2020, 19, 203–210 CrossRef CAS PubMed
.
- K. Bando, Z. Zhang, D. Graham, K. Faulds, K. Fujita and S. Kawata, Analyst, 2020, 145, 5768–5775 RSC
.
- S.-S. Li, M. Zhang, J.-H. Wang, F. Yang, B. Kang, J.-J. Xu and H.-Y. Chen, Anal. Chem., 2019, 91, 8398–8405 CrossRef CAS PubMed
.
- L. E. Jamieson, A. Jaworska, J. Jiang, M. Baranska, D. J. Harrison and C. J. Campbell, Analyst, 2015, 140, 2330–2335 RSC
.
- N. Sachs, A. Papaspyropoulos, D. D. Zomer-van Ommen, I. Heo, L. Böttinger, D. Klay, F. Weeber, G. Huelsz-Prince, N. Iakobachvili, G. D. Amatngalim, J. de Ligt, A. van Hoeck, N. Proost, M. C. Viveen, A. Lyubimova, L. Teeven, S. Derakhshan, J. Korving, H. Begthel, J. F. Dekkers, K. Kumawat, E. Ramos, M. F. M. van Oosterhout, G. J. Offerhaus, D. J. Wiener, E. P. Olimpio, K. K. Dijkstra, E. F. Smit, M. van der Linden, S. Jaksani, M. van de Ven, J. Jonkers, A. C. Rios, E. E. Voest, C. H. M. van Moorsel, C. K. van der Ent, E. Cuppen, A. van Oudenaarden, F. E. Coenjaerts, L. Meyaard, L. J. Bont, P. J. Peters, S. J. Tans, J. S. van Zon, S. F. Boj, R. G. Vries, J. M. Beekman and H. Clevers, EMBO J., 2019, 38, e100300 CrossRef PubMed
.
- Z. Liu, J. D. Anderson, L. Deng, S. Mackay, J. Bailey, L. Kersh, S. M. Rowe and J. S. Guimbellot, Genes, 2020, 11, 603 CrossRef CAS PubMed
.
- K. W. McCracken, E. Aihara, B. Martin, C. M. Crawford, T. Broda, J. Treguier, X. Zhang, J. M. Shannon, M. H. Montrose and J. M. Wells, Nature, 2017, 541, 182–187 CrossRef CAS PubMed
.
- G. A. Kim, N. J. Ginga and S. Takayama, Cell. Mol. Gastroenterol. Hepatol., 2018, 6, 123–131.e1 CrossRef PubMed
.
- I. A. Williamson, J. W. Arnold, L. A. Samsa, L. Gaynor, M. DiSalvo, J. L. Cocchiaro, I. Carroll, M. A. Azcarate-Peril, J. F. Rawls, N. L. Allbritton and S. T. Magness, Cell. Mol. Gastroenterol. Hepatol., 2018, 6, 301–319 CrossRef PubMed
.
- V. S. Shah, D. K. Meyerholz, X. X. Tang, L. Reznikov, M. Abou Alaiwa, S. E. Ernst, P. H. Karp, C. L. Wohlford-Lenane, K. P. Heilmann, M. R. Leidinger, P. D. Allen, J. Zabner, P. B. McCray, L. S. Ostedgaard, D. A. Stoltz, C. O. Randak and M. J. Welsh, Science, 2016, 351, 503–507 CrossRef CAS PubMed
.
- A. Schultz, R. Puvvadi, S. M. Borisov, N. C. Shaw, I. Klimant, L. J. Berry, S. T. Montgomery, T. Nguyen, S. M. Kreda, A. Kicic, P. B. Noble, B. Button and S. M. Stick, Nat. Commun., 2017, 8, 1409 CrossRef PubMed
.
- J. A. Olmos-Asar, M. Ludueña and M. M. Mariscal, Phys. Chem. Chem. Phys., 2014, 16, 15979–15987 RSC
.
- A. Kumar, S. Mandal, P. R. Selvakannan, R. Pasricha, A. B. Mandale and M. Sastry, Langmuir, 2003, 19, 6277–6282 CrossRef CAS PubMed
.
- W. H. Skinner, M. Chung, S. Mitchell, A. Akidil, K. Fabre, R. Goodwin, A. A. Stokes, N. Radacsi and C. J. Campbell, Anal. Chem., 2021, 93, 13844–13851 CrossRef CAS PubMed
.
- C. E. Talley, L. Jusinski, C. W. Hollars, S. M. Lane and T. Huser, Anal. Chem., 2004, 76, 7064–7068 CrossRef CAS PubMed
.
- K. Dayle, P. Sureyya and M. Mike, J. Biomed. Opt., 2021, 26, 097001 Search PubMed
.
- S. W. Bishnoi, C. J. Rozell, C. S. Levin, M. K. Gheith, B. R. Johnson, D. H. Johnson and N. J. Halas, Nano Lett., 2006, 6, 1687–1692 CrossRef CAS PubMed
.
- F. Sun, P. Zhang, T. Bai, D. David Galvan, H.-C. Hung, N. Zhou, S. Jiang and Q. Yu, Biosens. Bioelectron., 2015, 73, 202–207 CrossRef CAS PubMed
.
- P. G. Alluri, M. M. Reddy, K. Bachhawat-Sikder, H. J. Olivos and T. Kodadek, J. Am. Chem. Soc., 2003, 125, 13995–14004 CrossRef CAS PubMed
.
- J. F. Dekkers, M. Alieva, L. M. Wellens, H. C. R. Ariese, P. R. Jamieson, A. M. Vonk, G. D. Amatngalim, H. Hu, K. C. Oost, H. J. G. Snippert, J. M. Beekman, E. J. Wehrens, J. E. Visvader, H. Clevers and A. C. Rios, Nat. Protoc., 2019, 14, 1756–1771 CrossRef CAS PubMed
.
Footnote |
| † Electronic supplementary information (ESI) available. See DOI: https://doi.org/10.1039/d2cc06582g |
| This journal is © The Royal Society of Chemistry 2023 |

