 Open Access Article
Controlling the droplet cell environment in scanning electrochemical cell microscopy (SECCM) via migration and electroosmotic flow†
Samuel F.
Wenzel
 a,
Heekwon
Lee
 a and
Hang
Ren
 *abc
*abc
aDepartment of Chemistry, The University of Texas at Austin, Austin, TX 78712, USA
bCenter for Electrochemistry, The University of Texas at Austin, Austin, TX 78712, USA
cTexas Materials Institute, The University of Texas at Austin, Austin, TX 78712, USA. E-mail: hren@utexas.edu
First published on 29th May 2024
Abstract
Scanning electrochemical cell microscopy (SECCM) is a powerful nanoscale electrochemical technique that advances our understanding of heterogeneity at the electrode–electrolyte interface. In SECCM, dual-channel nanopipettes can serve as the probe, and a voltage bias between the channels can control the local electrolyte environment inside the droplet cell via migration and electroosmotic flow (EOF) between the channels, enabling applications including controlled electrodeposition of bimetallic nanoparticles with variable compositions. Herein, we show quantitatively how the voltage bias between the channels modulates the local electrolyte environment via experiment and finite element modeling. Experimentally, redox molecules of different charges (e.g., ferrocene derivatives and Ruthenium(III) hexamine) were filled in separate channels, where their limiting currents at the substrate electrode were used to distinguish the contribution of migration and EOF. Furthermore, EOF was visualized by fluorescence imaging. Finite element models were developed to further validate the experimental results quantitively. We showed that migration is affected by the charge number of the redox molecule. Meanwhile, EOF is affected by the surface charge on the wall of the nanopipette and the location of the slipping plane inside the electrical double layer, which can be tuned by the solution pH and the ionic strength of the electrolyte, respectively. The experimentally validated model can guide the precise modulation of droplet cell environment in SECCM, potentially enabling new scanning modes in SECCM.
Introduction
Revealing the detailed structure–reactivity relationship at electrochemical interfaces is critical for advancing the knowledge required for rational design and engineering of the interfaces for electrochemical energy conversion and storage.1,2 Conventional bulk electrochemical measurements often only provide averaged information about the electrode surface: the heterogeneity of the interfacial structures and their impact on the reactivity is lost during the ensemble averaging.3,4 The ensemble averaging effect can be mitigated via electrochemical imaging.1,5 By dissecting the average ensemble measurement into many local electrochemical measurements, detailed information about the “hot spots” of high activity on a particular material can be revealed.2,6 Scanning electrochemical cell microscopy (SECCM) is a state-of-the-art electrochemical technique for electrochemical mapping that uses a nanopipette as the probe.7–9 The nanoscale droplet cell formed between the end of the pipette and the substrate electrode surface allows for examining electrochemical activity at local sites with high spatial resolution, especially when coupled with colocalized structure characterization.7,8,10 For example, SECCM has helped reveal the higher activity for the hydrogen evolution reaction (HER) on the edge sites on MoS2 and enhanced activity of CO2 reduction (CO2RR) at the grain boundaries of Au.11,12 Electrocatalytic activity at the single nanoparticle level has been measured as well.13,14 Additionally, this high-resolution electrochemical technique has been demonstrated for the electrochemical synthesis of nanostructures of different varieties, including polymers and metal nanoparticles.15,16Generally, SECCM uses a single or dual-channel pipette as the probe, which is filled with a single type of electrolyte to study the local electrochemistry to synthesize the nanostructure at the substrate.8,15 We recently demonstrated the modulation of solution composition in SECCM by using a dual-channel pipette filled with different electrolytes in each channel.16 Polarization of the quasi-reference/counter electrodes between the two channels allows alteration of the solution composition inside the nanodroplet,17 which was used to synthesize bimetallic nanoparticle alloys with controlled variation in composition.16 It is envisioned that the same principle of solution composition modulation in SECCM can be broadly applied to other systems, for example, to study the effect of the local electrolyte environment in electrocatalytic reactions. The mechanism of solution composition modulation is based on voltage-induced mass transport, including electrophoretic migration and electroosmotic flow (EOF).8 Knowledge of the extent of contribution of each migration vs. EOF is necessary in quantitatively predicting and designing the system for solution composition modulation in SECCM. However, the mechanism remains to be quantitatively understood.18
In this report, we use both experimental analysis and finite element simulations to quantitatively unveil the contribution of electrophoretic migration and EOF. Experimentally, we first use different outer-sphere redox-active species with different charges, including (ferrocenylmethyl)trimethylammonium (FcTMA+), hexamineruthenium(III) (Ru(NH3)63+), and ferrocenedimethanol (Fc(MeOH)2). The mass transport limiting current of these redox probe molecules in the voltammogram reports their total flux to the electrode surface,19,20 and the variation of charge on the redox molecules allows separation electromigration from EOF. For example, neutral redox molecules will report the effect of EOF alone with no contribution from electromigration.19 To support the transport mechanism, we modulate the EOF by changing the ionic strength and pH of the solution.19,21 The results are further visualized by fluorescence microscopy. Lastly, finite element simulation is used to quantitatively understand the experimental results, dissecting the contribution from different mass transport modes.
Results and discussion
A schematic of the SECCM experiment for solution composition modulation is shown in Scheme 1. The left channel is filled with 2 mM FcTMA+ and 2 mM KCl, while the right channel is filled with 2 mM Ru(NH3)63+ and 2 mM KCl. Each channel contains a Ag/AgCl electrode. The left channel is the designated common ground for all potentials. V1 represents the potential difference between the glassy carbon substrate and the ground Ag/AgCl electrode in the left channel. Vbias is the potential of right channel vs. the left one. A non-zero Vbias induced an electric field in the solution, with the largest occurring near the pipette opening and the droplet cell due to the higher local solution resistance. This electric field causes both migration and EOF, moving the redox molecules between the channels through the droplet cell.8 When a positive voltage, Vbias, is applied to the right channel, Ru(NH3)63+ is expected to move from its own channel to the left channel, increasing its flux at the substrate–droplet interface, which can be directly measured as the limiting current at the substrate electrode. Conversely, when a negative Vbias is applied, FcTMA+ is expected to move from the left channel to the right, increasing its limiting current at the substrate. When 0 V is applied, negligible EOF or migration between the channels is expected due to the diminished electric field in the solution induced by Vbias.19 Note that the position of the ground and the two Ag/AgCl electrodes dictates that the potential of the substrate working electrode (Vwe) would be shifted at different Vbias approximately according to eqn (1),22 and all the voltammograms in this paper will be reported using Vwe.| Vwe = V1 − 0.5Vbias | (1) |
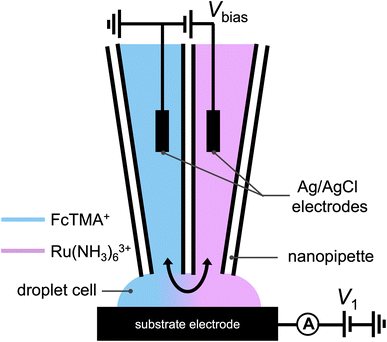 | ||
| Scheme 1 Schematic illustration of the experimental setup utilized in Fig. 1, where a dual channel nanopipette containing 2 mM (ferrocenylmethyl)trimethylammonium (FcTMA+) + 2 mM KCl in one channel, and 2 mM ruthenium hexamine(III) + 2 mM KCl in the other channel approaches a glassy carbon working electrode. A voltage, V1, is applied between the substrate and the Ag/AgCl electrode in the FcTMA barrel. A bias voltage, Vbias, is applied between the two channels to manipulate the composition of the droplet. | ||
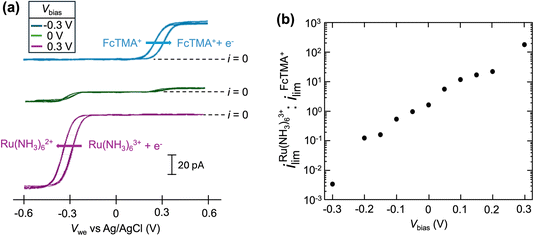
Fig. 1a shows the cyclic voltammograms of a dual-channel nanopipette at the surface of glassy carbon in SECCM. One channel is filled with 2 mM FcTMA+, while the other channel is filled with 2 mM Ru(NH3)63+ as illustrated in Scheme 1. When 0 V was applied between the two channels (green trace), essentially, no electric field was expected through the narrow channel of the nanopipette. Therefore, no EOF or migration is expected to transport molecules between the channels. Under this condition, the voltammogram shows two sigmoidal waves: one for the oxidation of FcTMA+ (E1/2 = 0.32 V), and the other for the reduction of Ru(NH3)63+ (E1/2 = −0.29 V). The sigmoidal shape of each voltammetric wave indicates that the voltammetric experiment reached a steady state, which is expected due to the small dimension of the pipette. The limiting current for Ru(NH3)63+ is 1.6× larger than that for FcTMA+, which is attributed to the higher migration towards the electrode surface due to the higher charge on Ru(NH3)63+. The presence of two voltammetric waves confirms that both Ru(NH3)63+ and FcTMA+ exist in the droplet at a significant level as expected. At Vbias = +0.3 V (purple trace), the FcTMA limiting current
  decreases by 94% and
  increases by 600% compared to Vbias = 0 V. The observed increase/decrease in the limiting currents suggests enrichment of Ru(NH3)63+ and depletion of FcTMA+ SECCM droplet, respectively, which was expected based on the direction of both migration and EOF. Because both redox mediators are positively charged, positive Vbias will induce migration of Ru(NH3)63+ out of the channel, and FcTMA+ back into its own channel. Under the same condition, EOF is also expected to induce a flow from the Ru(NH3)63+ barrel to the FcTMA+ barrel due to the negative fixed charges on the surface of the quartz pipette. Therefore, both migration and EOF result in the same trend of increasing the flux of Ru(NH3)63+ to the substrate while decreasing that for FcTMA+. The direction of the migration and EOF can be reversed when the polarity of Vbias is changed. For example, at Vbias = −0.3 V (blue trace),
  is decreased by 91% while the limiting current for FcTMA+ is increased by 583% compared to Vbias = 0 V, suggesting an enrichment of FcTMA+ and depletion of Ru(NH3)63+ in the droplet.
The effect of Vbias on the limiting current is quantified by the ratios of limiting currents as shown in Fig. 1b, which shows a consistent trend of an increasing/decreasing the ratio of  vs.
vs. with increasing/decreasing Vbias. It is worth noting the enhancement factor of
  at Vbias = +0.3 V (6.0× compared to Vbias = 0 V) is larger than that for
  at Vbias = −0.3 V (5.82× compared to Vbias = 0 V). This asymmetry is mainly attributed to the higher charge on Ru(NH3)63+ compared to FcTMA+ as the two molecules have very similar diffusion coefficients (see ESI Table S1†).19 This result suggests that migration through the channels plays a significant role in the modulation of mass transport towards the electrode surface.
To quantitatively analyze the contributions from EOF and migration, we developed a finite element 3-D model to simulate the concentration profiles and voltammograms observed in the experiment. The geometry of the model is shown in Fig. S2.† The Nernst–Planck equation (eqn (2)) with electroneutrality was used to describe the mass transport:
 | (2) |
 | (3) |
The fluidic flow is described by the Navier–Stokes equation (eqn (4)), and electroosmotic flow velocity at the slip plane is described by Helmholtz–Smoluchowski equation (eqn (5)).
 | (4) |
 | (5) |
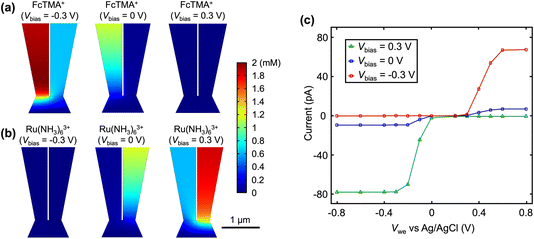
The first simulation condition is consistent with Fig. 1: the left channel contains 2 mM FcTMA+ and 2 mM KCl, while the right channel contains 2 mM Ru(NH3)63+ and 2 mM KCl. Diffusion-limited current is enforced at the substrate electrode. Fig. 2a shows the concentration profile for FcTMA+ at different Vbias. At Vbias = 0 V, a concentration gradient is observed for FcTMA+ in its channel, while close to 0 mM is observed in the other channel. At Vbias = −0.3 V, a significant amount of FcTMA+ is present in both channels even though it is consumed at a mass transport limited rate at the substrate electrode. Indeed, 0.9 mM FcTMA+ is found within 4 μm from the pipette opening into the channel where FcTMA+ was initially absent. The enrichment of FcTMA+ in both channels and the droplet is due to its EOF and migration from the bulk solution of FcTMA+ to the other channel through the droplet. At Vbias = +0.3 V, the direction of EOF and migration is reversed, and FcTMA+ is depleted in both channels in the entire region as shown in Fig. 2a (3 μm from the substrate). This enrichment or depletion of FcTMA+ directly increases or decreases the limiting current for FcTMA+, as shown in the simulated voltammograms in Fig. 2c. The trend of enrichment or depletion of Ru(NH3)63+vs. Vbias is the opposite of the trend for FcTMA+ because Ru(NH3)63+ is in the opposite channel. At Vbias = −0.3 V, the potential in the Ru(NH3)63+ channel is more negative than the FcTMA+ channel, causing the recession of Ru(NH3)63+ into the bulk of solution and its depletion in the droplet (Fig. 2b). Conversely, at Vbias = +0.3 V, Ru(NH3)63+ is moved from the bulk of the left channel to the right channel through the droplet and enriched near the electrode surface. The depletion and enrichment of Ru(NH3)63+ also show up as a decrease and increase in the respective limiting current (Fig. 2c). Overall, the simulated voltammogram in Fig. 2c is consistent with the experimental results in Fig. 1a.
Because the limiting currents in the simulation match those in the experiment within 15%, we used the simulation results to reveal the contribution from migration and EOF. At Vbias = +0.3 V, it was found that the contribution of migration at  near the electrode surface is 5× higher than EOF (Fig. 2c). The case is different for FcTMA+, as it was observed that at Vbias = −0.3 V, the contribution of migration near the electrode surface is only 1.25× higher than EOF at the mass transfer limiting current. Therefore, migration is the most important mode of transport for Ru(NH3)63+, while its contribution is similar to EOF for FcTMA+. The observation is expected because Ru(NH3)63+ has a higher charge (3+), and would be 3× faster compared to FcTMA, which is observed in the simulation. Any minor differences can likely be attributed to the slight differences in diffusion coefficients.19
To eliminate the contribution of migration, a neutral redox molecule, ferrocenedimethanol (Fc(MeOH)2), is used in the proceeding study. A schematic representation of this experiment is shown in Scheme 2. Under the same electric field, the magnitude of EOF is directly related to the potential profile in the electrical double layer (EDL), which can be altered by the surface charge and ionic strength of the solution.23,24 We first change the surface charge on the pipette via solution pH: at pH below the pKa (∼3), the silanol groups (Si–OH) on the glass surface are neutral. Under this condition, EOF is negligible. In contrast, at higher pH, silanol groups are deprotonated which results in negative surface charges. Under this condition, a strong EOF can be induced.
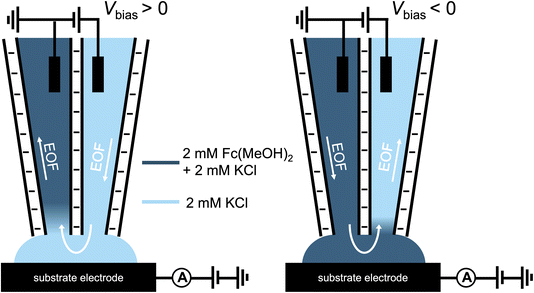 | ||
| Scheme 2 Experimental setup for the Fc(MeOH)2–KCl system utilized for Fig. 3–5. The left channel contains 2 mM Fc(MeOH)2 and 2 mM KCl (dark blue), while the right channel contains 2 mM KCl (light blue). | ||
Cyclic voltammograms of the Fc(MeOH)2–KCl system at pH = 7 are shown in Fig. 3a. At this pH, significant increases in limiting current are observed at Vbias = −0.3 V compared to 0 V, consistent with an EOF flowing from the Fc(MeOH)2 channel to the KCl-only channel through the droplet, effectively increasing the flux of Fc(MeOH)2 towards the electrode surface. When Vbias = +0.3 V, the direction of EOF is reversed, and therefore, a decrease in the limiting current is observed. Quantitatively, a 7× increase in the limiting current is observed due to EOF alone when Vbias is switched from +0.3 V to −0.3 V. In the mixed EOF/migration study in Fig. 1a,  is essentially eliminated when switching to Vbias = −0.3 V. Because of the similar experimental conditions (ionic strength, pH and pipette size) in these two studies, and the similar diffusion coefficients of FcTMA+ and Fc(MeOH)2, the experimental results are consistent with the conclusions from the simulation: EOF and migration have a near equal contribution for FcTMA+ at pH 7. At pH = 1, the limiting current for Fc(MeOH)2 oxidation is not sensitive to Vbias, as shown in Fig. 3b, which is consistent with the neutralization of the surface charge at a low pH effectively eliminating the EOF.21,23,25 Because our voltammetric experiment approaches a steady state, the limiting current for the oxidation of the neutral Fc(MeOH)2 molecule should have no migration contribution as has been shown by Amatore et al.26
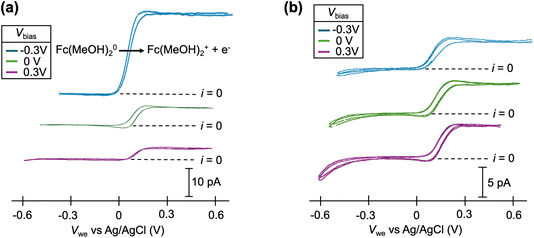 | ||
| Fig. 3 Cyclic voltammograms of 2 mM ferrocenedimethanol (Fc(MeOH)2) at (a) pH = 7 and (b) pH = 1 at Vbias = −0.3, 0, and 0.3 V. Each condition shows 2 cycles of voltammogram. | ||
The effect of surface charge (via altering solution pH) on  at different Vbias is summarized in Fig. 4a. Overall, this increases with pH at fixed Vbias, further confirm that the higher pH led to a surface charge and zeta potential.21,24,27 Note that buffer concentrations were adjusted to match the ionic strength for pH 3 and 7. This trend of limiting current vs. Vbias can be reproduced in finite element simulation when assuming different values of zeta potential (ζ) as shown in Fig. 4b.23 Notably, at pH = 1, the surface charge and ζ are both 0, eliminating the EOF.
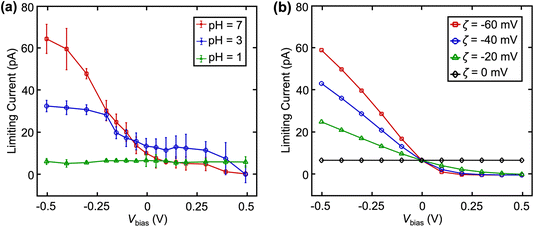 | ||
| Fig. 4 (a) Experimental and (b) simulated limiting currents of 2 mM Fc(MeOH)2 as a function of Vbias at various pH. Error bars indicate standard deviation in a sample size of n = 4. | ||
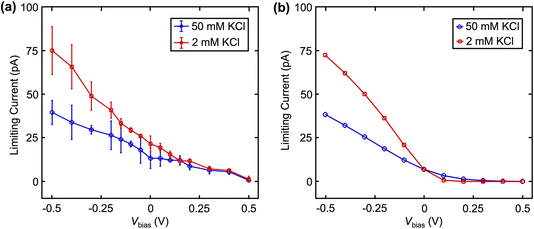
We further validate the contribution of EOF in dual barrel SECCM by changing the solution ionic strengths (Fig. 5). The EDL is known to be compressed at higher ionic strength, resulting in a steeper drop of the potential in the EDL and a smaller zeta potential.24 Based on this phenomenon, a smaller EOF is expected at higher ionic strength. Fig. 5a shows the limiting current of Fc(MeOH)2 at different Vbias with 2 mM and 50 mM KCl as the supporting electrolyte. Note the KCl concentration is the same in both channels, but the left channel additionally contains 2 mM Fc(MeOH)2. As expected, with increased ionic strength, we observe a smaller change of limiting current in response to Vbias, suggesting a lower EOF at higher ionic strength as expected.23,24 These results are further confirmed near quantitatively by the finite element model (Fig. 5b) by adjusting ζ to match the literature values of glass in different concentrations of KCl solution.23 The small discrepancies between experimental data (averaged among n = 4 nanopipettes) and simulation in Fig. 4 and 5 are attributed to uncertainty in diffusion coefficients, zeta potentials, and exact pipette geometry.
Lastly, we visualized the mass transport tracking a fluorescent dye molecule, 6-aminofluorescein (6-AF), a under microscope at different Vbias as shown in Fig. 6 and Movie S1.† Because 6-AF is neutral in our solution conditions, it resembles the Fc(MeOH)2–KCl system illustrated in Scheme 2, which serves to probe the EOF.19 At Vbias = 0, no visible movement of the fluorescent molecule is observed (Fig. 6a). As Vbias is linearly stepped to +0.5 V, the fluorescent molecule recesses from the tip into its channel (Fig. 6b–c). As Vbias is linearly stepped to −0.5 V, the fluorescent molecule moves back to the tip and into the other channel, which is enriched near the tip (Fig. 6d–g). The motion of the fluorescent molecules is consistent with the limiting currents in the voltammograms observed experimentally (Fig. 3). After the potential is swept back to 0 V again, the dual channel pipette returns to its original state, with each channel isolated in its original contents (Fig. 6h and i).
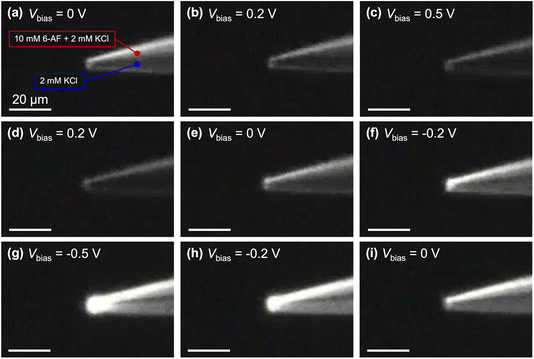 | ||
| Fig. 6 Fluorescent imaging of mass transport in a dual-barrel pipette at different Vbias. The upper lumen contains 10 mM 6-aminofluorescein (6-AF) and 2 mM KCl, and the lower lumen contains 2 mM KCl only. Scale bars: 20 μm. The micrographs were collected from Movie S1.† | ||
We further quantify the fluorescence intensity of the upper and lower barrels, and the locations are indicated on the optical micrograph in Fig. 7a. As shown in Fig. 7b, lower biases (i.e., more negative Vbias) result in higher intensity in the upper barrel. Meanwhile, the fluorescence intensity also increases in the lower channel, consistent with the EOF-assisted transport of the fluorescent molecule through the droplet at the pipette tip into the other barrel. In contrast, at more positive Vbias, the fluorescence intensity in each channel decreases. Both observations agree with the limiting currents observed in the voltammetric experiments. Note that pipettes with larger openings (5 μm in diameter) were used in the fluorescent experiment to afford a higher optical signal.
Conclusion
In this study, we characterized the contributions of migration and electroosmotic flow induced by electrochemical redox molecules in dual-barrel SECCM. We showed that at neutral pH, migration makes the major contribution when the species is highly charged, while the contributions of migration and EOF are similar for singly charged species. Furthermore, our experimental approach incorporated fluorescence imaging alongside finite element simulation, offering a comprehensive visualization and understanding of the contribution of these mass transport phenomena. We anticipate that this integrated methodology holds great promise for advancing research not only in electrochemical synthesis but also in the localized exploration of kinetics pertinent to electrocatalytic reactions and in correlative detection studies. Additionally, our findings suggest new avenues for precise modulation of reaction flux at the nanoscale, thereby enriching the landscape of electrochemistry.Experimental
Chemicals and materials
The following chemicals were used in the experiments: hexaammineruthenium(III) chloride (Thermo Fisher Scientific), (ferrocenylmethyl)trimethylammonium chloride (Tokyo Chemical Industry), 1,1′-ferrocenedimethanol (Sigma Aldrich), 6-aminofluorescein (Sigma Aldrich), potassium chloride (Fisher Chemical), sodium phosphate monobasic (Fisher Chemical), sodium phosphate dibasic (Fisher Chemical), hydrochloric acid 70% (Millipore Sigma), and deionized (DI) water (18.2 MΩ cm, synergy water purification system). Silver/silver chloride (Ag/AgCl) wires were used as quasi-reference counter electrodes (QRCE) and were prepared by immersing an Ag wire (0.25 mm diameter, 99.9% metals basis, Thermo Scientific) in a bleach solution and sonicated for 5 minutes followed by 1 minute of sonication in DI water.Nanopipette fabrication
Dual channel nanopipettes were prepared using theta quartz capillaries (QT120-90-7.5, Sutter Instrument). The pulling parameters were HEAT = 700, FIL = 4, VEL = 40, DEL = 130, and PUL = 30 for line 1 and HEAT = 650, FIL = 3, VEL = 30, DEL = 130, and PUL = 100 for line 2.SECCM measurements
The SECCM experiments were performed on an in-house assembled scanning electrochemical probe system. The vertical movement of the pipet was controlled by a one-axis piezo-positioner (NPX 25-105, nPoint), and the x–y movement of the substrate working electrode was controlled by a two-axis piezo-positioner (P-622.2CD, Physik Instrumente). The scanning probe system was mounted on a vibration isolation platform (25BM-6, Minus K Technology) and enclosed in a custom-built Faraday cage. Voltage control and current measurements were achieved by Patch-clamp amplifiers (HEKA EPC10 USB with S-Probe, Harvard Bioscience Inc.) and DDPCA-300 (FEMTO). Data acquisition was accomplished via FPGA card (USB-7855R, National Instruments) and interfaced with the Warwick Electrochemical-Scanning Probe Microscopy Platform (WEC-SPM) software, which was kindly provided by the Warwick Electrochemistry & Interfaces Group (WEIG).Fluorescence measurements
Fluorescent and optical microscopy measurements were performed using a microscope (Eclipse TE2000-U Microscope, Nikon). Image focusing was accomplished using an objective lens (Plan Fluor 20×/0.5 NA 2.1 mm WD, Nikon). Wavelengths for excitation were accomplished by a lamp (X-Cite Series 120 Q, Excelitas Technologies) and a filter (Green Interference Filter 33 mm with slider, Nikon). Bias voltages for fluorescent imaging were controlled with a source meter (6430 Sub-Femtoamp Remote SourceMeter, Keithley). Images and videos were collected via software V++ (Digital Optics) and Bandicam (Bandicam Company), respectively.Author contributions
SW performed the key experiments/analysis and drafted the manuscript. HL assisted in data analysis and simulation. HR conceived the project and drafted the manuscript.Conflicts of interest
The authors declare no conflicts of interest.Acknowledgements
The authors would like to acknowledge support from the Chemical Measurement & Imaging Program (CMI) at the National Science Foundation (NSF) under Grant No. CHE-2240113 and the Sloan Foundation (FG-2023-20317). We also thank Prof. Richard M. Crooks for providing the fluorescence microscope instrument and Prof. Martin Edwards for the helpful discussions.References
- C. H. Ryu, H. Lee, H. Lee and H. Ren, J. Phys. Chem. Lett., 2022, 13, 7838–7846 CrossRef CAS.
- E. Daviddi, K. L. Gonos, A. W. Colburn, C. L. Bentley and P. R. Unwin, Anal. Chem., 2019, 91, 9229–9237 CrossRef CAS.
- M. Kang, C. L. Bentley, J. T. Mefford, W. C. Chueh and P. R. Unwin, ACS Nano, 2023, 17, 21493–21505 CrossRef.
- B. Tao, I. J. McPherson, E. Daviddi, C. L. Bentley and P. R. Unwin, ACS Sustain. Chem. Eng., 2023, 11, 1459–1471 CrossRef CAS PubMed.
- C. Chen, H. Jin, P. Wang, X. Sun, M. Jaroniec, Y. Zheng and S.-Z. Qiao, Chem. Soc. Rev., 2024, 53, 2022–2055 RSC.
- Y. Wang, M. Li and H. Ren, ACS Meas. Sci. Au, 2022, 2, 304–308 CrossRef CAS.
- N. Ebejer, M. Schnippering, A. W. Colburn, M. A. Edwards and P. R. Unwin, Anal. Chem., 2010, 82, 9141–9145 CrossRef CAS PubMed.
- M. E. Snowden, A. G. Güell, S. C. S. Lai, K. McKelvey, N. Ebejer, M. A. O'Connell, A. W. Colburn and P. R. Unwin, Anal. Chem., 2012, 84, 2483–2491 CrossRef CAS PubMed.
- R.-J. Yu, Y.-L. Ying, R. Gao and Y.-T. Long, Angew. Chem., Int. Ed., 2019, 58, 3706–3714 CrossRef CAS PubMed.
- D. Martín-Yerga, P. R. Unwin, D. Valavanis and X. Xu, Curr. Opin. Electrochem., 2023, 42, 101405 CrossRef.
- C. L. Bentley, M. Kang, F. M. Maddar, F. Li, M. Walker, J. Zhang and P. R. Unwin, Chem. Sci., 2017, 8, 6583–6593 RSC.
- R. G. Mariano, K. McKelvey, H. S. White and M. W. Kanan, Science, 2017, 358, 1187–1192 CrossRef CAS.
- C. L. Bentley, J. Edmondson, G. N. Meloni, D. Perry, V. Shkirskiy and P. R. Unwin, Anal. Chem., 2019, 91, 84–108 CrossRef CAS.
- M. Choi, N. P. Siepser, S. Jeong, Y. Wang, G. Jagdale, X. Ye and L. A. Baker, Nano Lett., 2020, 20, 1233–1239 CrossRef CAS PubMed.
- K. McKelvey, M. A. O'Connell and P. R. Unwin, Chem. Commun., 2013, 49, 2986–2988 RSC.
- H. Lee, K. C. Matthews, X. Zhan, J. H. Warner and H. Ren, ACS Nano, 2023, 17, 22499–22507 CrossRef CAS.
- Y. Zhao, L. Lin, R. Liu, Y. Liu, Y. Wang and D. Wang, Anal. Chem., 2024, 96, 4190–4196 CrossRef CAS PubMed.
- W. Brown, Y. Li, R. Yang, D. Wang, M. Kvetny, H. Zheng and G. Wang, Chem. Sci., 2020, 11, 5950–5958 RSC.
- A. J. Bard, L. R. Faulkner and H. S. White, Electrochemical Methods Fundamentals and Applications, John Wiley & Sons Ltd, 2022 Search PubMed.
- M. V. Mirkin and A. Shigeru, Nanoelectrochemistry, CRC Press, 1st edn, 2015 Search PubMed.
- L. Zhang, T. Kang, J. Kang, X. Zhang, R. Zhang and G. Kang, ACS Omega, 2020, 5, 29257–29264 CrossRef CAS PubMed.
- B. Blount, G. Juarez, Y. Wang and H. Ren, Faraday Discuss., 2022, 233, 149–162 RSC.
- H. C. Li and P. L. De Bruyn, Surf. Sci., 1966, 5, 203–220 CrossRef CAS.
- J. Lyklema, Fundamentals of Interface and Colloid Science, Elsevier, 2005 Search PubMed.
- M. A. Hayes, I. Kheterpal and A. G. Ewing, Anal. Chem., 1993, 65, 27–31 CrossRef CAS PubMed.
- C. Amatore, B. Fosset, J. Bartelt, M. R. Deakin and R. M. Wightman, J. Electroanal. Chem. Interfacial Electrochem., 1988, 256, 255–268 CrossRef CAS.
- W.-L. Tseng, M.-M. Hsieh, S.-J. Wang and H.-T. Chang, J. Chromatogr. A, 2000, 894, 219–230 CrossRef CAS.
Footnote |
| † Electronic supplementary information (ESI) available. See DOI: https://doi.org/10.1039/d4fd00080c |
| This journal is © The Royal Society of Chemistry 2025 |

