 Open Access Article
Impact of morphology and oxygen vacancy content in Ni, Fe co-doped ceria for efficient electrocatalyst based water splitting†
Abhaya Kumar
Mishra
a,
Joshua
Willoughby
a,
Shanna L.
Estes
 b,
Keliann Cleary
Kohler
c and
Kyle S.
Brinkman
 *a
*a
aDepartment of Materials Science and Engineering, Clemson University, Clemson, SC 29634, USA. E-mail: ksbrink@clemson.edu
bDepartment of Environmental Engineering and Earth Sciences, Clemson University, Anderson, SC 29625, USA. E-mail: sestes@clemson.edu
cAdvanced Materials Research Laboratory (AMRL), Clemson University, Anderson, SC 29625, USA. E-mail: kelliak@clemson.edu
First published on 23rd July 2024
Abstract
Designing a highly efficient, low-cost, sustainable electrocatalyst for the hydrogen evolution reaction (HER) and oxygen evolution reaction (OER) through water splitting is a current challenge for renewable energy technologies. This work presents a modified sol–gel route to prepare metal-ion(s) doped cerium oxide nanostructures as an efficient electrocatalyst for overall water splitting. Nickle (Ni) and iron (Fe) co-doping impacts the morphology in cerium oxide resulting in 5 nm nanoparticles with a mesoporous-like microstructure. The high level 20 mol% (1![[thin space (1/6-em)]](https://www.rsc.org/images/entities/char_2009.gif) :
:![[thin space (1/6-em)]](https://www.rsc.org/images/entities/char_2009.gif) 1 ratio) of Ni + Fe bimetal-ion(s) doped CeO2 shows excellent HER and OER activities compared to the monodoped Fe/Ni and pristine CeO2. The co-doped catalysts required a low overpotential of 104 mV and 380 mV for HER and OER, respectively, in 1 M KOH, at a current density of 10 mA cm−2. The Tafel slopes of 95 mV dec−1 and 65 mV dec−1 were measured for HER and OER with the same representative samples which demonstrated excellent stability even after continuous operation for 20 hours in the alkaline medium. The unique morphology, enhanced oxygen vacancy (Ov) content and the synergistic effects of dopants in CeO2 play essential roles in enhancing the activities of Ni + Fe doped samples.
1 ratio) of Ni + Fe bimetal-ion(s) doped CeO2 shows excellent HER and OER activities compared to the monodoped Fe/Ni and pristine CeO2. The co-doped catalysts required a low overpotential of 104 mV and 380 mV for HER and OER, respectively, in 1 M KOH, at a current density of 10 mA cm−2. The Tafel slopes of 95 mV dec−1 and 65 mV dec−1 were measured for HER and OER with the same representative samples which demonstrated excellent stability even after continuous operation for 20 hours in the alkaline medium. The unique morphology, enhanced oxygen vacancy (Ov) content and the synergistic effects of dopants in CeO2 play essential roles in enhancing the activities of Ni + Fe doped samples.
1. Introduction
Renewable energy technologies are required to address worldwide energy demands and environmental pollution issues.1 In this regard, hydrogen fuel generated by electrochemical water-splitting is considered a promising chemical method for energy storage.2–5 The efficiency of water electrolysis relies on the electrochemical activities of two half-reactions: the hydrogen evolution reaction (HER) at the cathode to produce hydrogen; and the oxygen evolution reaction (OER) at the anode to produce oxygen.6–8 It is often found that HER active electrocatalysts are not suited for OER and vice versa due to the complexity of the reaction mechanisms.9,10 Platinum (Pt)-based cathodes and RuO2/IrO2 anodes serve as current benchmarks for HER and OER activity;11,12 however, the high cost and scarcity of these noble metal based electrodes hinder industrial applications.13–16 Additionally, during water splitting, catalysts can undergo dissolution and redeposition, leading to electrode cross-contamination, which requires increased energy input to maintain desired reaction rates, significantly raising operational expenses.17 Therefore, cost-effective, efficient, noble-metal-free electrocatalysts for both the HER and OER is a priority need for renewable energy technology.In this context, cerium oxide (CeO2, ceria), a rare earth metal oxide, is an ideal model system to explore the impact of dopants on oxygen vacancy (Ov) content and microstructure. Moreover, the ratio of Ce4+/Ce3+ in CeO2 controls the ionic/electronic conductivity, and Ov creation.18–21 Increased co-doping of CeO2 nanostructures may introduce a significant number of defects, leading to surface alteration, substantial changes in the local coordination of atoms, and a modified electronic environment, all of which may contribute to regulate work function for optimizing catalyst performance.22,23 It was reported that various bimetal cation(s), such as (Co + Cu), (Cu + Fe), (Cu + Mn), (Cu + Ni), etc., as co-dopants in the CeO2 nanostructure enhance electrochemical, catalytic, and photocatalytic activity.24–28 Therefore, strategically selecting a combination of metal ions for co-doping into the lattice of CeO2 nanostructures could enhance water-splitting activities.
Traditionally, 3d transition metal cation(s) are employed as co-dopants in HER and OER electrocatalysts because of their suitable ionic size and redox activity.29–31 Among the various 3d transition metal ions, Ni and Fe are the primary choices as dopants to enhance the electrochemical water splitting activities.32–34 For example, Hai et al. found that Ni, Fe co-doped W18O49 grown on nickel foam boosted water splitting activities.35 At present, no reports are available on Ni and Fe as co-dopants in nanostructured CeO2 for bifunctional HER and OER activities. A number of synthesis methods are available for fabrication of Ni, Fe co-doped CeO2, including hydrothermal, coprecipitation, sol–gel, and flame-made.36–39 Among the above methods, sol–gel synthesis has attracted the most attention because it yields homogenous distribution of dopants. Dopant contents in ceria ranging from 5–30 at% have been achieved using sol–gel synthesis, with maximum Ov achieved for CeO2 doped with 10 at% of Fe.40–42
The present study aims to evaluate the impact of up to 20 mol% Ni, Fe and Ni + Fe co-doping on the electrochemical activity of CeO2 for water splitting. A modified sol–gel method was employed to synthesize pristine, (10 + 10) mol% Ni + Fe, as well as 20 mol% of Ni and Fe metal cation(s) doped CeO2 nanostructure. The novelty of the present work lies in preparing the catalysts without the involvement of a surfactant to control the size and acid/base to adjust the pH. The synthesis method is highly flexible and associated with a single step to introduce a high amount 20 mol% of co-doped cation(s) into the host matrix in the aqueous medium. The absence of impurity phases and uniform distribution of dopant(s) are discussed based on XRD and TEM-HRTEM results. Further, Raman spectroscopy was utilized to quantify the enhanced concentration of Ov in doped catalysts. Finally, the as-synthesised catalysts for HER and OER were evaluated by linear sweep voltammetry (LSV), cyclic voltammetry (CV), potentiostatic impedance (EIS), and chronoamperometry (i–t). The HER and OER activity of as-synthesized materials were compared from the overpotential required to achieved current density 10 mA cm−2, which is equivalent to 10% solar-to-fuel conversion efficiency.43 The present work controlled the size of co-doped CeO2 into 5 nm nanoparticles with a mesoporous microstructure that exhibits higher HER and OER activities as compared to mono-doped (Ni/Fe) and pristine CeO2.
2. Experimental section
2.1. Chemicals
Cerium nitrate hexahydrate Ce(NO3)2·6H2O, nickel(III) acetate hydrate, iron(III) nitrate nonahydrate, ethylene diamine (ED), ethylenediaminetetraacetic acid (EDTA), all from Thermo Scientific; N-methyl-2-pyrrolidone (NMP) from TCI, and nickel foam from MSE Supplies were analytical grade and used without modification.![[thin space (1/6-em)]](https://www.rsc.org/images/entities/char_2009.gif) :
:![[thin space (1/6-em)]](https://www.rsc.org/images/entities/char_2009.gif) 3
3![[thin space (1/6-em)]](https://www.rsc.org/images/entities/char_2009.gif) :
:![[thin space (1/6-em)]](https://www.rsc.org/images/entities/char_2009.gif) 1, respectively. The soluble EDTA-ED combination undergoes condensation reactions to form polymeric gel during heating. The EDTA-ED combination and the condensation process entrap dopants and host metal cations in the organic framework via coordinate bonding. Consequently, the metal cation(s) distribute uniformly, facilitating their incorporation into the doped host lattice during subsequent annealing steps. In brief, 0.292 g of EDTA (1 mmol) was mixed with 25 mL of water in a 200 mL beaker. To the EDTA-water mixture, 200 μL (3 mmol) ED was added with continuous stirring at 300 rpm to obtain a clear solution. Then, the required amount of cerium precursor salt (1 mmol) dissolved in 25 mL of water was added to the EDTA-ED solution drop by drop. The above sol solution was kept at 70 °C to form a polymeric-like gel. The above gel was heated at 200 °C for 2 h to form a voluminous carbonaceous material, which was finally calcined at 450 °C for 5 h to obtain the desired CeO2 nanostructure.
1, respectively. The soluble EDTA-ED combination undergoes condensation reactions to form polymeric gel during heating. The EDTA-ED combination and the condensation process entrap dopants and host metal cations in the organic framework via coordinate bonding. Consequently, the metal cation(s) distribute uniformly, facilitating their incorporation into the doped host lattice during subsequent annealing steps. In brief, 0.292 g of EDTA (1 mmol) was mixed with 25 mL of water in a 200 mL beaker. To the EDTA-water mixture, 200 μL (3 mmol) ED was added with continuous stirring at 300 rpm to obtain a clear solution. Then, the required amount of cerium precursor salt (1 mmol) dissolved in 25 mL of water was added to the EDTA-ED solution drop by drop. The above sol solution was kept at 70 °C to form a polymeric-like gel. The above gel was heated at 200 °C for 2 h to form a voluminous carbonaceous material, which was finally calcined at 450 °C for 5 h to obtain the desired CeO2 nanostructure.
![[thin space (1/6-em)]](https://www.rsc.org/images/entities/char_2009.gif) :
:![[thin space (1/6-em)]](https://www.rsc.org/images/entities/char_2009.gif) 2 (Ce
2 (Ce![[thin space (1/6-em)]](https://www.rsc.org/images/entities/char_2009.gif) :
:![[thin space (1/6-em)]](https://www.rsc.org/images/entities/char_2009.gif) Fe/Ni) and 8
Fe/Ni) and 8![[thin space (1/6-em)]](https://www.rsc.org/images/entities/char_2009.gif) :
:![[thin space (1/6-em)]](https://www.rsc.org/images/entities/char_2009.gif) 1
1![[thin space (1/6-em)]](https://www.rsc.org/images/entities/char_2009.gif) :
:![[thin space (1/6-em)]](https://www.rsc.org/images/entities/char_2009.gif) 1 (Ce
1 (Ce![[thin space (1/6-em)]](https://www.rsc.org/images/entities/char_2009.gif) :
:![[thin space (1/6-em)]](https://www.rsc.org/images/entities/char_2009.gif) Ni
Ni![[thin space (1/6-em)]](https://www.rsc.org/images/entities/char_2009.gif) :
:![[thin space (1/6-em)]](https://www.rsc.org/images/entities/char_2009.gif) Fe)) were dissolved in 25 mL water to give 1 mmol of total cations, i.e., dopant(s) (Ni, Fe)/(Ni + Fe) + host (Ce).
Fe)) were dissolved in 25 mL water to give 1 mmol of total cations, i.e., dopant(s) (Ni, Fe)/(Ni + Fe) + host (Ce).
| ERHE = E0SCE + ESCE + 0.0594 pH | (i) |
| Ecorrcted = Eexp − EiR = ERHE − (Imea × Rs) |
3. Results and discussion
3.1. Structural properties
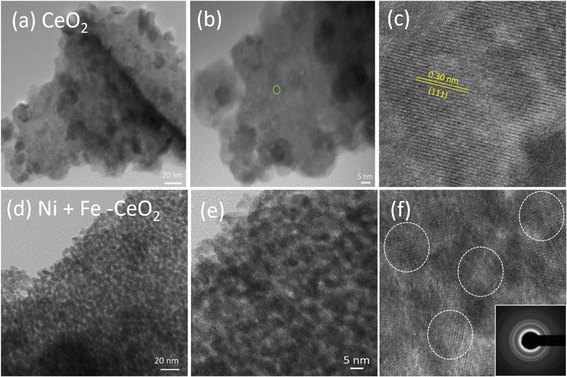
The crystal structures and different phases of as-synthesized materials were evaluated from the recorded PXRD patterns. Fig. 1a shows the XRD data of 20% of Ni, Fe mono-doped, equimolar Ni + Fe co-doped, and pristine CeO2 powder samples. The diffraction peaks of the undoped samples are well-matched to the cubic fluorite structure of CeO2, indicating that as-synthesized catalysts have no impurities within the detection limits. The observed individual peak positions were indexed according to the reference pattern JCPDS card no. 01-080-6915. No additional peaks were noticed from the doped metal-ion(s) precursor. However, a shift and broadening in the peaks were found by introducing dopants, as evidenced by the magnified (111) and (200) peak positions shown in Fig. 1b. As seen, the increase in full-width at half maximum (FWHM) with the addition of Ni/Fe and Ni + Fe heteroatom (s) may be due to uniform doping, resulting in a reduction in the coherence of crystalline regions which is also reflected in high-resolution TEM images (Fig. 3f). It is expected that metal cation(s) Ni2+ (0.69 A)47 and Fe3+ (0.79 A)48 introduction into the CeO2 to replace higher oxidation state Ce4+ would results in an significant change in the two theta value resulting from lattice contraction/extension.49 However, insignificant change in the lattice parameter were observed owing to change in the ratio of Ce3+ to Ce4+ along with creation of Ov. Table 1 highlights the physicochemical properties of the catalysts.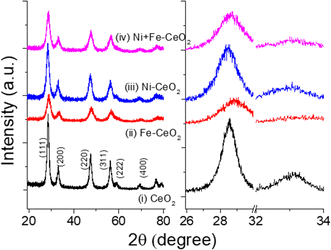 | ||
| Fig. 1 Powder X-ray patterns of (a) undoped, Ni, Fe doped, and (Ni + Fe) co-doped CeO2 catalyst. (b) Enlarged view of (111) and (200) facets of the corresponding diffraction patterns. | ||
3.2 Raman analysis
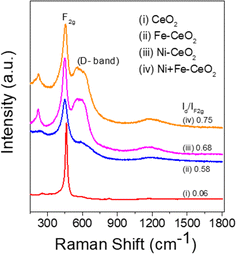
Raman spectroscopy analysis of the catalysts was carried out to understand the effect of doping into the CeO2 lattice framework. Fig. 2a displays the Raman spectra of undoped, mono, and co-doped CeO2 samples. The Raman spectra of pure CeO2 samples show a band at 462 cm−1 corresponding to a triply degenerate symmetrical stretching band (F2g) of CeO2 fluorite structure.50 A significant shift towards higher wavenumber along with broadening was noticed for F2g bands for the other samples, indicating the doping of metal ion(s) into the CeO2 lattice unit, in agreement with the observed XRD results (Fig. 1b).51,52 Changes in the intensity and frequency of F2g bands evidence the interaction between dopant(s) and host CeO2. In addition, a small defect induced band (D) at 602 cm−1 was observed, which is due to Raman selection rules associated with defects of CeO2, particularly oxygen vacancies.49,53 In the CeO2 structure, Ce ions exist in either 3+ or 4+ oxidation states therefore the introduction of aliovalent ion(s), such as Ni2+ and Fe3+, leads to symmetry breaking. As a result, to maintain the charge neutrality in the ionic crystal, a larger size of Ce3+ and an oxygen vacancy are formed.54 The ratio of D and F2g band intensities (ID and IF2g respectively) were utilized to estimate the oxygen vacancy concentration. The values of Id/IF2g of the as-synthesized catalysts follow the trends Ni + Fe-CeO2 > Ni-CeO2 > Fe-CeO2 > CeO2. It is seen that the Ni + Fe co-dopant generates more oxygen vacancies than Ni and Fe mono-doped CeO2 at the same 20 mol% doping level. The optimal Fe content (10 mol%) in Ni + Fe doped CeO2 may exhibits charge compensation mechanism, which involve extrinsic and intrinsic point defects.55 Kroger–Vink notation is adopted to describe the process shown below:56 | (ii) |
 | (iii) |
 are the Ce4+, and Ce3+ on cerium lattice sites of CeO2,
  is the O2− ion on oxygen lattice sites, and
  represents the formation of oxygen vacancy in CeO2 release two free electron. However, higher levels of Fe dopants in excess of 10 mol% may result in an interstitial compensation mechanism.57,58
 | (iv) |
3.3. Microstructure
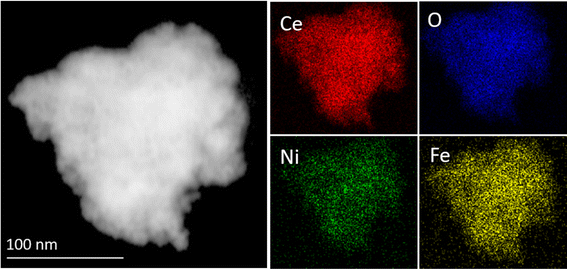
The microstructural features of the representative pristine CeO2 and Ni + Fe-CeO2 co-doped materials were evaluated by bright field TEM and HR-TEM images. Fig. 3(a and b) represents the TEM images of the pristine CeO2. As seen, pure CeO2 (Fig. 3a) exhibits a nanosheet-like morphology. Moreover, the magnified TEM images (Fig. 3b) confirmed that uniform nanoparticles with an average size of 10 nm were integrated to form the above-mentioned architecture. The high-resolution TEM images were collected from the region highlighted as green circles in the corresponding magnified TEM (Fig. 3c). The interplanar distance (d) value of 0.30 nm confirmed that the (111) facet of the CeO2 nanosheet is highly exposed, which is also seen as a highly intense peak in XRD patterns. It is seen in Fig. 3d that Ni + Fe-CeO2 exhibits mesopores like features. The average particle size of Ni + Fe doped samples were found to of 4–5 nm (Fig. 3e), which is half of the pristine CeO2. This observation indicates that the doping-induced change in the morphology of the pristine CeO2 nanosheet. Kumar et al. also reported the synthesis of similar mesoporous cerium oxide (CeO2) nanostructures by macroalgae polymer mediated approach.65 The short-range lattice arrangement evident from the HRTEM images shown in the Fig. 3f. In the HRTEM images coherence of crystalline regions are marked by dotted circles. The selected area electron diffraction (SAED) pattern shown as inset in Fig. 3f also support the single-phase nature of the Ni + Fe co-doped CeO2 mesoporous structure. This suggests the presence of Ni2+, and Fe3+ cation(s) as co-dopants has an impact on in the coherence of crystalline regions of doped CeO2 nanocrystals. The dramatic decreasing in the particle sizes offer more available sites for electrode/electrolyte interactions leading to higher electrochemical activities.The elemental mapping from high-angle annular dark-field scanning TEM (HAADF-STEM) of Ni + Fe-CeO2 samples is shown in Fig. 4. The analysis clearly indicates uniform distribution of Ni, Fe, Ce and O in mesoporous CeO2. Therefore, the Ni + Fe-CeO2 co-doped catalyst with 20 mol% at 1![[thin space (1/6-em)]](https://www.rsc.org/images/entities/char_2009.gif) :
:![[thin space (1/6-em)]](https://www.rsc.org/images/entities/char_2009.gif) 1 ratio of dopant(s) may affiliate with multiple bonding environments such as Ce–Fe–O, Ce–Ni–O, and Ce–Fe–Ni–O. These changes in the local atomic arrangement results in favourable sites for the multistep electrochemical water splitting reaction.
1 ratio of dopant(s) may affiliate with multiple bonding environments such as Ce–Fe–O, Ce–Ni–O, and Ce–Fe–Ni–O. These changes in the local atomic arrangement results in favourable sites for the multistep electrochemical water splitting reaction.
3.4. X-ray photoelectron spectroscopy
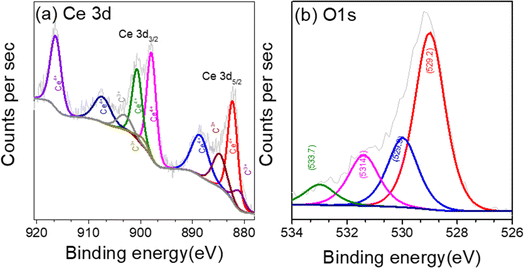
XPS analysis was carried out to investigate the surface composition and chemical states of the CeO2 nanosheet. The survey spectrum from XPS shown in Fig. S1† confirmed the presence of Ce, O, and carbon C. The region XPS spectra for Ce 3d, O 1s, are shown in Fig. 5a–c. The deconvoluted Ce 3d spectra in Fig. 5a shows multiplet peaks arising from the spin orbit coupling of Ce 3d5/2 and Ce 3d3/2 core level, respectively.66 The peaks in the high binding energy (BE) range 880–900 eV are ascribed to Ce 3d5/2 and the peak located in the range 900–920 correspond to Ce 3d3/2.67 The prominent photoelectron features at BE of 882.5, 888.9, and 898.1 eV signifies 3d5/2 for Ce4+, while that at 901.1, 907.6, and 916.7 eV correspond to 3d3/2 level of Ce4+.68 Similarly, the doublets at BE 880.9 and 885.2 eV is assigned to the Ce3+ 3d5/2 level, while the peaks at 899.4 and 903.6 eV are correspond to Ce3+ 3d3/2.69 This indicated the presence of Ce3+, and Ce4+, oxidation sate in CeO2. The corresponding O 1s spectra is displayed in Fig. 5b. The feature of O 1s showing peaks different binding energy due to different electronic environment. Experiments on doped and co-doped samples showed minimal impact on the shape or intensity of the XPS signal of the Ce 3d bands.40 The Ni 2p and Fe 3p region XPS spectra of Fe and Ni dopant in the Ni + Fe co-doped CeO2 sample are shown in Fig. S2.† The fitting peak of Ni 2p at 855.1 eV and 856.2 eV (Fig. S2a†) are attributed to +2 and +3 state of Ni. Strong satellite peak of Ni at 861.2 eV was also observed.70 The peaks at 55.4 eV and 56.7 eV (Fig. S2b†) in Fe 3p correspond to +3 and valence +4 oxidation states.71 The XPS analysis confirmed the presence of high valence Fe4+ and Ni3+ ions in co-doped samples crucial for achieving superior electrocatalytic water splitting activity.3.5 Electrochemical activities
The impact of 20 mol% Ni/Fe and (Ni + Fe) at 1![[thin space (1/6-em)]](https://www.rsc.org/images/entities/char_2009.gif) :
:![[thin space (1/6-em)]](https://www.rsc.org/images/entities/char_2009.gif) 1 dopant-(s) in CeO2 on the electrochemical activity were examined by a range of tests including LSV, i–t, CV, and EIS. All the tests were carried out in a three-electrode configuration under identical test conditions with 1 M KOH aqueous solution as the electrolyte. It is noted that the LSVs data were recorded at a slow sweep rate of 1 mV s−1 to minimize the capacitive current.72Fig. 6a displays the HER-LSV curves of all doped and pristine CeO2 along with bare nickel foam for comparison.
1 dopant-(s) in CeO2 on the electrochemical activity were examined by a range of tests including LSV, i–t, CV, and EIS. All the tests were carried out in a three-electrode configuration under identical test conditions with 1 M KOH aqueous solution as the electrolyte. It is noted that the LSVs data were recorded at a slow sweep rate of 1 mV s−1 to minimize the capacitive current.72Fig. 6a displays the HER-LSV curves of all doped and pristine CeO2 along with bare nickel foam for comparison.
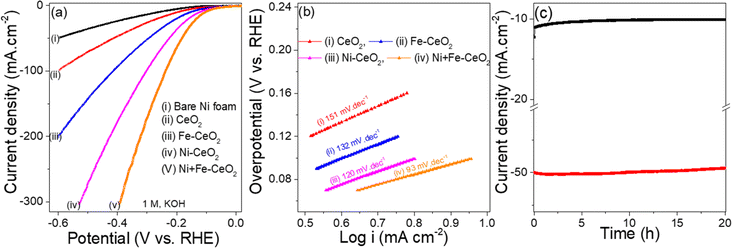
As seen from Fig. 6a, the bare nickel foam exhibits a high overpotential of (270 mV vs. RHE) to achieve (10 mA cm−2) current density, indicating the minor contribution for HER activities. The sharp distinctions of LSV curves with higher cathodic current densities for Ni, Fe, and Ni + Fe dopant(s) in CeO2 nanocrystal suggest the importance of employing a catalyst on the bare nickel foam. CeO2, Ni, Fe, Ni + Fe doped(s) exhibited overpotentials of 198 mV, 123 mV, 157 mV, and 104 mV respectively at the 10 mA cm−2 current density associated with optimized solar to fuel conversion efficiency. The lower overpotential and higher current density of Ni + Fe doped CeO2 catalyst compared to the other prepared electrodes as well as literature (Table 2) suggest superior HER activity. The excellent HER activities of the Ni + Fe CeO2 electrode are ascribed to the unique mesoporous morphology that creates more active sites and greater Ov point defect concentration.
| Active materials | HER | OER | Ref. | ||
|---|---|---|---|---|---|
| Overpotential (mV) | Tafel slope (mV dec−1) | Overpotential (mV) | Tafel slope (mV dec−1) | ||
| CeO2/Ce(OH)2 | 317 | 140 | 410 | 66 | 73 |
| CeO2-NiSe2 | 130 | 115 | — | — | 74 |
| gC3N4/CeO2/Fe3O4 | 310 | 102 | 400 | 74 | 75 |
| Gd-CeO2 | 99 | 183 | 369 | 211 | 76 |
| Cu supported Ni-P/CeO2 | 118 | 122 | — | — | 77 |
| 20% GDP-PBC | — | — | 420 | 79 | 78 |
| CeO2/Ni/NC | 320 | 150 | 390 | 123 | 79 |
| Mo2C/CeO2/NC | 220 | 123 | 80 | ||
| CeO2/Co@NCH | 520 | 145 | 479 | 149 | 81 |
| 20% Ni + Fe-CeO 2 | 104 | 93 | 380 | 65 | This work |
The HER kinetics and the reaction mechanism observed at the electrode surface were measured by the Tafel slope.82Fig. 6b exhibits the Tafel plots, and the Tafel slope of the samples are obtained from the linear fit of potential versus log![[thin space (1/6-em)]](https://www.rsc.org/images/entities/char_2009.gif) |i|. The co-doped CeO2 electrocatalyst exhibits considerably smallest Tafel value (93 mV dec−1), whereas the pristine CeO2 show higher Tafel value (150 mV dec−1) among all synthesized materials. The Tafel slope value of the Ni/Fe doped electrodes were found to 120/132 mV dec−1. A smaller Tafel slope reflects a kinetically favoured electrode reaction and higher HER activities. The HER histograms of Tafel slope and overpotential η10 (Fig. S3a†) for all electrodes suggest that it follows the Volmer–Heyrovsky mechanism in the alkaline medium as following steps.83
|i|. The co-doped CeO2 electrocatalyst exhibits considerably smallest Tafel value (93 mV dec−1), whereas the pristine CeO2 show higher Tafel value (150 mV dec−1) among all synthesized materials. The Tafel slope value of the Ni/Fe doped electrodes were found to 120/132 mV dec−1. A smaller Tafel slope reflects a kinetically favoured electrode reaction and higher HER activities. The HER histograms of Tafel slope and overpotential η10 (Fig. S3a†) for all electrodes suggest that it follows the Volmer–Heyrovsky mechanism in the alkaline medium as following steps.83
| Volmer steps: H2O + e− → OH− + Hads |
| Heyrovsky step: H2O + e− + Hads → OH− + H2 |
The Volmer step in an alkaline medium involves water reduction to adsorbed H (Hads) on active catalyst sites, while the Heyrovsky step corresponds to the desorption of Hads to generate a hydrogen molecule. In the Volmer–Heyrovsky mechanism, the Tafel slope value of 118 mV dec−1 suggests the Volmer step is the rate-determined step (RDS), while 40 mV dec−1 represents the Heyrovsky step as RDS.84 The observed HER Tafel slope value 93 mV dec−1 of Ni + Fe co-doped CeO2 mesoporous catalyst suggests that it follows the Volmer–Heyrovsky mechanism, with the Volmer step being the RDS.
The long-term stability test of the electrodes is an important parameter for industrial application. The stability tests of Ni + Fe-CeO2 (best HER performance electrocatalyst) was evaluated by conducting chronoamperometry test (Fig. 6c) at the overpotential of 104 mV vs. RHE, and 180 mV vs. RHE, respectively for 20 h. It is to be observed that an insubstantial change in current density 2.27%, and 2.38% at 104 mV, and 180 mV, were found even after 20 h of prolonged continuous operation.
The improvement of HER in co-doped CeO2 nanostructure can be attributed to (i) The unique mesopores formed with 20 mol% of Ni + Fe at 1![[thin space (1/6-em)]](https://www.rsc.org/images/entities/char_2009.gif) :
:![[thin space (1/6-em)]](https://www.rsc.org/images/entities/char_2009.gif) 1 dopant(s) (Fig. 2c and d) results in an increased number of active sites for electrode/electrolyte interaction (ii) surface alteration, changes in the local coordination of atoms along with the formation of Ov enhances the adsorption and desorption of the intermediates during the electrolysis and (iii) Ni, Fe bimetal cation(s) with different oxidation states and atomic size impact the local conductivity and charge density, resulting in faster charge transfer.85
1 dopant(s) (Fig. 2c and d) results in an increased number of active sites for electrode/electrolyte interaction (ii) surface alteration, changes in the local coordination of atoms along with the formation of Ov enhances the adsorption and desorption of the intermediates during the electrolysis and (iii) Ni, Fe bimetal cation(s) with different oxidation states and atomic size impact the local conductivity and charge density, resulting in faster charge transfer.85
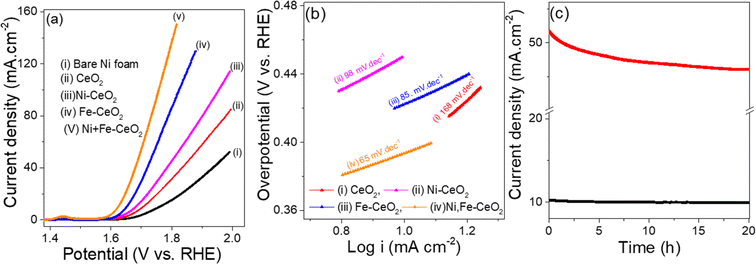
Similarly, the OER activities of as-synthesized electrodes were measured in the same three electrode configuration under 1 M KOH electrolyte solution. The LSV plots representing OER are collected at a scan rate of 1 mV s−1 and display in the Fig. 7a. The overpotential required to achieve a current density of 10 mA cm−2 follows the sequence of Ni + Fe co-doped (380 mV) < Fe-CeO2 (420 mV) < Ni-CeO2 (450 mV) < CeO2 (470 mV), respectively. Among the examined electrodes, the Ni + Fe-CeO2 sample shows notably low overpotential 380 mV at a current density of 10 mA cm−2, and the result is comparable to overpotentials required for other CeO2 based electrocatalysts such as Ru/CeO2 (420 mV),86 CeO2/Co@N-doped carbon (474 mV),87 and CeO2/CuO (410 mV).88 The Ni + Fe co-dopant in other catalysts systems has demonstrated an increase in the OER activity. For examples, Tuo et al. found from DFT modelling efforts that Ni + Fe co-doped CoSe2 shows a higher OER rate than Fe, Ni mono-doped catalyst.89 Recently Paladugu et al. demonstrated that 50% rare earth cation substitution for Ce in CeO2 created oxygen vacancies in the host lattices resulting in a decrease in the adsorption energy of the OH intermediate in OER.90 Yu et al. reported that CeO2−x-FeNi catalysts showed a higher OER performance than CeO2−x-Ni and CeO2-FeNi due to formation higher valence Ni cations in the Ni, Fe doped system.91 Tafel plots for all samples were collected to quantify the reaction kinetics as shown in the Fig. 7b. The Tafel slope found for Ni + Fe-CeO2 was 65 mV dec−1 which is lower than those Fe-CeO2 (85 mV dec−1), Ni-CeO2 (98 mV dec−1), and pristine CeO2 (168 mV dec−1), respectively. The histograms of Tafel slope and overpotential η10 (Fig. S3b†) show lower overpotential (η10) and faster kinetics for 20 mol% Ni + Fe co-doped mesoporous CeO2, indicating superior OER performance. The OER activities were also comparable to other doped CeO2 based system listed in the Table 2. The Fig. 7c show the i–t results of Ni + Fe doped samples performed at 1.6 V and 1.7 V, respectively. After 20 h chronoamperometry measurement, a small change in current density was observed for both applied constant potential indicating excellent stability for this composition. Furthermore, the microstructure of the Ni + Fe co-doped CeO2 sample was investigated by TEM after the i–t tests carried out under HER and OER conditions for 20 hours at 10 mA cm−2 and 50 mA cm−2, respectively. The mesoporous like structure of Ni + Fe codoped CeO2 samples (Fig. S4†) was found to be remain similar to the original material (Fig. 3d) suggesting high stability of the electrode catalyst.
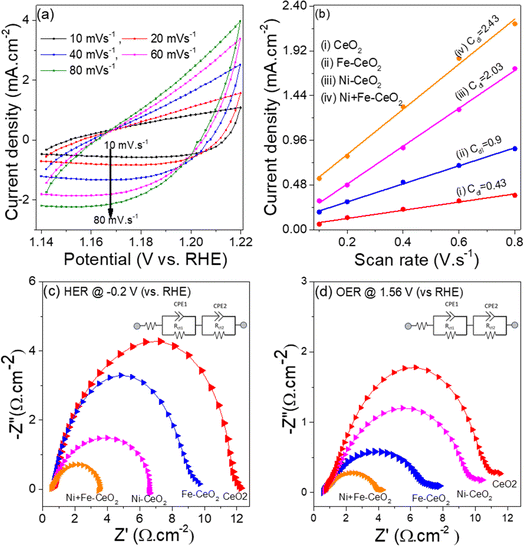
To understand the higher HER and OER activities of Ni + Fe doped CeO2 mesopores electrode, the electrochemically active surface area (EASA) depicting active sites for all catalysts was measured. The EASA was estimated by the formula (v)92
| EASA = Cdl/Cs; | (v) |
C s is the specific electrochemical double-layer capacitance of an atomically smooth planer surface. The value of Cs varies between 0.020 and 0.060 mF cm−2 in an alkaline medium, and here is taken as 0.04 mF cm−2.43Cdl, is the electrochemical double-layer capacitance, and the value of Cdl is obtained from the slope of the current density vs. scan rate obtained from CV plots collected in the non-faradic region (1.14–1.22 V vs. RHE) at various scan rates.93Fig. 8a and S5† show the CV plots of Ni + Fe doped CeO2 and other electrode catalysts collected at different scan rates. The current density vs. scan rates produces a straight line, and linear fit gives the slope value equal to Cdl (Fig. 8b). The calculated values of EASA for all catalysts are presented in Table 3. The EASA value of Ni + Fe doped sample was 60.8 cm2, which was highest among all the electrodes. The observation revealed that more active sites for mesopores feature were available for the electrochemical reaction, leading to superior HER and OER performance.
| Evaluated electrochemical properties such as η10, EASA, Rct | |||||
|---|---|---|---|---|---|
| Catalysts | HER (η10)a (mV) | OER (η10)a (mV) | EASA (cm2) | R ct (Ω cm−2) for HER | R ct (Ω cm−2) for OER |
| a Reported in mV vs. RHE. | |||||
| CeO2 | 198 | 470 | 10.6 | 11.5 | 10.7 |
| Ni-CeO2 | 123 | 450 | 50.7 | 6.0 | 9.6 |
| Fe-CeO2 | 157 | 420 | 22.5 | 9.1 | 6.9 |
| Ni + Fe-CeO 2 | 104 | 380 | 60.8 | 2.9 | 3.5 |
The charge transfers phenomenon occurring at the electrode/electrolyte interface is a key parameter to analyze the electrocatalytic performance of as-synthesized materials. The potentiostatic EIS analysis were performed in the frequency range 100 kHz to 0.1 Hz at the initial DC voltage −0.2 V vs. RHE and 1.56 V vs. RHE for HER and OER studies, respectively. The Nyquist plot depicted in the Fig. 8(c and d) consist of a small semicircle at high frequency regime (catalyst/nickel foam and between catalyst, Rct1) and larger semicircle at low frequency regime (interface of electrode and electrolyte, Rct2) at the applied DC voltage.17 The value of Rct2 at HER and OER kinetic for all the electrodes are generated by fitting the Nyquist plots with the equivalent circuit shown as inset in the Fig. 8c and d. The co-doped CeO2 have smallest Rct2 2.9 Ω cm−2 and 3.5 Ω cm−2 (Table 3) at HER and OER condition, suggesting faster charge-transfer and consequently a superior electrocatalytic performance for HER, and OER. The higher HER and OER activities of Ni + Fe CeO2 electrode compared to other prepared catalyst as well as literature suggest that co doped Ni, Fe could be a promising material to fulfil the future energy demand.
Conclusions
In summary, a sol–gel route was used to prepare pristine CeO2 and 20 mol% metal cation(s) Ni + Fe, Ni, and Fe doped CeO2 electrocatalysts. The presence of Ni + Fe co-dopant(s) altered the growth of CeO2 resulting in a mesoporous structure with greater number of electrochemically active sites. Co-doped samples were also associated with greater concentration of OV, a favourable condition for electrochemical water splitting reaction. The Ni + Fe co-doped CeO2 electrode demonstrated superior HER and OER bifunctional activities in 1 M KOH electrolytes and required only 104 mV and 380 mV overpotentials for HER and OER to afford a current density of 10 mA cm−2. The higher HER, and OER activities were the result of high electrochemical surface area (60.8) cm2 and low charge transfer resistance. This work illustrates the impact of Ni, Fe co-doping on the microstructure and point defect (oxygen vacancy) as a tool for materials design of electrocatalyst based hydrogen production.Data availability
Data included as part of the article ESI.† Additional data available upon reasonable request.Conflicts of interest
There are no conflicts to declare.Acknowledgements
The authors acknowledge support of the Center for Hierarchical Waste Form Materials, an Energy Frontier Research Center funded by the U.S. Department of Energy, Office of Science, Basic Energy Sciences (DE-SC0016574). A portion of this research using Raman spectroscopy was performed using funding received from the DOE Office of Nuclear Energy's Nuclear Energy University Program under Award Number DE-NE0009314.References
- M. S. Dresselhaus and I. L. Thomas, Nature, 2001, 414, 332–337 CrossRef CAS PubMed
.
- Z. W. Seh, J. Kibsgaard, C. F. Dickens, I. Chorkendorff, J. K. Nørskov and T. F. Jaramillo, Science, 2017, 355, 1–12 CrossRef PubMed
.
- J. Jiang, F. Sun, S. Zhou, W. Hu, H. Zhang, J. Dong, Z. Jiang, J. Zhao, J. Li, W. Yan and M. Wang, Nat. Commun., 2018, 9, 2885 CrossRef PubMed
.
- H. Sun, X. Xu, H. Kim, W. Jung, W. Zhou and Z. Shao, Energy Environ. Mater., 2023, 6, e12441 CrossRef CAS
.
- Y. Liu, X. Wang, M. Yang, Y. Li, Y. Xiao and J. Zhao, Nanoscale, 2023, 15, 17936–17945 RSC
.
- H. Sun, X. Xu, Y. Song, W. Zhou and Z. Shao, Adv. Funct. Mater., 2021, 31, 2009779 CrossRef CAS
.
- J. Wang, Y. Gao, H. Kong, J. Kim, S. Choi, F. Ciucci, Y. Hao, S. Yang, Z. Shao and J. Lim, Chem. Soc. Rev., 2020, 49, 9154–9196 RSC
.
- C. Wei, R. R. Rao, J. Peng, B. Huang, I. E. L. Stephens, M. Risch, Z. J. Xu and Y. Shao-Horn, Adv. Mater., 2019, 31, 1806296 CrossRef PubMed
.
- R. Bose, V. R. Jothi, K. Karuppasamy, A. Alfantazi and S. C. Yi, J. Mater. Chem. A, 2020, 8, 13795–13805 RSC
.
- B. You and Y. Sun, Acc. Chem. Res., 2018, 51, 1571–1580 CrossRef CAS PubMed
.
- Y. Li, Y. Sun, Y. Qin, W. Zhang, L. Wang, M. Luo, H. Yang and S. Guo, Adv. Energy Mater., 2020, 10, 1903120 CrossRef CAS
.
- H.-J. Liu, R.-N. Luan, L.-Y. Li, R.-Q. Lv, Y.-M. Chai and B. Dong, Chem. Eng. J., 2023, 461, 141714 CrossRef CAS
.
- Q. Shi, C. Zhu, D. Du and Y. Lin, Chem. Soc. Rev., 2019, 48, 3181–3192 RSC
.
- P. Zhai, Y. Zhang, Y. Wu, J. Gao, B. Zhang, S. Cao, Y. Zhang, Z. Li, L. Sun and J. Hou, Nat. Commun., 2020, 11, 5462 CrossRef CAS PubMed
.
- L. Ji, J. Wang, X. Teng, T. J. Meyer and Z. Chen, ACS Catal., 2020, 10, 412–419 CrossRef CAS
.
- X. Hu, Y. Gao, X. Luo, J. Xiong, P. Chen and B. Wang, Nanoscale, 2024, 16, 4909–4918 RSC
.
- L. Li, B. Wang, G. Zhang, G. Yang, T. Yang, S. Yang and S. Yang, Adv. Energy Mater., 2020, 10, 2001600 CrossRef CAS
.
- D. R. Ou, T. Mori, H. Togasaki, M. Takahashi, F. Ye and J. Drennan, Langmuir, 2011, 27, 3859–3866 CrossRef CAS PubMed
.
- N. Maheswari and G. Muralidharan, Dalton Trans., 2016, 45, 14352–14362 RSC
.
- H. T. Das, E. B. T, S. Dutta, N. Das, P. Das, A. Mondal and M. Imran, J. Energy Storage, 2022, 50, 104643 CrossRef
.
- B. Wang, B. Zhu, S. Yun, W. Zhang, C. Xia, M. Afzal, Y. Cai, Y. Liu, Y. Wang and H. Wang, NPG Asia Mater., 2019, 11, 51 CrossRef
.
- J. Y. Cheon, J. H. Kim, J. H. Kim, K. C. Goddeti, J. Y. Park and S. H. Joo, J. Am. Chem. Soc., 2014, 136, 8875–8878 CrossRef CAS PubMed
.
- Z. Chen, T. Ma, W. Wei, W.-Y. Wong, C. Zhao and B.-J. Ni, Adv. Mater., 2024, 2401568 CrossRef CAS PubMed
.
- Z.-H. Yang, S. Ren, Y. Zhuo, R. Yuan and Y.-Q. Chai, Anal. Chem., 2017, 89, 13349–13356 CrossRef CAS PubMed
.
- K. Cui, C. Zhou, B. Zhang, L. Zhang, Y. Liu, S. Hao, X. Tang, Y. Huang and J. Yu, ACS Appl. Mater. Interfaces, 2021, 13, 33937–33947 CrossRef CAS PubMed
.
- Y.-H. Zhou, S. Wang, Y. Wan, J. Liang, Y. Chen, S. Luo and C. Yong, J. Alloys Compd., 2017, 728, 902–909 CrossRef CAS
.
- M. Zhu, Y. Wen, L. Shi, Z. Tan, Y. Shen, K. Yin and L. Sun, Nanoscale, 2022, 14, 11963–11971 RSC
.
- H. Qi, C. Shi, X. Jiang, M. Teng, Z. Sun, Z. Huang, D. Pan, S. Liu and Z. Guo, Nanoscale, 2020, 12, 19112–19120 RSC
.
- Y. Wang, C. Meng, L. Zhao, J. Zhang, X. Chen and Y. Zhou, Chem. Commun., 2023, 59, 8644–8659 RSC
.
- D. A. Rakov, Energy Adv., 2023, 2, 235–251 RSC
.
- R. Wu, J. Xu, C.-L. Zhao, X.-Z. Su, X.-L. Zhang, Y.-R. Zheng, F.-Y. Yang, X.-S. Zheng, J.-F. Zhu, J. Luo, W.-X. Li, M.-R. Gao and S.-H. Yu, Nat. Commun., 2023, 14, 2306 CrossRef CAS PubMed
.
- C.-F. Li, J.-W. Zhao, L.-J. Xie, J.-Q. Wu and G.-R. Li, Appl. Catal., B, 2021, 291, 119987 CrossRef CAS
.
- W. Liu, P. Geng, S. Li, W. Liu, D. Fan, H. Lu, Z. Lu and Y. Liu, J. Energy Chem., 2021, 55, 17–24 CrossRef CAS
.
- R.-Y. Fan, J.-Y. Xie, H.-J. Liu, H.-Y. Wang, M.-X. Li, N. Yu, R.-N. Luan, Y.-M. Chai and B. Dong, Chem. Eng. J., 2022, 431, 134040 CrossRef CAS
.
- G. Hai, J. Huang, L. Cao, K. Kajiyoshi, L. Wang, L. Feng, Y. Liu and L. Pan, Dalton Trans., 2021, 50, 11604–11609 RSC
.
- N. Qadeer, N. Jabeen, L. U. Khan, M. Sohail, M. Zaheer, M. Vaqas, A. Kanwal, F. Sajid, S. Qamar and Z. Akhter, RSC Adv., 2022, 12, 15564–15574 RSC
.
- S. Colis, A. Bouaine, G. Schmerber, C. Ulhaq-Bouillet, A. Dinia, S. Choua and P. Turek, Phys. Chem. Chem. Phys., 2012, 14, 7256–7263 RSC
.
- V. D. Araújo, W. Avansi, H. B. de Carvalho, M. L. Moreira, E. Longo, C. Ribeiro and M. I. B. Bernardi, CrystEngComm, 2012, 14, 1150–1154 RSC
.
- P. Tamizhdurai, S. Sakthinathan, S.-M. Chen, K. Shanthi, S. Sivasanker and P. Sangeetha, Sci. Rep., 2017, 7, 46372 CrossRef CAS PubMed
.
- K. Polychronopoulou, A. A. AlKhoori, A. M. Efstathiou, M. A. Jaoude, C. M. Damaskinos, M. A. Baker, A. Almutawa, D. H. Anjum, M. A. Vasiliades, A. Belabbes, L. F. Vega, A. F. Zedan and S. J. Hinder, ACS Appl. Mater. Interfaces, 2021, 13, 22391–22415 CrossRef CAS PubMed
.
- P. Venkataswamy, D. Jampaiah, A. E. Kandjani, Y. M. Sabri, B. M. Reddy and M. Vithal, Res. Chem. Intermed., 2018, 44, 2523–2543 CrossRef CAS
.
- W. Zhan, S. Yang, P. Zhang, Y. Guo, G. Lu, M. F. Chisholm and S. Dai, Chem. Mater., 2017, 29, 7323–7329 CrossRef CAS
.
- C. C. L. McCrory, S. Jung, J. C. Peters and T. F. Jaramillo, J. Am. Chem. Soc., 2013, 135, 16977 CrossRef CAS PubMed
.
- T. Mathew, K. Sivaranjani, E. S. Gnanakumar, Y. Yamada, T. Kobayashi and C. S. Gopinath, J. Mater. Chem., 2012, 22, 13484–13493 RSC
.
- S. Niu, S. Li, Y. Du, X. Han and P. Xu, ACS Energy Lett., 2020, 5, 1083–1087 CrossRef CAS
.
- Y. Wang, G. Qian, Q. Xu, H. Zhang, F. Shen, L. Luo and S. Yin, Appl. Catal., B, 2021, 286, 119881 CrossRef CAS
.
- M. Xiao, D. Han, X. Yang, N. Tsona Tchinda, L. Du, Y. Guo, Y. Wei, X. Yu and M. Ge, Appl. Catal., B, 2023, 323, 122173 CrossRef CAS
.
- X. Mei, X. Zhao, Y. Chen, B. Deng, Q. Geng, Y. Cao, Y. Li and F. Dong, ACS Sustain. Chem. Eng., 2023, 11, 15609–15619 CrossRef CAS
.
- X. Xu, L. Liu, Y. Tong, X. Fang, J. Xu, D. Jiang and X. Wang, ACS Catal., 2021, 11, 5762–5775 CrossRef CAS
.
- B. Liu, B. Liu, Q. Li, Z. Li, M. Yao, R. Liu, X. Zou, H. Lv, W. Wu, W. Cui, Z. Liu, D. Li, B. Zou, T. Cui and G. Zou, Phys. Status Solidi, 2011, 248, 1154–1157 CrossRef CAS
.
- R. Murugan, G. Ravi, G. Vijayaprasath, S. Rajendran, M. Thaiyan, M. Nallappan, M. Gopalan and Y. Hayakawa, Phys. Chem. Chem. Phys., 2017, 19, 4396–4404 RSC
.
- Z. Zou, T. Zhang, L. Lv, W. Tang, G. Zhang, R. K. Gupta, Y. Wang and S. Tang, ACS Sustain. Chem. Eng., 2023, 11, 7443–7453 CrossRef CAS
.
- K. Brinkman, E. B. Fox, P. Korinko, R. Lascola, Q. Liu and F. Chen, MRS Online Proc. Libr., 2010, 1256, 1230–1256 Search PubMed
.
- B. Liu, C. Li, G. Zhang, L. Yan and Z. Li, New J. Chem., 2017, 41, 12231–12240 RSC
.
- L. Minervini, M. O. Zacate and R. W. Grimes, Solid State Ionics, 1999, 116, 339–349 CrossRef CAS
.
-
W. D. Kingery, H. K. Bowen and D. R. Uhlmann, Introduction to Ceramics, John wiley & sons, 1976, vol. 17 Search PubMed
.
- O. H. Laguna, M. A. Centeno, M. Boutonnet and J. A. Odriozola, Appl. Catal., B, 2011, 106, 621–629 CrossRef CAS
.
- G. Li, R. L. Smith and H. Inomata, J. Am. Chem. Soc., 2001, 123, 11091–11092 CrossRef CAS PubMed
.
- C. Liang, Z. Ma, H. Lin, L. Ding, J. Qiu, W. Frandsen and D. Su, J. Mater. Chem., 2009, 19, 1417–1424 RSC
.
- D. Jampaiah, T. Srinivasa Reddy, A. E. Kandjani, P. R. Selvakannan, Y. M. Sabri, V. E. Coyle, R. Shukla and S. K. Bhargava, J. Mater. Chem. B, 2016, 4, 3874–3885 RSC
.
- H. Wang and G. Tsilomelekis, Catal. Sci. Technol., 2020, 10, 4362–4372 RSC
.
- X. Chen, S. Zhan, D. Chen, C. He, S. Tian and Y. Xiong, Appl. Catal., B, 2021, 286, 119928 CrossRef CAS
.
- L. Zhang, Y. Jiang, K. Zhu, N. Shi, Z. U. Rehman, R. Peng and C. Xia, Small Methods, 2024, 2301686 CrossRef PubMed
.
- H. Bao, X. Chen, J. Fang, Z. Jiang and W. Huang, Catal. Lett., 2008, 125, 160–167 CrossRef CAS
.
- P. S. Murphin Kumar, S. Thiripuranthagan, T. Imai, G. Kumar, A. Pugazhendhi, S. R. Vijayan, R. Esparza, H. Abe and S. K. Krishnan, ACS Sustain. Chem. Eng., 2017, 5, 11290–11299 CrossRef CAS
.
- C. Yang, F. Bebensee, J. Chen, X. Yu, A. Nefedov and C. Wöll, ChemPhysChem, 2017, 18, 1874–1880 CrossRef CAS PubMed
.
- Q. Sun, Y. Liu, X. Li, X. Guo, W.-H. Huang, Y. Zhu, Z. Wang, C.-C. Chueh, C.-L. Chen, Y.-K. Peng and Z. Zhu, Energy Fuels, 2023, 37, 9434–9443 CrossRef CAS
.
- S. Kato, M. Ammann, T. Huthwelker, C. Paun, M. Lampimäki, M.-T. Lee, M. Rothensteiner and J. A. van Bokhoven, Phys. Chem. Chem. Phys., 2015, 17, 5078–5083 RSC
.
- C. Yang, F. Bebensee, J. Chen, X. Yu, A. Nefedov and C. Wöll, ChemPhysChem, 2017, 18, 1957 CrossRef
.
- M. Cheng, H. Fan, Y. Song, Y. Cui and R. Wang, Dalton Trans., 2017, 46, 9201–9209 RSC
.
- A. Punnoose, K. Dodge, J. J. Beltrán, K. M. Reddy, N. Franco, J. Chess, J. Eixenberger and C. A. Barrero, J. Appl. Phys., 2014, 115, 17B534 CrossRef
.
- Y. Xue, L. Hui, H. Yu, Y. Liu, Y. Fang, B. Huang, Y. Zhao, Z. Li and Y. Li, Nat. Commun., 2019, 10, 2281 CrossRef PubMed
.
- M.-C. Sung, G.-H. Lee and D.-W. Kim, J. Alloys Compd., 2019, 800, 450–455 CrossRef CAS
.
- L. Zhou, P. He, T. Yang, S. Chen, Q. He, F. Dong, L. Jia, H. Zhang, B. Jia and X. He, Int. J. Hydrogen Energy, 2020, 45, 28682–28695 CrossRef CAS
.
- J. Rashid, N. Parveen, T. ul Haq, A. Iqbal, S. H. Talib, S. U. Awan, N. Hussain and M. Zaheer, ChemCatChem, 2018, 10, 5587–5592 CrossRef CAS
.
- S. Swathi, R. Yuvakkumar, P. Senthil Kumar, G. Ravi, M. Thambidurai, C. Dang and D. Velauthapillai, Fuel, 2022, 310, 122319 CrossRef CAS
.
- Q. Zhou, S. Liu, Y. Zhang, Z. Zhu, W. Su and M. Sheng, Ceram. Int., 2020, 46, 20871–20877 CrossRef CAS
.
- L. Gui, Z. Wang, K. Zhang, B. He, Y. Liu, W. Zhou, J. Xu, Q. Wang and L. Zhao, Appl. Catal., B, 2020, 266, 118656 CrossRef CAS
.
- L. Tian, H. Liu, B. Zhang, Y. Liu, S. Lv, L. Pang and J. Li, ACS Appl. Nano Mater., 2022, 5, 1252–1262 CrossRef CAS
.
- L. Tian, H. Liu, X. Yi, X. Wang, L. Pang and J. Li, Int. J. Hydrogen Energy, 2023, 48, 23831–23841 CrossRef CAS
.
- Y. Yu, Y. Liu, X. Peng, X. Liu, Y. Xing and S. Xing, Sustainable Energy Fuels, 2020, 4, 5156–5164 RSC
.
- Y.-N. Zhou, Y.-W. Dong, Y. Wu, B. Dong, H.-J. Liu, X.-J. Zhai, G.-Q. Han, D.-P. Liu and Y.-M. Chai, Chem. Eng. J., 2023, 463, 142380 CrossRef CAS
.
- C. Hu, L. Zhang and J. Gong, Energy Environ. Sci., 2019, 12, 2620–2645 RSC
.
- H. Lin, W. Zhang, Z. Shi, M. Che, X. Yu, Y. Tang and Q. Gao, ChemSusChem, 2017, 10, 2597–2604 CrossRef CAS PubMed
.
- M. Ji, W. Yaseen, H. Mao, C. Xia, Y. Xu, S. Meng, J. Xie and M. Xie, Inorg. Chem., 2023, 62, 12383–12391 CrossRef CAS PubMed
.
- E. Demir, S. Akbayrak, A. M. Önal and S. Özkar, J. Colloid Interface Sci., 2019, 534, 704–710 CrossRef CAS PubMed
.
- Y. Yu, X. Peng, U. Ali, X. Liu, Y. Xing and S. Xing, Inorg. Chem. Front., 2019, 6, 3255–3263 RSC
.
- D. Ghosh and D. Pradhan, Langmuir, 2023, 39, 3358–3370 CrossRef CAS PubMed
.
- Y. Tuo, X. Wang, C. Chen, X. Feng, Z. Liu, Y. Zhou and J. Zhang, Electrochim. Acta, 2020, 335, 135682 CrossRef CAS
.
- S. Paladugu, I. M. Abdullahi, H. Singh, S. Spinuzzi, M. Nath and K. Page, ACS Appl. Mater. Interfaces, 2024, 16, 7014–7025 CrossRef CAS PubMed
.
- J. Yu, J. Wang, X. Long, L. Chen, Q. Cao, J. Wang, C. Qiu, J. Lim and S. Yang, Adv. Energy Mater., 2021, 11, 2002731 CrossRef CAS
.
- N. K. Shrestha, S. A. Patil, J. Han, S. Cho, A. I. Inamdar, H. Kim and H. Im, J. Mater. Chem. A, 2022, 10, 8989–9000 RSC
.
- Y.-N. Zhou, W.-L. Yu, Y.-N. Cao, J. Zhao, B. Dong, Y. Ma, F.-L. Wang, R.-Y. Fan, Y.-L. Zhou and Y.-M. Chai, Appl. Catal., B, 2021, 292, 120150 CrossRef CAS
.
Footnote |
| † Electronic supplementary information (ESI) available. See DOI: https://doi.org/10.1039/d4na00500g |
| This journal is © The Royal Society of Chemistry 2024 |

