Assessing the overflowing pile-up effect on the photoluminescence lifetime of nanomaterials†
Shagun
Sharma
 ,
Aditya
Yadav
 ,
Kush
Kaushik
 ,
Abdul
Salam
 and
Chayan Kanti
Nandi
 *
*
School of Chemical Sciences, Indian Institute of Technology (I.I.T.) Mandi, H.P-175075, India. E-mail: chayan@iitmandi.ac.in
First published on 30th August 2024
Abstract
The tunable complex emissive states with nanosecond to microsecond lifetimes in nanomaterials, arise due to their structural heterogeneity, enabling them with a wide range of advanced optoelectronic applications. However, understanding the complex photoluminescence lifetime in these nanomaterials is critically challenged by the overflowing pile-up effect, which occurs due to the high repetition rate of the light source in the time-correlated single photon counting (TCSPC) technique. Here, we provide a quantitative lifetime analysis, especially in metal nanoclusters, metal complexes, and semiconductor quantum dots, which suggests that the same experimental parameters can mislead the lifetime data interpretation for long-ranged luminescent nanomaterials. We demonstrate that the overflowing pile-up effect could be fatal while analyzing the excited state lifetime. Furthermore, we provide the optimized parameters that could be used to get the actual lifetime data of samples. We hope that our findings will be crucial in obtaining the error-free and accurate excited state dynamics of these long-range lifetime nanomaterials.
Introduction
Luminescent nanomaterials offer a plethora of applications due to their ability to tune optical properties across multiple dimensions like fluorescence, color, intensity, and lifetime.1–4 Specifically, their capacity to exhibit excited state dynamics ranging from nanoseconds to milliseconds is precious for emerging technologies and industries.5–7 A variety of materials including semiconductor quantum dots, metal nanoclusters, carbon dots, and upconversion nanocrystals with their tunable luminescence properties can be utilized across a broad range of applications such as anti-counterfeiting, security, data storage, light emitting diodes (LEDs), sensors, time-resolved luminescence bioimaging, biosensing, and lifetime-based multiplexed encoding.8–12 Time-resolved techniques, especially time-correlated single photon counting (TCSPC), are widely used to characterize the excited state lifetime due to its high temporal resolution.13,14It is worth mentioning that such diverse excited state lifetimes in these nanomaterials arise due to their heterogeneous structures (e.g., different core and surface structures, grain boundaries, or chemical environments), which finally lead to complex photoluminescence decay behavior involving both short- and long-lived emissive states.15–18 When the decay spans a wide time range, achieving an accurate fit requires meticulous optimization of measurement parameters such as the repetition rate of a laser beam, time resolution, pulse separation (PS) and acquisition time. In TCSPC, the dyes and materials with nanosecond lifetime decay completely, making lifetime analysis much easier and less dependent on parameter adjustments. However, for long-lived nanomaterials, the lifetime analysis needs an intelligent approach in measurement parameters for the complete lifetime decay to occur. Several literature reports have shown different lifetime values of the same material due to discrepancies in the measurement parameters. For instance, bovine serum albumin-protected gold nanoclusters with 25 gold atoms (BSA-Au25 NCs) have shown different lifetimes pertaining to misinterpretation of decay analysis. Some reports have shown BSA-Au NCs with emission on the nanosecond scale,19,20 while other reports have shown microsecond lifetimes.21,22 Similarly, BSA-protected copper nanoclusters (BSA-Cu NCs)18,23 and arginine-coated 6-Aza-2-thiothymine-protected AuNCs (Arg-ATT-AuNCs)24–28 also have shown ambiguity in the lifetime measurement. The inconsistency arises due to the inappropriate repetition rates and time resolution, causing incomplete decay of the long-lived materials. When the sample is re-excited before it fully decays during the measurement of longer-lived decays, multiple photons accumulate in successive windows, creating what is known as the overflowing pile-up effect. Following this effect, photons from the nth laser excitation are wrongly detected as coming from the (n + 1)th laser excitation. This effect results in a distorted histogram, leading to misinterpretations during data analysis. Hence, optimization of the repetition rate, time resolution and acquisition time should be critically assessed while dealing with these materials.
The present study aims to provide a quantitative approach for the accurate lifetime analysis of the nanomaterials, with particular emphasis on metal nanoclusters [BSA-Au NCs,29 BSA-Ag NCs,30 and BSA-Cu NCs23] along with several other fluorescent nanomaterials such as zinc metal complexes31 and CdTe quantum dots32 with their diverse lifetimes spanning from nanoseconds to microseconds. Our data suggest that the same experimental parameters can highly mislead the lifetime data interpretation. We used Cyanine 5 dye, which has a very short lifetime of a few nanoseconds, to show that materials with a similar short lifetime provide consistent results under every condition. Conversely, materials with lifetimes in the microsecond range provide erroneous results. We also provided the optimized parameters that could be used to get the actual lifetime data and showed that the repetition rate, time bins and acquisition time play significant roles in obtaining the accurate lifetime of nanomaterials. We anticipate that our data will be beneficial for understanding the photoluminescence lifetime analysis of nanomaterials whose long-range lifetimes are utilized for a diverse range of applications.
Results and discussion
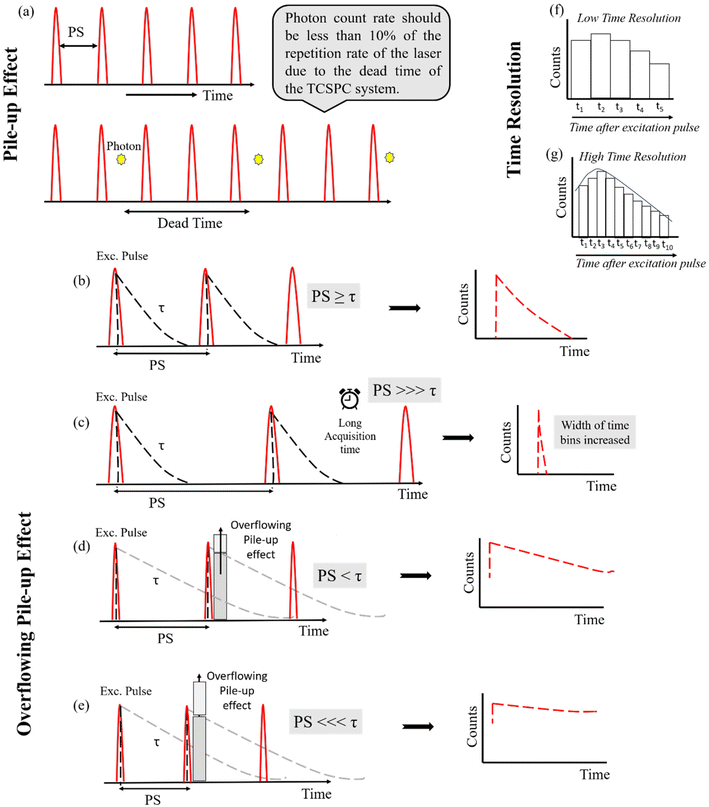
TCSPC is a digital technique that calculates a single photon's arrival time following the excitation of a sample with a laser pulse. The start is triggered by the excitation pulse, which is then stopped by a single photon striking the detector. The time difference between the start and stop signal is converted into a histogram of time bins of fixed time width Δt. In TCSPC, we repeatedly measure this “start–stop” difference from successive excitation collection cycles.33 The histograms formed indicate the presence of one or more decay pathways. TCSPC enables lifetime decay acquisition with high temporal resolution, and thousands of photons are acquired for accurate lifetime decay curve presentation. Despite its advantages, the TCSPC system encounters a limitation that impacts lifetime measurements. The TCSPC electronics operate in a manner that permits the detection of only a single photon per excitation cycle.34,35 The detector usually has a dead time on the order of several tens of nanoseconds, during which the system is busy with data processing and cannot detect any other photon. Consequently, if multiple photons are emitted in a single excitation cycle, the detector fails to register them, a phenomenon referred to as the classical pile-up effect of TCSPC.36 This causes a statistical overrepresentation of the early photons, distorting the decay shape. To avoid this, the measured photon count rate should be less than 10% of the laser repetition rate (Fig. 1a). Researchers have tried to avoid this artifact by introducing other setups rather than TCSPC.34,37 Very recently, Hwang et al.38 have provided an ultimate solution for the TCSPC implementation for high photon count rates by introducing digital TCSPC combined with the hybrid photodetector.In addition to the classical pile-up effect in TCSPC, incomplete fluorescence decay is the emerging issue which usually occurs in the microsecond lifetime estimation. Specifically, for materials showing multiple lifetimes across the nanosecond and microsecond range, the choice of measurement parameters such as the repetition rate of a laser beam, time resolution, PS and acquisition time range needs to be considered.
The repetition rate or the PS, which is the interval between consecutive pulses, play a critical role in TCSPC. The relationship between PS and the lifetime of the material is significant in determining the accurate lifetime and the decay shape. The comparable PS and the lifetime of the material yield an appropriate lifetime decay curve, causing complete decay (Fig. 1b). Conversely, in cases where the PS significantly exceeds the material's lifetime (Fig. 1c), the short-lived photons arrived in the initial time bins, impacting the decay curve's fitting. Also, the long acquisition time led to the unnecessary photobleaching of the materials emitted in the short time range.
Interestingly, if the lifetime exceeds the PS, the fluorescence would not completely decay in the defined time window. As a result, photons will overflow into the successive time window. This overflow lifts the decay curve, causing the measured lifetime to be shorter than the actual lifetime of the material, proposed as the overflowing pile-up effect. This effect is schematically illustrated in Fig. 1d and e. Additionally, the lifting of the decay curve can be due to interference from dark counts entering the detector, which adds an offset to the long-lifetime component during microsecond lifetime measurements. The dark counts contribute to the background photons, distorting the decay curve.
In TCSPC, the elapsed time between sample excitation (by a pulsed light source) and the arrival of emitted photons is coverted to histogram. The histograms consist of a time bin of fixed Δt. The smaller the width of the time bins, the better the time resolution. The larger time bins correspond to the low resolution and fewer histogram points for fitting the decay curve (Fig. 1f), whereas smaller time bins correspond to the high resolution (Fig. 1g) and more histograms point to appropriate fitting. The high time resolution and histogram points better fit the lifetime data. It is crucial to know the trade-off between the resolution and the data collection time, the fewer the number of points, the faster the data collection times. For materials and dyes emitting in the nanosecond range, high time resolution (smaller time bins) is preferred to get a shorter lifetime with minimal error in the fitting parameters. In contrast, low time resolution is needed to observe the long lifetime component in the decay curve.
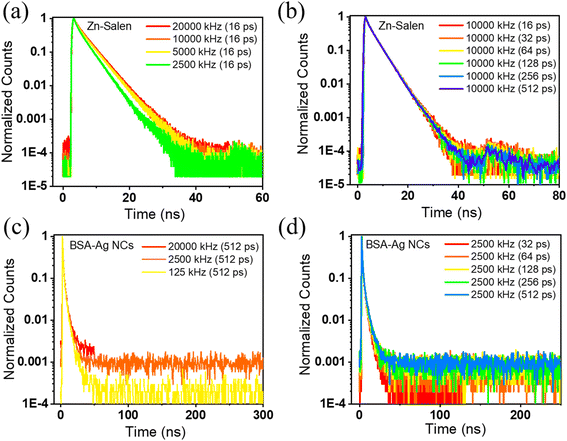
To demonstrate the effect of repetition rate and the time resolution on the accurate measurement of lifetime decay and to provide a systematic, comprehensive understanding of the parameters that are routinely used in lifetime measurements, we have taken various samples with their different excited state lifetimes ranging from nanoseconds to microseconds. The details of the synthesis, characterization, and steady state optical properties such as excitation and emission spectra are presented in Fig. 2. From the steady state measurements, it is deciphered that either 400 nm or 488 nm pulsed laser can be used as the excitation source for the lifetime measurement. We evaluated the lifetime of Cyanine 5 along with several other metal-based materials, including the Zn–salen complex and BSA-Ag NCs. These materials exhibited lifetimes in the range of a few nanoseconds. The lifetime is calculated by modulating the time resolution and repetition rate independently while maintaining consistency in the other parameters. In addition to the repetition rate, the photon count rate is shown to ensure that pile-up effects do not interfere with the overflowing pile-up effect. The lifetime decay of Zn–Salen is investigated by giving the PS from 50 ns to 400 ns and the repetition rate from 20![[thin space (1/6-em)]](https://www.rsc.org/images/entities/char_2009.gif) 000 kHz to 2500 kHz (Table 1). It could be seen from the table that on decreasing the repetition rate from 20
000 kHz to 2500 kHz (Table 1). It could be seen from the table that on decreasing the repetition rate from 20![[thin space (1/6-em)]](https://www.rsc.org/images/entities/char_2009.gif) 000 kHz to 2500 kHz, keeping the time resolution same at 16 ps, no significant changes in the lifetime (3.5 ns to 3.0 ns) were observed. This is exemplified by the normalized decay curves, which remain consistent irrespective of repetition rate alterations (Fig. 3a).
000 kHz to 2500 kHz, keeping the time resolution same at 16 ps, no significant changes in the lifetime (3.5 ns to 3.0 ns) were observed. This is exemplified by the normalized decay curves, which remain consistent irrespective of repetition rate alterations (Fig. 3a).
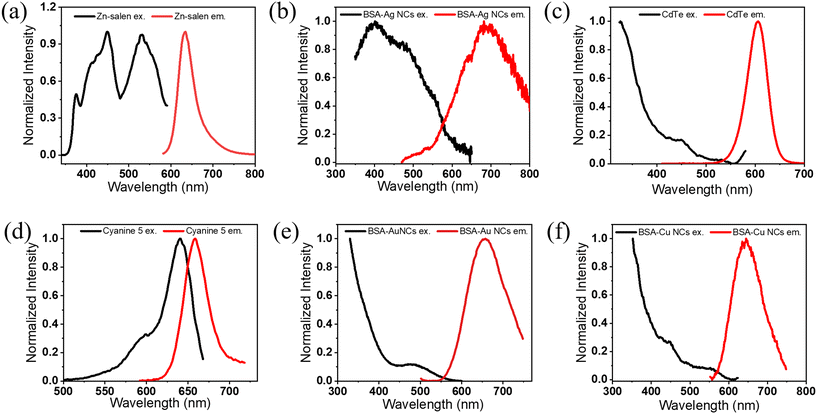 | ||
| Fig. 2 The fluorescence excitation and emission spectra of (a) the Zn–salen complex, (b) BSA-Ag NCs, (c) CdTe quantum dots, (d) Cyanine 5, (e) BSA-Au NCs and (f) BSA-Cu NCs. | ||
| S. No. | τ i (ns) | A i (%) | τ av (ns) | Time resolution | Repetition rate (kHz) | Pulse separation | Photon count rate | ||||
|---|---|---|---|---|---|---|---|---|---|---|---|
| τ 1 | τ 2 | τ 3 | A 1 | A 2 | A 3 | ||||||
| 1 | 4.5 | 0.7 | 3.3 | 22.5 | 5.2 | 72 | 3.5 | 16 ps | 20![[thin space (1/6-em)]](https://www.rsc.org/images/entities/char_2009.gif) 000 000 |
50 ns | 60 Hz |
| 2 | 3.4 | 0.7 | 5.1 | 83 | 6 | 10 | 3.4 | 16 ps | 10![[thin space (1/6-em)]](https://www.rsc.org/images/entities/char_2009.gif) 000 000 |
100 ns | 30 Hz |
| 3 | 3.4 | 0.7 | 5.3 | 85 | 7 | 8 | 3.4 | 16 ps | 5000 | 200 ns | 60 Hz |
| 4 | 3 | 0.7 | 9 | 88 | 10.5 | 1.4 | 3.0 | 16 ps | 2500 | 400 ns | 70 Hz |
When the time resolution is varied by keeping the repetition rate at 10![[thin space (1/6-em)]](https://www.rsc.org/images/entities/char_2009.gif) 000 kHz, the average lifetime remains constant at 3.4 ns, signifying that the lifetime of Zn–salen is independent of the time resolution (Table S1†). Also, this can be seen by the decay curves shown in Fig. 3b where no change is seen with the change in the time resolution. Furthermore, lifetime measurements were carried out for BSA-Ag NCs, where the time resolution and repetition rates varied. In either case, no significant changes in the lifetime were observed in BSA-Ag NCs (Tables S2 and S3†). When the measurements are performed with the same time resolution of 512 ps but at different repetition rates, the average lifetime is negligibly changed from 2.31 ns to 2.4 ns (Table S2†). Also, the normalized decay curves of BSA-Ag NCs measured with varying repetition rates and the same time resolution (Fig. 3c) depict similar decays in the time range up to 50 ns. The changes in the curves originated after the complete decay in the low amplitude region, which does not affect the average lifetime significantly. The lifetime of BSA-Ag NCs is also calculated by varying the time resolution from 512 ps to 32 ps, keeping the same repetition rate of 2500 kHz. Despite this range, the average lifetime value exhibited a marginal shift from 2.20 to 2.24 ns (Table S3†). The minimal impact of time resolution on the determined lifetime values is also demonstrated by the normalized decay curves shown in Fig. 3d. From the above observations, it can be inferred that the emission in the nanosecond time range can be statistically analyzed using high repetition rate excitation sources and has not noticeably changed with the variation in the repetition rate.
000 kHz, the average lifetime remains constant at 3.4 ns, signifying that the lifetime of Zn–salen is independent of the time resolution (Table S1†). Also, this can be seen by the decay curves shown in Fig. 3b where no change is seen with the change in the time resolution. Furthermore, lifetime measurements were carried out for BSA-Ag NCs, where the time resolution and repetition rates varied. In either case, no significant changes in the lifetime were observed in BSA-Ag NCs (Tables S2 and S3†). When the measurements are performed with the same time resolution of 512 ps but at different repetition rates, the average lifetime is negligibly changed from 2.31 ns to 2.4 ns (Table S2†). Also, the normalized decay curves of BSA-Ag NCs measured with varying repetition rates and the same time resolution (Fig. 3c) depict similar decays in the time range up to 50 ns. The changes in the curves originated after the complete decay in the low amplitude region, which does not affect the average lifetime significantly. The lifetime of BSA-Ag NCs is also calculated by varying the time resolution from 512 ps to 32 ps, keeping the same repetition rate of 2500 kHz. Despite this range, the average lifetime value exhibited a marginal shift from 2.20 to 2.24 ns (Table S3†). The minimal impact of time resolution on the determined lifetime values is also demonstrated by the normalized decay curves shown in Fig. 3d. From the above observations, it can be inferred that the emission in the nanosecond time range can be statistically analyzed using high repetition rate excitation sources and has not noticeably changed with the variation in the repetition rate.
Furthermore, the time resolution has minimal impact on the measured lifetime values. As a reference sample, we also measured the lifetime of the standard dye Cyanine 5 by adjusting acquisition parameters. A noteworthy finding with Cyanine 5 is that the data are unsuitable for fitting with low time resolution or larger time bins. However, smaller time bins render the data suitable for fitting, as discussed in the preceding section. Also, the average lifetime remained the same with changes in the time resolution (keeping the repetition rate the same) (Fig. S1 and Table S4†).
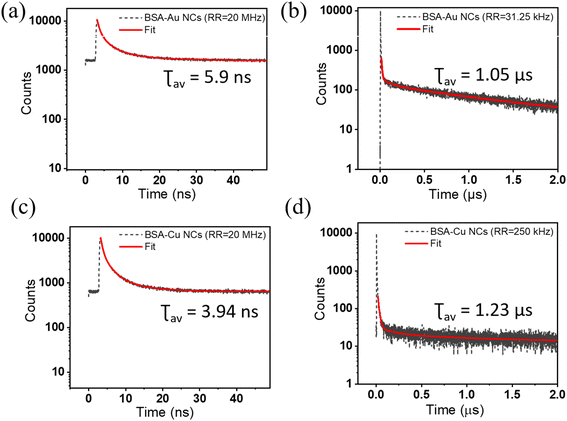
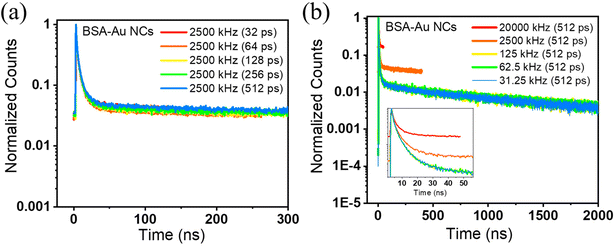
Intriguingly, the decays on the microsecond timescale reveal a different story regarding the measurement parameters. The estimation of nanosecond and microsecond lifetimes will require the fine-tuning of the system configuration. By dealing with different microsecond emitters, we investigated how the choice of acquisition parameters will affect the accurate lifetime value. BSA-Au NCs and BSA-Cu NCs are the two systems that show a microsecond lifetime. For BSA-Au NCs, a higher repetition rate of 20 MHz yields an average lifetime of 5.9 ns where the decay seems to be completed (Fig. 4a). The average lifetime of 1.03 μs is measured from a repetition rate of 31.25 kHz (Fig. 4b). The shape of the decay curves varies while measuring the fluorescence lifetime decay at two extreme repetition rates. This can be explained by considering the decay behavior in high and low repetition rates. At a high repetition rate of 20 MHz, the fluorescence would not completely decay in the defined time window. The overflow of the photons into successive time windows will lift the decay curve, as shown in Fig. 4a. At an optimized repetition rate, the time window between two pulses will be such that the fluorescence has already decayed before the beginning of another pulse (Fig. 4b). Therefore, the optimization of the acquisition parameters is essential to avoid erroneous lifetime results. To optimize measurement parameters, we conducted lifetime measurements of BSA-Au NCs by interplaying among the time resolution (width of time bin) and repetition rate. First, we played with the time resolution or the width of the time bin and calculated the lifetime with the amplitude values (Table S5†). While maintaining a repetition rate of 2500 kHz and a PS of 400 ns, the width of the time bin is decreased from 512 ps to 32 ps. As smaller time bins and higher time resolution are employed, the average lifetime of BSA-Au NCs decreases and shows varying values with each change. These changes are also shown in the normalized decay curves obtained after varying the time resolution, keeping the repetition rate the same at 2500 kHz (Fig. 5a). The spectra are lifted due to incomplete decay within the provided PS. As the decay curve extends into the higher amplitude region, even slight alterations in its shape will influence the average lifetime. The above measurements show that the time resolution is compromised to observe long-lifetime components moving from nanosecond to microsecond lifetime. Also, the fluctuation of an average lifetime with varying measurement parameters tell us about the short and long-lifetime presence in BSA-Au NCs. Still, the conclusion is unclear, as the time resolution varies, and the material has not shown its accurate lifetime. Moving forward, we have changed the repetition rate from 20 MHz to 31.25 kHz during the lifetime measurement, keeping the time bin width as 512 ps (Table 2). Interestingly, the average lifetime value of BSA-Au NCs increases with a decrease in the repetition rate of the excitation pulse. In Fig. 5b, the normalized decay curves demonstrate that a lower repetition rate of 31.25 kHz results in complete decay. For BSA-Au NCs, the optimized repetition rate is less than equal to 50 kHz. The 50 kHz is selected as the optimized rate as 50 kHz will yield similar lifetime results to that from 31.25 kHz (Fig. S2a†). To further demonstrate the significance of acquisition parameters in the lifetime analysis of other nanoclusters showing nanosecond lifetime, we analyzed ATT-AuNCs (reported by Deng et al.24). The steady-state luminescence spectra of ATT-Au NCs are shown in Fig. S3.† The cluster is being evaluated for its lifetime by varying the measurement parameters. The lifetime of ATT-Au NCs (shorter lifetime) is not influenced by either the time resolution or repetition rate (Tables S6 and S7†).
| S. No. | τ i (ns) | A i (%) | τ av (ns) | Time resolution | Repetition rate (kHz) | Pulse separation | Photon count rate | ||||
|---|---|---|---|---|---|---|---|---|---|---|---|
| τ 1 | τ 2 | τ 3 | A 1 | A 2 | A 3 | ||||||
| 1 | 15 | 3.4 | 0.8 | 39 | 48 | 13 | 7.5 | 512 ps | 20![[thin space (1/6-em)]](https://www.rsc.org/images/entities/char_2009.gif) 000 000 |
50 ns | 52 Hz |
| 2 | 253 | 6.9 | 1.6 | 62.8 | 24.2 | 12.8 | 162 | 512 ps | 2500 | 400 ns | 13 kHz |
| 3 | 854 | 11 | 2.3 | 80.4 | 9.0 | 10.5 | 686 | 512 ps | 125 | 8 μs | 2170 Hz |
| 4 | 809 | 8.4 | 1.6 | 79.4 | 12.3 | 8.4 | 646 | 512 ps | 62.5 | 16 μs | 1880 Hz |
| 5 | 1123 | 106 | 8.3 | 93.8 | 3.51 | 2.60 | 1056 | 512 ps | 31.25 | 32 μs | 1500 Hz |
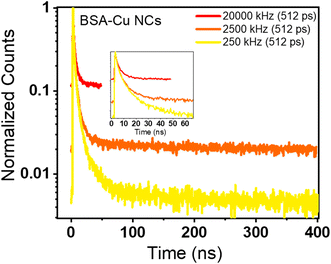
We have also evaluated the fluorescence decay of BSA-Cu NCs emitting on a microsecond timescale. From Table S8†, it is deciphered that on varying the parameters, the lifetime values are significantly changed from 5 ns to 1.23 μs. In particular, if we evaluate the decay curve at two extreme repetition rates, we can see the change in the shape of the decay curve (Fig. 4c and d). As observed in BSA-Au NCs, the lifetime decay curve is lifted in case of high repetition rate (20 MHz) measurement, while it is completely decayed within the time window at a low repetition rate (250 kHz). The normalized decay curves depicted in Fig. 6 illustrate how the repetition rate impacts the lifetime decay shape of BSA-Cu NCs. The measurement from the repetition rate of 50 kHz yields a similar average lifetime of 1.52 μs (Fig. S2b†). Based on these observations, we concluded that misinterpretation in the acquisition parameters during the measurement of materials with long lifetimes can significantly modify the results.
This mostly happened in the case of nanoclusters, which showed both nanosecond and microsecond lifetimes. Apart from the nanosecond and microsecond range, there are some materials which show a lifetime between few nanoseconds to a microsecond timescale. The decay characteristics of these materials resemble those of the microsecond range materials. The CdTe quantum dots display a lifetime of 30 ns to 59 ns when the repetition rate changes from 20 MHz to 31.25 kHz, respectively (Tables S9 and S10†). Table S9† shows that changing the time resolution from 512 ps to 32 ps and keeping the PS same at 400 ns changes the average lifetime from 46 ns to 35 ns. This significant change prompts us to calculate the lifetime at different repetition rates which is illustrated in Table S10.† The lifetime decay curve at two extremes is shown in Fig. S4a and S4b.† The figure demonstrates that the high repetition rate is not accurate for the measurement of the CdTe quantum dots. The spectra are highly lifted due to wrap-around of the photons from the previous time bin. In the case of a low repetition rate, the fluorescence is completely decayed within the time window and a lifetime of 59 ns is optimally accurate. An interesting point is that, even at the same repetition rate, the time resolution has a major role in data fitting. At low time resolution, where the width of the time bin is high, some information has been lost during acquisition. For instance, at the same repetition rate of 2.5 kHz, the fitting error is decreased with the increase in the time resolution in CdTe quantum dots. For instance, by increasing the time resolution from 512 ps to 64 ps, the fitting error was changed from 0.49 to 0.15 (from Table S11†). Based on our data, we propose the optimized parameters to accurately determine the lifetime of nanomaterials, which ranges from nanoseconds to microseconds (Table S12†). The table shows that to determine shorter decays, one should use the high repetition rate and shorter time bins (high time resolution). However, as the lifetime approaches the microsecond regime, a low repetition rate and low time resolution become necessary for observing the long lifetime component.
Conclusion
In summary, we correlated the determination of nanosecond and microsecond lifetimes with the measurement parameters utilized during the acquisition of luminescence decays. The significant role of the repetition rate, controlled through a pulsed laser, and the time resolution is demonstrated well by examining different fluorophore systems. Achieving an optimal adjustment of time resolution and repetition rates is essential for accurately analysing lifetime decays and discerning whether a material's emission falls within the nanosecond or microsecond range. Our observations lead to the interesting finding that the lifetime of the materials emitting on the nanosecond time scale is negligibly affected by varying the measurement parameters. In contrast, it changes for the materials emitting on the microsecond time scale. The variation is mostly due to the overflow of the photons into the successive time windows. Also, the time resolution, at the same repetition rate, significantly affected the fitting errors. So, the materials on the microsecond time scale need an intelligent approach towards systematic analysis of the fluorescence decays. This adjustment of measurement parameters is particularly shown for metal nanoclusters, which show both short- and long-lived emissions. This study intends to mitigate the instrumental limitations while performing time-resolved measurements.Author contributions
S. S. conceptualized and designed the experiments. S. S. and A. Y. performed various steady-state and time-resolved spectroscopic measurements. The data were analyzed with the help of A. Y. and K. K. A. S. synthesized some of the materials utilized in the study. C. K. N. guided the complete project thoroughly and wrote the manuscript with the help of S. S.Data availability
The data supporting this article have been included as a part of the ESI.†Conflicts of interest
There are no conflicts to declare.Acknowledgements
The authors thank the Advanced Material Research Centre of I.I.T. Mandi for providing the facilities and the sophisticated instruments. A. Y. thanks the Council of Scientific and Industrial Research (CSIR SRF:09/1058(0014)/2019-EMR-I). C. K. N. thanks the Science and Engineering Research Board (Project No. IITM/SERB/CKN/310). S. S., K. K. and A. S. thank the Ministry of Education, India (MoE) for the research scholarship.References
- W. Ren, G. Lin, C. Clarke, J. Zhou and D. Jin, Adv. Mater., 2020, 32, 1–15 Search PubMed.
- B. Zhou, B. Shi, D. Jin and X. Liu, Nat. Nanotechnol., 2015, 10, 924–936 CrossRef CAS PubMed.
- Y. Xie, M. C. Arno, J. T. Husband, M. Torrent-Sucarrat and R. K. O'Reilly, Nat. Commun., 2020, 11, 1–9 CrossRef PubMed.
- R. Feng, G. Li, C.-N. Ko, Z. Zhang, J.-B. Wan and Q.-W. Zhang, Small Struct., 2023, 4, 2200131 CrossRef CAS.
- Y. Lu, J. Lu, J. Zhao, J. Cusido, F. M. Raymo, J. Yuan, S. Yang, R. C. Leif, Y. Huo, J. A. Piper, J. Paul Robinson, E. M. Goldys and D. Jin, Nat. Commun., 2014, 5, 3741 CrossRef CAS PubMed.
- X. Meng, X. Wang, Z. Cheng, N. Tian, M. C. Lang, W. Yan, D. Liu, Y. Zhang and P. Wang, ACS Appl. Mater. Interfaces, 2018, 10, 31136–31145 CrossRef CAS PubMed.
- O. A. Savchuk, P. Haro-González, J. J. Carvajal, D. Jaque, J. Massons, M. Aguiló and F. Díaz, Nanoscale, 2014, 6, 9727–9733 RSC.
- J. Shen, B. Xu, Z. Wang, J. Zhang, W. Zhang, Z. Gao, X. Wang, C. Zhu and X. Meng, J. Mater. Chem. C, 2021, 9, 6781–6788 RSC.
- Y. Fan, P. Wang, Y. Lu, R. Wang, L. Zhou, X. Zheng, X. Li, J. A. Piper and F. Zhang, Nat. Nanotechnol., 2018, 13, 941–946 CrossRef CAS PubMed.
- J. Guo, H. Li, L. Ling, G. Li, R. Cheng, X. Lu, A. Q. Xie, Q. Li, C. F. Wang and S. Chen, ACS Sustainable Chem. Eng., 2020, 8, 1566–1572 CrossRef CAS.
- L. Wang, W. Zhong, W. Gao, W. Liu and L. Shang, Chem. Eng. J., 2024, 479, 147490 CrossRef CAS.
- S. Liu, Z. An and B. Zhou, Chem. Eng. J., 2023, 452, 139649 CrossRef CAS.
- J. R. Lakowicz, Principles of Fluorescence Spectroscopy, Springer US, Boston, MA, 2006 Search PubMed.
- D. Phillips, R. C. Drake, D. V. O'Connor and R. L. Christensen, Instrum. Sci. Technol., 1985, 14, 267–292 CrossRef CAS.
- P. J. Whitham, A. Marchioro, K. E. Knowles, T. B. Kilburn, P. J. Reid and D. R. Gamelin, J. Phys. Chem. C, 2016, 120, 17136–17142 CrossRef CAS.
- Y. Gao and X. Peng, J. Am. Chem. Soc., 2015, 137, 4230–4235 CrossRef CAS PubMed.
- M. Sugiuchi, J. Maeba, N. Okubo, M. Iwamura, K. Nozaki and K. Konishi, J. Am. Chem. Soc., 2017, 139, 17731–17734 CrossRef CAS PubMed.
- S. Sharma, S. Das, K. Kaushik, A. Yadav, A. Patra and C. K. Nandi, J. Phys. Chem. Lett., 2023, 14, 8979–8987 CrossRef CAS PubMed.
- X. Le Guével, B. Hötzer, G. Jung, K. Hollemeyer, V. Trouillet and M. Schneider, J. Phys. Chem. C, 2011, 115, 10955–10963 CrossRef.
- A. Yadav, N. C. Verma, C. Rao, P. M. Mishra, A. Jaiswal and C. K. Nandi, J. Phys. Chem. Lett., 2020, 11, 5741–5748 CrossRef CAS PubMed.
- X. Wen, P. Yu, Y. R. Toh, A. C. Hsu, Y. C. Lee and J. Tang, J. Phys. Chem. C, 2012, 116, 19032–19038 CrossRef CAS.
- X. Wen, P. Yu, Y. R. Toh and J. Tang, J. Phys. Chem. C, 2012, 116, 11830–11836 CrossRef CAS.
- R. Rajamanikandan and M. Ilanchelian, Anal. Methods, 2018, 10, 3666–3674 RSC.
- H. H. Deng, X. Q. Shi, F. F. Wang, H. P. Peng, A. L. Liu, X. H. Xia and W. Chen, Chem. Mater., 2017, 29, 1362–1369 CrossRef CAS.
- Z. Wei, Y. Pan, G. Hou, X. Ran, Z. Chi, Y. He, Y. Kuang, X. Wang, R. Liu and L. Guo, ACS Appl. Mater. Interfaces, 2022, 14, 2452–2463 CrossRef CAS PubMed.
- H. Yang, Y. Wu, H. Ruan, F. Guo, Y. Liang, G. Qin, X. Liu, Z. Zhang, J. Yuan and X. Fang, Anal. Chem., 2022, 94, 3056–3064 CrossRef CAS PubMed.
- S. Bhunia, K. Gangopadhyay, A. Ghosh, S. K. Seth, R. Das and P. Purkayastha, ACS Appl. Nano Mater., 2021, 4, 305–312 CrossRef CAS.
- A. Pniakowska, M. Samoć and J. Olesiak-Bańska, Nanoscale, 2023, 15, 8597–8602 RSC.
- J. Xie, Y. Zheng and J. Y. Ying, J. Am. Chem. Soc., 2009, 131, 888–889 CrossRef CAS PubMed.
- Y. Chen, T. Feng, L. Chen, Y. Gao and J. Di, Opt. Mater., 2021, 114, 111012 CrossRef CAS.
- Y. Hai, J. J. Chen, P. Zhao, H. Lv, Y. Yu, P. Xu and J. L. Zhang, Chem. Commun., 2011, 47, 2435–2437 RSC.
- J. Tan, Y. Liang, J. Wang, J. Chen, B. Sun and L. Shao, New J. Chem., 2015, 39, 4488–4493 RSC.
- A. J. Walsh, J. T. Sharick, M. C. Skala and H. T. Beier, Biomed. Opt. Express, 2016, 7, 1385–1399 CrossRef PubMed.
- J. Arlt, D. Tyndall, B. R. Rae, D. D. U. Li, J. A. Richardson and R. K. Henderson, Rev. Sci. Instrum., 2013, 84, 103105 CrossRef PubMed.
- C. Poudel, I. Mela and C. F. Kaminski, Methods Appl. Fluoresc., 2020, 8, 24005 CrossRef CAS PubMed.
- D. A. Gvozdev, A. N. Semenov, G. V. Tsoraev and E. G. Maksimov, Photonics, 2023, 10, 1–11 CrossRef.
- M. Patting, P. Reisch, M. Sackrow, R. Dowler, M. Koenig and M. Wahl, Opt. Eng., 2018, 57, 1 Search PubMed.
- W. Hwang, D. Kim, S. Moon and D. Y. Kim, Opt. Express, 2021, 29, 9797 CrossRef CAS PubMed.
Footnote |
| † Electronic supplementary information (ESI) available: Materials (I), describing the details of the chemicals and solvents used in the study; Instrumentation (II), including a brief explanation of the characterization methods utilized; and Experimental (III) describing synthesis procedures for the materials used in the study, including figures and tables for the photophysical characterization. See DOI: https://doi.org/10.1039/d4nr01916d |
| This journal is © The Royal Society of Chemistry 2024 |

