 Open Access Article
Wireless μLED packed beds for scalable continuous multiphasic photochemistry†
Esai Daniel
Lopez
 a,
Patricia
Zhang Musacchio
 b and
Andrew R.
Teixeira
 *a
*a
aWorcester Polytechnic Institute, Department of Chemical Engineering, Worcester, MA 01609, USA. E-mail: arteixeira@wpi.edu
bWorcester Polytechnic Institute, Department of Chemistry and Biochemistry, Worcester, MA 01609, USA
First published on 12th August 2024
Abstract
Photochemical and photocatalytic reactions are a powerful emerging tool in the green synthesis of organic molecules. In contrast to thermochemical reactions, they promise greater energy efficiency, milder reaction conditions, and a decrease in the number of synthesis steps. Unfortunately, conventional batch photochemical systems are not inherently scalable, making translation to industrial applications challenging. Fundamentally, this is most clearly attributed to the penetration depth of light, as constrained by the Beer–Lambert relationship: as the size of the reactor is increased, the depth of light penetration into liquid medium decreases exponentially. Small-diameter plug flow reactors with external illumination have recently been employed industrially to 1) transition photochemistry from batch to continuous flow, and 2) overcome light penetration challenges by employing millimeter-scale optical paths; however these often present with substantial pressure drops and scalability challenges. In this work, a fixed bed reactor is packed with wireless μLEDs (μLED-PBR) and engineered to scale the oxidation of α-terpinene using a homogeneous rose-bengal photosensitizer. Utilizing μLEDs as packing allows for internal volumetrically scalable illumination from 250 or 500 μLEDs. Not only is the μLED packing efficient at delivering photons, but it also statically induces turbulence and mixing of the biphasic streams within the reactor. Unlike tubular plug flow reactors, the μLED-PBR design is volumetrically scalable. During operation, a co-current trickle flow regime was established with a 29 μm liquid film flowing over the μLEDs. In stark contrast to those typical in small channel tubular flow reactors, the packed bed experienced negligible hydrodynamic pressure drop penalties. The photochemical space time yield of the reactor normalized to the power consumption for the μLED-PBR was three orders of magnitude greater than other externally illuminated thin film flow reactors for the same chemistry: 1411 mmol W−1 per day compared to 1.34 mmol W−1 per day.
Introduction
Photochemistry leverages the energy in photons of light to initiate chemical reactions; it has been employed in fields ranging from water treatment1 to pharmaceutical production.2 In contrast to thermochemical reactions, photochemistry has the advantage of being a direct electron transfer reaction which offers substantive efficiency benefits while simultaneously unlocking new synthesis pathways.3,4 Despite tremendous progress in chemical pathway exploration5–7 and recent progress in technology adoption,8,9 the fundamental reaction engineering limitation persists: scaling of photoreactors remains limited by our ability to efficiently deliver light to the active reaction site.9 This is because as the optical characteristic length (δ) of the light increases, the absorbance of light by the fluid increases, resulting in a logarithmic decay in the intensity of the light in the fluid, I, as described by the Bouguer–Lambert–Beer law.10–12 Seen in Fig. 1A, the transmittance (T) of light described by eqn (1) decreases exponentially as a function of distance, δ, scaled by the molar extinction coefficient ε and solution concentration Ci. | (1) |
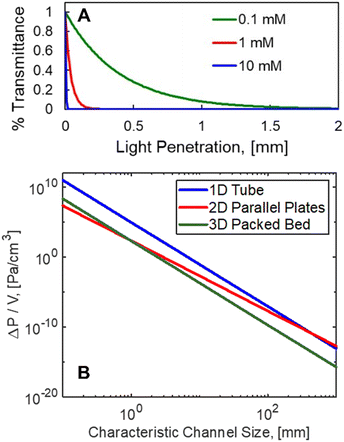 | ||
Fig. 1 A. Sub-millimeter light penetration is experienced with RB (ε = 110![[thin space (1/6-em)]](https://www.rsc.org/images/entities/char_2009.gif) 277 M−1 cm−1).13 B. Theoretical pressure drop per unit volume for plug flow reactors (1D), parallel plates (2D), and packed beds (3D) plotted against the respective characteristic lengths for light penetration. V = 100 mL, F = 100 mL min−1 water, 1 277 M−1 cm−1).13 B. Theoretical pressure drop per unit volume for plug flow reactors (1D), parallel plates (2D), and packed beds (3D) plotted against the respective characteristic lengths for light penetration. V = 100 mL, F = 100 mL min−1 water, 1![[thin space (1/6-em)]](https://www.rsc.org/images/entities/char_2009.gif) : :![[thin space (1/6-em)]](https://www.rsc.org/images/entities/char_2009.gif) 10 aspect ratio for the parallel plates; 1 10 aspect ratio for the parallel plates; 1![[thin space (1/6-em)]](https://www.rsc.org/images/entities/char_2009.gif) : :![[thin space (1/6-em)]](https://www.rsc.org/images/entities/char_2009.gif) 10 ratio of particle size to tube diameter for PBR with 50% void fraction. 10 ratio of particle size to tube diameter for PBR with 50% void fraction. | ||
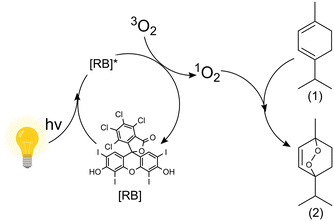 | ||
| Fig. 2 Oxidation of α-terpinene (1) with the photosensitizer rose bengal (RB) in iso-propyl alcohol using white light to form ascaridole (2) and p-cymene (not depicted).14 | ||
This constraint limits the scalability of batch photoreactors (0D), as a nominal size of δ = 1 mm would be required, as shown in Fig. 1A for the current system with >0.1 mM concentrations of rose bengal (RB) photosensitizer. This would limit reactor volumes to sub-milliliter volumes to ensure complete illumination. Seen in Fig. 1B, plug flow reactors (PFR) (1D), can leverage large aspect ratios to achieve efficient irradiation orthogonal to the flow, but as a consequence, they experience pressure drops (ΔP) per unit fluid volume (V) that scale with channel diameter (δ1D) to the sixth power (ΔP/V ∝ F/δ61D, Hagen–Poiseuille18), where F is volumetric flow rate of the liquid. Parallel plates (2D) such as falling film13,19 and spinning disks20 maintain the benefit from a short characteristic length for light and hydrodynamic length (δ2D), but the larger cross sectional area for the flow path of width, w, decrease the pressure drop (ΔP/V ∝ F/δ42D, Poiseuille flow21). Finally, packed bed reactors (PBR) (3D), with irradiating particles can decouple the light penetration and hydrodynamic length scale (δ3D) from the reactor scale with diameter (dbed); the pressure drop then scales with particle size to the second power (ΔP/V ∝ F/d4bedδ23D, Kozeny–Carman22).
Packed beds filled with light emitters are most hydrodynamically productive at length scales that are relevant to photon absorption, namely sub-millimeter scales. Fig. 1B draws a comparison between the pressure drop of each technology and the respective photon absorption at each scale. As a basis, a 100 mL reactor volume was used with a flowrate of water at 100 ml min−1. Aspect ratios of 1![[thin space (1/6-em)]](https://www.rsc.org/images/entities/char_2009.gif) :
:![[thin space (1/6-em)]](https://www.rsc.org/images/entities/char_2009.gif) 10 and 1
10 and 1![[thin space (1/6-em)]](https://www.rsc.org/images/entities/char_2009.gif) :
:![[thin space (1/6-em)]](https://www.rsc.org/images/entities/char_2009.gif) 10 were used for the δ2D
10 were used for the δ2D![[thin space (1/6-em)]](https://www.rsc.org/images/entities/char_2009.gif) :
:![[thin space (1/6-em)]](https://www.rsc.org/images/entities/char_2009.gif) w and δ3D
w and δ3D![[thin space (1/6-em)]](https://www.rsc.org/images/entities/char_2009.gif) :
:![[thin space (1/6-em)]](https://www.rsc.org/images/entities/char_2009.gif) dbed, respectively, along with a 50% bed void fraction for the PBR. At relevant light penetration depths, less than 1 mm, the PBR experiences two orders reduction in pressure relative to the PFR. This effect will become even more favorable for lower aspect ratio columns.
dbed, respectively, along with a 50% bed void fraction for the PBR. At relevant light penetration depths, less than 1 mm, the PBR experiences two orders reduction in pressure relative to the PFR. This effect will become even more favorable for lower aspect ratio columns.
Unlike microfluidic and externally irradiated reactors, volumetric excitation is a scalable approach whereby the irradiation occurs internal to the reactor volume. To do this while maintaining the short characteristic lengths for light penetration, a packed bed technology is proposed whereby each packing particle is a wirelessly powered μLED. The use of wireless light emitters, powered via induction, placed in contact with the reactants has been shown to be advantageous for batch homogenous chemistries.23–25 Similar to reactors with static mixers, the μLED induce turbulence and mixing of reactants which has been show to improve photonic efficiency.26 Other authors have designed packed bed reactors filled with glass beads to internally scatter external sources of light within the reactor to promote uniform light penetration and partially overcome the Beer–Lambert penetration depth limitations.27
In the present work, 250 and 500 wirelessly powered μLEDs are used to create a multiphase μLED packed bed reactor (μLED-PBR). The chemistry chosen to demonstrate the reactor concept is the oxidation of α-terpinene in isopropyl alcohol (IPA) with the rose bengal (RB) photosensitizer under white light. This model system was selected as it captures the challenges associated with gas–liquid photoreaction that are photon-limited. The particular chemistry, Fig. 2, forms an epoxide, selectively activating the aryl ring. Finding effective ways to form epoxides unlocks potential for green chemical transformations such as ring openings, nucleophilic attacks and rearrangement, all integral synthetic chemical transformations. Additionally, one of the products of the reaction is ascaridole an important anthelmintic and antifungal compound first synthesized in 1944.28 While (1) can absorb visible light in the irradiation window, it has been previously shown that the use of a photosensitizer is necessary to oxidize it, as its ability to self-sensitize is minimal.20 This is the first application of an intensified μLED-PBR to a continuous biphasic, gas–liquid, chemistry.
Materials and methods
Reactants
The oxygen source for all reactions, batch and μLED-PBR, was ultra-zero grade air, purchased from Airgas, USA. Brooks 11 sccm thermal mass flow controller SLA5800 was used to ensure constant flowrate of air. Liquid phase reactants included: ACS reagent grade isopropyl alcohol (IPA) (ThermoFisher Scientific), >90% pure α-terpinene (Sigma Aldrich), rose bengal (Alfa Aesar), and >99% hexadecane (ThermoFisher Scientific).Liquid reactants were prepared in a dark room, with only red light, and in glassware wrapped in aluminium foil. The concentration of the solutions were 166 mM of α-terpinene for experiments involving the PBR-250, PBR-500, and Batch 250 reactor, respectively. Across all reactor configurations, reactant solutions contained, 10.24 mM hexadecane internal standard, and 0.5 mM rose bengal in isopropyl alcohol. The solution was placed in an aluminium foil-wrapped HPLC bottle with a stir bar and was stirred continuously throughout use. Solvents used in the solvent compatibility study were toluene (ThermoFisher Scientific ACS reagent grade), acetone (ThermoFisher Scientific), dimethoxymethane (DME) (ThermoFisher Scientific), deionized water (18 mQ), and IPA (ThermoFisher Scientific ACS reagent grade).
Analytical
Reactor effluent was analysed using Shimadzu GCMS-QP2010 SE with a 5Sil column (Restek) and GC-FID with a Rtx-5 column (Restek). Liquid reactor effluent samples were collected using amber 1.5 mL Shimadzu GC vials. The method, compound peak spectra, and calibration curve can be found in the accompanying ESI† section S1.μLED photonic flux measurements were performed using a USB2000+ Spectrometer with a directly attached CC-3-DA cosine collector (Ocean Optics). A 24XR-A multimeter (Amprobe) was used when measuring current draw of multiple μLEDs.
LED characterization
The light sources for all reactions were induction-powered white light μLEDs, 3.0 mm × 3.2 mm × 2.8 mm (height × length × width), illuminated by an electromagnetic field induced by a transformed 24 V power supply and 7.5 cm coil (Feedok Store, China). The μLEDs were used as purchased and the induction coil was rewound into a 3.8 cm diameter with 23 rotations.Individual μLED performance was measured prior to reactions. Photonic flux, wattage, and emitted light spectrum were measured using a calibrated USB2000+ Spectrometer (Ocean Optics). The integration time of the spectrometer was 200 ms with 10 scans to average and a fiber diameter of 0.714 cm. The power transmission coil was placed around the top half of the reactor. A μLED was placed 0.7 cm into the induction field and was illuminated. The spectrometer receiver was placed at the surface of a μLED. This was repeated with 8 different μLEDs.
For solvent stability, 250 μLEDs were placed inside of a sealed glass sample vial with 20 mL of water, isopropyl alcohol, acetone, or toluene. 200 μLEDs were placed inside a sealed glass vial with 20 mL DME. The glass vials with solvent and μLEDs were placed inside of the PBR body with the induction coil wrapped around the reactor body. Power was supplied to the induction coil and illuminated the μLEDs in the vials. The multimeter was used to periodically measure the current draw of the μLEDs submerged in solvent at various time points. When the PBR and batch reactors were in operation, the power consumption was monitored using the same multimeter and coil setup.
Oxidation of α-terpinene in a batch reactor
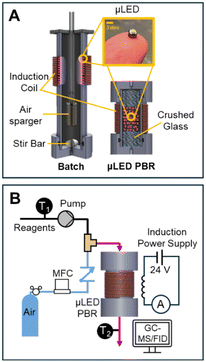
With the μLEDs bulbs facing the inside of the reactor, 250 μLEDs were adhered to the exterior of the of reactor body with black electrical tape. Fig. 3A presents a schematic of the batch reactor setup. A small desktop fan was used to cool induction coil circuitry. The reactor body was constructed of 3.8 cm outer diameter × 3.2 cm inner diameter × 18 cm long polycarbonate tube, purchased from McMaster-Carr. Buna-n O-rings, (4.0 cm × 4.8 cm × 0.4 cm) were used to press seal custom polycarbonate caps to the bottom of the reactor body. A 10 μm pore size HLPC filter (IDEX) was used to sparge air into the reactor. A 1 cm long stir bar was placed inside of the batch reactor and the entire assembly was placed atop a stir plate.The reactor was filled with 120 mL of reactant. The reactor was shrouded in a black box to ensure no ambient light entered the reactor during the experiment. The reactor was continuously stirred using the stir bar at 800 rpm. Air was bubbled in into the HPLC filter at 10 sccm. Samples of 0.5 mL were collected from the top of the reactor at various time points.
μLED packed bed reactor
The reactor body was identical to that of the batch reactor, but only 7 cm in length. The top cap is a similar design to the bottom cap, with a single port. At the outlet (bottom of the reactor), the cap was tapped to receive a 1/8′′ IDEX flat bottom fitting and was plumbed to a 0.32 cm (OD) PTFE effluent tubing. Liquid reactants were pumped using a M50 continuous pump (VICI Valco). An inline check valve (IDEX) was placed on the air line to ensure no backflow during transients. The gas and liquid streams were joined with an IDEX P-714 tee and screwed into a port on the top cap of the reactor. The μLED bed was gravimetrically dry packed, with sufficiently large particle-to-tube diameter ratio to ensure random packing.29 Crushed glass 13–30 mesh (Abrasives Incorporated) was used in the reactor as a mechanic bed support for the μLEDs and as a mixing chamber for the two inlet phases before entering the reactive illuminated zone. Instrumentation and setup of the packed bed reactor can be seen in Fig. 3B.When residence time distributions (RTDs) were measured, an actuated switching 6-port valve (IDEX) was connected down-stream of the M50 pump and used to inject 0.05 mL of Rhodamine B dye into the reactor. 0.75 mL samples of the reactor effluent were collected using transparent UV cuvettes. Ocean Optics Flame spectrometer >200 nm and DH-2000-BAL light source were used to collect the absorbance spectra of the liquid samples.
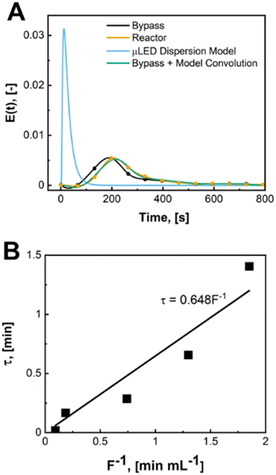
The μLED packed bed reactor consists of two outer zones with crushed glass (2 cm each) and a center region (1.5 or 3 cm) filled with the wireless μLEDs. Reactor residence time (τ), is defined as the amount of time fluid spends over the μLED bed. This is the zone where light from the μLEDs can excite the rose bengal yielding conversion of α-terpinene. The residence time was determined by measuring the transient concentration of rhodamine B dye in IPA after a pulse injection for the full 500 μLED μLED-PBR setup and a bypass setup made identically but a shortened reactor column was packed with just crushed glass. The flowrate of air was kept constant at 10 sccm. The liquid flowrates tested were from 0.54 to 10.8 mL min−1. The dye concentration was measured ex situ using a BAHL Ocean Optics light source and flame spectrometer at 548 nm and converted to an E curve. The E curve of the full system and the system without the reactor bed were deconvoluted using a classical dispersion model to determine τ as explained in prior work.30 More information on the RTDs can be found in the ESI† S2.
During the oxidation reactions, the μLED-PBRs were operated in a downflow concurrent configuration, with a single inlet and outlet. Air flowrate was constant at 10 sccm and the liquid flow rate ranged from 0.27 to 10.8 mL min−1. External temperature control was not used. The temperature was measured inside the feed vessel, after the M50 pump, and at the effluent of the reactor using K-type thermocouples (Omega Engineering).
Prior to all oxidation reactions experiments, air flowed through the reactor for 30 minutes. After the 30 minutes, gas and liquid flowed simultaneously. To ensure the reactor was at hydrodynamic stead state, 50 reactor volumes were passed before sampling after each flowrate change. Initially, dark samples were collected with the μLEDs off (no power supplied) in the order of lowest flowrate to highest flow rate. After the dark experiments the μLEDs were illuminated and samples were collected from lowest to highest flowrate. Samples were collected at the reactor outlet inside of a 1.5 mL amber Shimadzu GC vials. Current draw through the coil was monitored using the multimeter.
Results
LED characterization
In Fig. 4, the relationship between the power draw and number of μLED lights was determined to be linear, with each μLED contributing approximately 2.24 mW. When the reactor was void of μLEDs and power was supplied to the coil, the background power was measured as the transmission loss corresponding to the work required to generate the electric field, Ptrans = 2.16 W. Using the calibrated spectrometer, the power emitted as photons of light by each μLED was measured, PLED = 0.65 ± 0.1 mW LED−1. The rate of photosynthetically active radiation (400–700 nm), J, emitted by the μLEDs was J = 1.68 × 10⁻⁴ ± 0.25 × 10⁻⁴ mmolphotons min−1 LED−1. The deviation observed in the measurement results from the variation between different μLEDs and their and alignment within the field. The energy balance for the light delivery system can then be summarized in eqn (2), where the supplied power (P) has a constant transmission loss associated with the circuitry generating the electric field, as well as efficiency losses to heat at each of the N μLEDs, leading to each μLED emitting PLED as photons. The μLED efficiency, η, is described as the number of measured photons of light emitted by a single wireless μLED divided by the power consumed by that μLED inside the electric field. The μLED efficiency was dependent on the number of μLEDs packed inside the reactor, indicated by the subscript. The efficiency were determined to be η250 = 51% ± 7% and η500 = 37% ± 5%. These values are consistent with commercial wired LED efficiencies of 42–92%.31 Error is associated with the power range measured of PLED. | (2) |
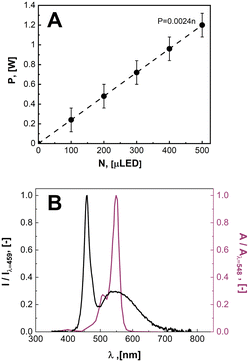 | ||
| Fig. 4 A. The measured power consumption as function of the number of μLEDs inside of the induction field. B. Irradiance spectrum of light emitted by the white μLED (black curve) normalized to the maximum intensity at a wavelength of 459 nm overlayed on top of the molar extinction spectrum of rose bengal13 normalized to max adsorption at 548 nm. | ||
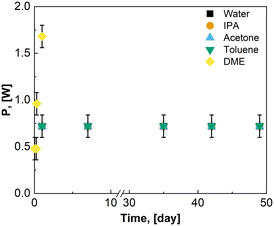
As the μLEDs are placed within the reactor, chemical compatibility and inertness of the μLED, antenna, circuitry, and support structure is required. Bloh and coworkers encased similar wireless μLEDs within spherical olefin polymer to ensure compatibility in a fixed bed and continuous sit tank studies.23–25 However, coatings may result in diminished light penetration, changes to wavelength, and bulkier particles, such as the 1 cm particles used.24 In the present study, the possibility for uncoated beads were explored. The μLED were used as received from the supplier. After submerging 250 μLEDs in water, acetone, IPA, and toluene for 49 days, there were no physical signs of degradation of the μLEDs or their components. Acetone was able to dissolve printed lettering on the bottom of the μLEDs and tinted the acetone blue. In Fig. 5, the power consumed by the μLEDs remains constant for 49 days of solvent contact. There was no visible decrease to light intensity. In Fig. 5, the power required to power on the μLEDs in contact with DME increases within the first day of contact with the solvent. This is indicative of shorting of the μLED circuitry. The μLEDs submerged in DME showed signs of loosening of the polycarbonate caps exposing the diodes. Mechanic stress was separately evaluated. Upon physical agitation in a flask with a stir bar, the pristine wireless μLEDs were mechanically degraded in minutes, necessitating the use of a catalyst basket, external irradiation, or alternative mixing strategies for emersion in stirred tanks.
Batch α-terpinene oxidation
Conventional external illumination was benchmarked by using an identical reactor setup but locating 250 μLEDs in an external array encircling the reactor body and with lights pointed inward. The batch reactor with external illuminated had a light penetration depth equal to the reactor radius, δ = 15.9 mm, and benefited from constant mixing. A 3 °C temperature rise was observed over the 60 minutes from 22.3 °C to 25.5 °C. The batch reactor converted 12% of the initial substrate after 60 minutes. In Table 1, the initial apparent kinetic rate was determined to be 0.32 mmol L−1 min−1. The power consumption of the batch 250 μLEDs was comparable to PBR packed with 250 μLEDs (PBR 250), at 2.48 W.| Reactor | r (mmol L−1 min−1) |
|---|---|
| PBR-500 | 13.3 |
| PBR-250 | 11.2 |
| Batch-250 | 0.32 |
μLED-PBR of α-terpinene oxidation
A biphasic concurrent flow was established in the downflow configuration over a crushed glass mixing chamber then into the μLED bed. Operating regimes for similar flow and packing configurations have been well-characterized in literature.33,34 Regime maps and correlations developed by Gianetto et al., account for the packing configuration and physical properties of the fluids.33,35 The flow regime for the current study is characterized as trickle flow,34–36 indicating that bicontinuous flow is established with a thin film of liquid wetting the particles. More information on the flow regime of the reactor can be found in the ESI† section S3. The residence time distribution of the 500 μLED reactor was determined using a pulse injection of a tracer dye in IPA without reaction taking place. A characteristic RTD is shown in Fig. 6A. with a liquid flowrate of 1.35 mL min−1, other RTDs can be found in the supplemental information. The reactor RTD is deconvoluted from the bypass using previously established methods.30,37 A dispersion model is fit to extract the dispersion number and the mean liquid residence time. B plots the measured liquid residence time (τL) against the inverse liquid flowrate (F), with the slope approximating the reactor's liquid volume (VL = hεVVR). The total liquid volume is the volume of the irradiated region (VR), less the solid fraction (1 − εV) and the gaseous fraction (1 − h). Packing the reactor body with 250 μLEDs decreases the μLED bed volume by half to 0.32 mL from 0.65 mL with 500 μLEDs. The liquid holdup was h = 0.03 and the bed void fraction was εV = 0.64.A trickle bed is characterized having a continuous gas stream and a laminar liquid flow.34 As the liquid trickles over the μLED bed, thin films of reactants form over the μLED surfaces. In conventional PBRs, this is advantageous for promoting mass transfer between the two fluid phases. In the presented design, falling films are a powerful tool in decreasing the light penetration path to enhance photonic flux per unit volume. The film thickness over the μLEDs was determined by distributing the reactor's liquid volume uniformly over the surface area of all number of μLEDs, N, with surface area SA, as seen in. This is the optical path length light travels within the packed bed reactor, δμLED.
 | (3) |
![[thin space (1/6-em)]](https://www.rsc.org/images/entities/char_2009.gif) 277 L mol cm−1.
277 L mol cm−1.
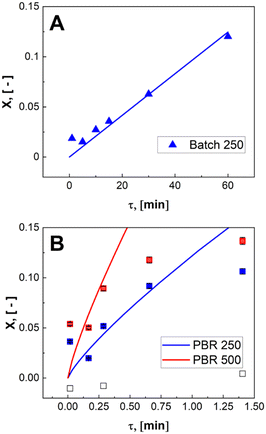
During the control trial, dark, conversion was negligible, less than 0.4%, for an unlit packed bed reactor filled with 500 μLEDs. The observed decrease in substrate concentration is attributed to the slow uncatalyzed oxidation of α-terpinene to p-cymene, and is considered negligible relative to the catalyzed case. The reaction was conducted in batch and PBR configurations. In Fig. 7, the conversion of α-terpinene was measured as a function of residence time in the respective reactor configurations. Conversion is defined in eqn (4) based on the final, Cα, and initial Cα,0, concentrations of the starting substrate. To assess the reproducibility, the PBR 250 was repacked and rerun two more times for the range of flowrates. The data showed similar trends with residence time, and the average standard deviation was calculated to be 2.6%, as represented by the error bars in Fig. 7. The same deviation is assumed for PBR 500; error bars representing 2.6% deviation are also shown. The selectivity of forming ascaridole in the packed bed reactors was always greater that 70% across all flowrates. More information on the selectivity can be found in the ESI† section S5. PBR selectivity.
 | (4) |
Volumetric scale up was preformed by increasing the number of μLEDs inside the PBR from 250 to 500. At a residence time of 1.4 minutes, the conversion of α-terpinene increased from 11% in the 250 μLED-PBR to 14% in the 500 μLED-PBR. Despite spending the same amount of time in the illuminated zone, the 500 μLED system exposed the flowing fluid to twice as many photons. This increase in reaction rate in flow is thus attributed to the increase in photonic flux, supporting the conclusion that the system is photon-limited, and further underscoring the need for more effective photon delivery strategies. In Fig. 7, the solid lines are the theoretical conversion, Xt, of α-terpinene if all the photons not transmitted through the solution react to form product as described in eqn (5) and (6) for flow and batch, respectively. The transmission of the flow reactors were determined to be 70% based on film thickness and the batch reactor 0% as it is a semi-infinite medium. Notably, the theoretical predictions closely match both the batch and flow systems, suggesting that in both scenarios, the reactor yields remain limited by the rate at which photons are delivered, though the PBR-500 begins to deviate toward a photon-insensitive regime at longer residence times.
 | (5) |
 | (6) |
 | (7) |
Discussion
There are two dominant and often conflicting perspectives to consider when implementing photochemical technology: maximizing productivity or maximizing efficiency. The former benefits from conditions that require high intensity illumination, often simultaneously incurring photonic and hydrodynamic power penalties. The later benefits from slow processes with large hydrodynamic and photonic length scales that allow for complete uptake and utilization of photons, often at the expense of reactions rate and productivity. Here, the μLED-PBR strategy is evaluated against each metric.Reactor efficiency
To assess the reactor efficiency, photochemical spacetime yield, PSTY, was quantified. The PSTY, ratios the number of moles reacted against the total power consumption, eqn (8).38,39 Since the PSTY accounts for the volume of the reactor and the power consumption of the light source it is an effective metric to compare different reactor geometries.38 | (8) |
In Fig. 8, the PSTY increases as the time constant for the reactor is decreased. This is analogous to conventional kinetics for bimolecular reactions where the fastest instantaneous reaction rates are observed when the concentrations of both reactants, in this case α-terpinene and singlet oxygen, are at their highest. For short contact times, PSTY are observed on the order of 103 mmol per day per W, demonstrating outstanding ability of these μLED-PBRs to efficiently utilize light in converting the reactant to products. As residence time increases, the reagent concentration drops, as does the rate, causing the PSTY to decrease for both the batch and flow cases. This is indicative of the efficiency gained from exposing the μLEDs to a constantly replenishing flow of reactants that can absorb more photons of light without allowing for their inefficient transmission past the thin film. Interestingly, the μLED-PBRs demonstrate PSTY that approach those of batch reactors. Batch reactors have a semi-infinite depth, allowing them to absorb nearly every photon of light emitted. This makes them very efficient from a PSTY perspective. Even though the μLEDs transmit then dissipate 70% of the light beyond the fluid film, they can achieve comparable yields for short contact times. Doubling the number of photons delivered by doubling both the bed size and flowrate maintains the residence time at 0.02 min, resulting in a PSTY rise from 957 to 1410 mmol per day per W. The μLED-PBR is also able to utilize each photon of light more efficiently when compared to falling film reactors by Shvydkiv et al. for the same chemistry but characteristic lengths of δ = 41–88 μm.
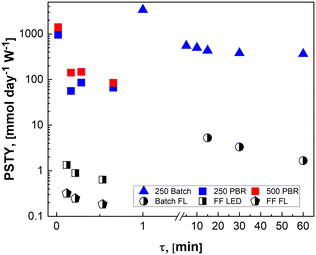 | ||
| Fig. 8 Photochemical space time yield for different reactor geometries demonstrate efficiencies comparable to batch for the intensified μLED-PBRs but in a fraction of the time. Solid data points are from the present study and partially filled data points are from the work of Shvydkiv et al.13 | ||
When considering the flow system, however, it is interesting to note that the reactor becomes more efficient when scaled. This is true for both the packed bed reactors and the falling film systems. Unlike classical photoreactors where scale-out or numbering up is required to maintain the short penetration depths, the current μLED PBR system can be scaled with either bed diameter or length. This is particularly impactful at short residence times where the highest flowrates become photon-limited but still result in larger PSTY.
Reactor productivity
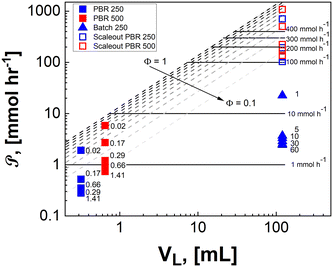
While the efficient utilization of photons is a key performance metric for photochemical reactors, the differentiator of the current design is the scalability to meet throughput metrics. This is quantified by measuring the apparent reaction and productivity rates.The apparent rates were measured using the method of initial rates for both the batch and flow configurations and summarized in Table 1. While all rates were in the range of reported literature,13 the apparent rates for the flow reactors were 50–80 times that of the batch system. This results from the uniform illumination of light within all active parts of the fluid regime during the photon-limited reaction.
In addition to rate, for the batch to continuous translation, a convenient metric of comparison is the reactor productivity.9,40 The productivity of the batch reactor  , is defined in eqn (9) as the number of moles of α-terpinene reacted over a period of time. The productivity of the flow reactor,
  , is defined in eqn (10) as the product of the volumetric flowrate, F, starting concentration, and measured conversion.
 | (9) |
 | (10) |
 | (11) |
 | (12) |
 | (13) |
The scaleup of a batch reactor requires a complex understanding of the mixing profiles, and more specifically, the rate at which the thin reactive zone near the walls is replenished. During scaleup the strength of the induction field generated would also need scaled in order to meet the power demands of additional μLEDs. For simplicity, it is assumed that, 1) the mixing profiles and reactor geometry are held identical during scaleup of the batch system, 2) all external surfaces are covered with the identically tight-packed LED array, and 3) a sufficient induction field can be generated to power on the μLEDs. The productivity then scales with the surface-to-volume ratio, as the number of deliverable photons in the photon-limited reaction is proportional to the surface area over which the photons are delivered. The batch scaleup can then be described by eqn (13) and represented in Fig. 9 by the dotted blue line. Notably, as reactor volumes increase, the benefits of the flow reactors are made more apparent with the divergence of the theoretical photon-limited curves.
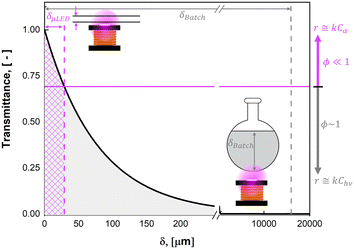
Unlike conventional photoreactors, the scalability of these μLED-PBRs can be achieved by either scale-up or scale-out without substantial loss in efficacy. The scale-out of the packed photoreactors can be achieved by either numbering up columns or by increasing the column diameter. Both strategies result in identical photonic flux and pressure drop for a given residence time, but larger volume and productivity. Alternatively, scaling up in the axial direction would increase pressure drop, but it also increases the photonic flux proportionally to the bed length for any given residence time, as was observed in the 250-PBR to 500-PBR comparison. In practicality, this becomes a trade-off of operating at high conversions with excess photons and lower ϕ, as is achievable with longer beds (Fig. 10, pink), or high efficiency with excess substrate, higher ϕ and lower single pass conversions characteristic of shorter beds (Fig. 10, gray).
The ultimate benefits of the μLED PBR result from the ability to operate in a quasi-homogenous environment where photon delivery is not rate limiting, giving rise to a constant concentration of photons and thus photoexcited singlet oxygen. This is akin to removing gas–liquid mass transfer limitations for classical trickle bed reactors by establishing thin films. As shown in Fig. 10, the percent transmittance of light through a 0.5 mM solution rose bengal and IPA solution exponentially decreases over the first 200 μm. For the PBR film of δ = 29 μm, less than 30% photon gradient is experienced across the reactive film. This is in contrast to the batch reactor which experiences nearly no light penetration beyond 1 mm, forcing 95% of the reactor volume to be effectively dark and non-reacting. This phenomena will only be exaggerated as the batch system is scaled and experiences lower surface-to-volume ratios. While stirring can help to constantly introduce unreacted fluid parcels to the irradiated zone, the small reactive zone would necessitate complete fluid changeout every 0.05 s, which is unattainable in conventional batch reactors with mixing times of 2–18 s.42 The intimate contact of the wireless μLEDs with the reacting fluid has the potential to create reactors that operate with small optical lengths. This intern means light sources with lower power requirements can be used to achieve greater efficiency and photochemical space time yields.
Reactor design
This paper aimed to demonstrate the μLED PBR as viable technology for the scaleup of photochemical reactions. Future advances to the design should address the temperature rise observed within the reactor and the compatibility of the μLED for the desired reactions. To maintain isothermal operation future designs can evaluate low-power activity or consider include a cooling jacket. Inert coatings can be applied to the μLED to increase their chemical and compatibility and mechanical stability, thus increasing the number of compatible reactions.Conclusions
The current work serves to demonstrate a process intensification approach that enables the scaling of multiphase photoreactors by utilizing wireless-powered μLED packed beds. The system was carefully characterized to measure hydrodynamics, conversion, photonic flux, and power demand. Photochemical space time yields of >10![[thin space (1/6-em)]](https://www.rsc.org/images/entities/char_2009.gif) 000 mmol per day per W were observed in sub-minute residence times 10–100× faster than batch. Operating windows were established for photoreactor scaling whereby the trade-off between productivity and efficiency is defined and quantified for scale-up and scale-out scenarios. The underlying benefit of the technique is to operate in a pseudo-homogenous environment whereby the kinetic photon-limitation can be minimized. This work opens the door for other high-photon intensive chemistries such as heterogeneous photocatalysts and selective photooxidations where photon gradients may induce undesired reactions.
000 mmol per day per W were observed in sub-minute residence times 10–100× faster than batch. Operating windows were established for photoreactor scaling whereby the trade-off between productivity and efficiency is defined and quantified for scale-up and scale-out scenarios. The underlying benefit of the technique is to operate in a pseudo-homogenous environment whereby the kinetic photon-limitation can be minimized. This work opens the door for other high-photon intensive chemistries such as heterogeneous photocatalysts and selective photooxidations where photon gradients may induce undesired reactions.
Data availability
The data supporting this article have been included as part of the ESI.†Author contributions
This work was conceptualized by Andrew R. Teixeira. Funding acquisitioned by Andrew R. Teixeira, Patricia Zhang Musacchio, and Esai Daniel Lopez. The investigation and writing the original draft was performed by Esai Daniel Lopez. Review and editing was performed by Patricia Zhang Musacchio and Andrew R. Teixeira.Conflicts of interest
There are no conflicts to declare.Acknowledgements
The authors would like to thank many members of the WPI community. Machinist Ian Anderson and technician Doug White for their consultation and aid in the fabrication of the reactor. Prof. Pratap Rao and Ph.D. Ceren Yilmaz Akkaya for their guidance and use of the calibrated spectrometer. Graduated undergraduate students for beta testing the reactor geometry, Brent Ditzler, Michelle Barboza, Rachel Swanson, Andrew Yahatsuhashi, Kimberly Frary, and James Marlow. Work was funded by NSF GRFP grant 2038257 and the ACS GCI Pharmaceutical Roundtable Grant 2023 Research Grant.Notes and references
- D. Y. Goswami, A Review of Engineering Developments of Aqueous Phase Solar Photocatalytic Detoxification and Disinfection Processes, J. Sol. Energy Eng., 1997, 119(2), 101–107, DOI:10.1115/1.2887886.
- L. O. Ruzo, M. J. Zabik and R. D. Schuetz, Photochemistry of bioactive compounds. Photochemical processes of polychlorinated biphenyls, J. Am. Chem. Soc., 1974, 96(12), 3809–3813, DOI:10.1021/ja00819a016.
- N. A. Fitzpatrick, L. Zamani, M. Das, H. G. Yayla, M. S. Lall and P. Z. Musacchio, A SN1 mechanistic approach to the Williamson ether reaction via photoredox catalysis applied to benzylic C(sp3)–H bonds, Tetrahedron, 2022, 125, 132986, DOI:10.1016/j.tet.2022.132986.
- E. G. Moschetta, et al., Photochemistry in Pharmaceutical Development: A Survey of Strategies and Approaches to Industry-wide Implementation, Org. Process Res. Dev., 2024, 28(4), 831–846, DOI:10.1021/acs.oprd.3c00499.
- W. Debrouwer, et al., Ir/Ni Photoredox Dual Catalysis with Heterogeneous Base Enabled by an Oscillatory Plug Flow Photoreactor, Org. Process Res. Dev., 2020, 24(10), 2319–2325, DOI:10.1021/acs.oprd.0c00150.
- P. Stefano, D. Daniele, F. Maurizio and A. Angelo, Photochemistry in synthesis: Where, when, and why, Pure Appl. Chem., 2007, 79(11), 1929–1938, DOI:10.1351/pac200779111929.
- L. Candish, et al., Photocatalysis in the Life Science Industry, Chem. Rev., 2022, 122(2), 2907–2980, DOI:10.1021/acs.chemrev.1c00416.
- A. Steiner, et al., Multikilogram per Hour Continuous Photochemical Benzylic Brominations Applying a Smart Dimensioning Scale-up Strategy, Org. Process Res. Dev., 2020, 24(10), 2208–2216, DOI:10.1021/acs.oprd.0c00239.
- S. D. A. Zondag, D. Mazzarella and T. Noël, Scale-Up of Photochemical Reactions: Transitioning from Lab Scale to Industrial Production, Annu. Rev. Chem. Biomol. Eng., 2023, 14(1) DOI:10.1146/annurev-chembioeng-101121-074313.
- J. H. Lambert, Photometria sive de mensura et gradibus luminis, colorum et umbrae, Augustae Vindelicorum : sumptibus viduae Eberhardi Klett typis Chistophori Petri Detleffsen, 1760 Search PubMed.
- P. Bouguer, Essai d'optique, sur la gradation de la lumière, A Paris : chez Claude Jombert, rue S. Jacques, au coin de la rue des Mathurins, a l'Image Notre-Dame, 1729 Search PubMed.
- J. Gordon and S. Harman, A Graduated Cylinder Colorimeter: An Investigation of Path Length and the Beer-Lambert Law, J. Chem. Educ., 2002, 79(5), 611, DOI:10.1021/ed079p611.
- O. Shvydkiv, K. Jähnisch, N. Steinfeldt, A. Yavorskyy and M. Oelgemöller, Visible-light photooxygenation of α-terpinene in a falling film microreactor, Catal. Today, 2018, 308, 102–118, DOI:10.1016/j.cattod.2017.11.009.
- J. Chen, R. Prinsloo and X. Ni, A Kinetic Study of a Photo-Oxidation Reaction between α-Terpinene and Singlet Oxygen in a Novel Oscillatory Baffled Photo Reactor, Technologies, 2024, 12(3), 29 CrossRef , [online], available: https://www.mdpi.com/2227-7080/12/3/29.
- Y. Zhang and S. L. Neal, Reaction monitoring of rose bengal photodegradation inalcohols usingmultivariate frequency-domain dynamic fluorescence, J. Photochem. Photobiol., A, 2023, 436, 114348, DOI:10.1016/j.jphotochem.2022.114348.
- C. R. Lambert and I. E. Kochevar, Electron Transfer Quenching of the Rose Bengal Triplet State, Photochem. Photobiol., 1997, 66(1), 15–25, DOI:10.1111/j.1751-1097.1997.tb03133.x.
- Y. Su, K. Kuijpers, V. Hessel and T. Noël, A convenient numbering-up strategy for the scale-up of gas–liquid photoredox catalysis in flow, React. Chem. Eng., 2016, 1(1), 73–81, 10.1039/C5RE00021A.
- S. K. Kim, M. Y. Ha, C. Son and J. H. Jeong, An experimental study on the pressure drop and heat transfer through straight and curved small diameter tubes, J. Mech. Sci. Technol., 2014, 28(2), 797–809, DOI:10.1007/s12206-013-1146-z.
- S. Naskar, et al., Making photochemistry scalable – an operationally simple falling film looping photoreactor, React. Chem. Eng., 2023, 8(9), 2211–2222, 10.1039/D3RE00107E.
- A. Chaudhuri, et al., Process intensification of a photochemical oxidation reaction using a Rotor-Stator Spinning Disk Reactor: A strategy for scale up, Chem. Eng. J., 2020, 400, 125875, DOI:10.1016/j.cej.2020.125875.
- M. Moreau, N. Di Miceli Raimondi, N. Le Sauze, M. Cabassud and C. Gourdon, Pressure drop and axial dispersion in industrial millistructured heat exchange reactors, Chem. Eng. Process.: Process Intesif., 2015, 95, 54–62, DOI:10.1016/j.cep.2015.05.009.
- V. Papkov, N. Shadymov and D. Pashchenko, Gas flow through a packed bed with low tube-to-particle diameter ratio: Effect of pellet roughness, Phys. Fluids, 2024, 36(2), 027127, DOI:10.1063/5.0183475.
- B. O. Burek, et al., Photochemistry at Scale: Wireless Light Emitters Drive Sustainability in Process Research & Development, Eur. J. Org. Chem., 2022, 5, 2022, DOI:10.1002/ejoc.202101180.
- B. O. Burek, A. Sutor, D. W. Bahnemann and J. Z. Bloh, Completely integrated wirelessly-powered photocatalyst-coated spheres as a novel means to perform heterogeneous photocatalytic reactions, Catal. Sci. Technol., 2017, 7(21), 4977–4983, 10.1039/C7CY01537B.
- H. T. Duong, Y. Wu, A. Sutor, B. O. Burek, F. Hollmann and J. Z. Bloh, Intensification of Photobiocatalytic Decarboxylation of Fatty Acids for the Production of Biodiesel, ChemSusChem, 2021, 14(4), 1053–1056, DOI:10.1002/cssc.202002957.
- F. Gaulhofer, M. Metzger, A. Peschl and D. Ziegenbalg, Enhancing mass transport to accelerate photoreactions and enable scale-up, React. Chem. Eng., 2024, 9, 1845–1858, 10.1039/D3RE00689A.
- L. Zheng, H. Xue, W. K. Wong, H. Cao, J. Wu and S. A. Khan, Cloud-inspired multiple scattering for light intensified photochemical flow reactors, React. Chem. Eng., 2020, 5(6), 1058–1063, 10.1039/D0RE00080A.
- Günther, O. Schenck and K. Ziegler, Die Synthese des Ascaridols, Naturwissenschaften, 1944, 32, 157, DOI:10.1007/BF01467891.
- P. Niegodajew, A. P. Durajski, P. Rajca, K. M. Gruszka and M. Marek, Experimental and numerical study on the orientation distribution of cylindrical particles in random packed beds, Chem. Eng. J., 2022, 432, 134043, DOI:10.1016/j.cej.2021.134043.
- J. Zhang, A. R. Teixeira, L. T. Kögl, L. Yang and K. F. Jensen, Hydrodynamics of gas-liquid flow in micropacked beds: Pressure drop, liquid holdup, and two-phase model, AIChE J., 2017, 63(10), 4694–4704, DOI:10.1002/aic.15807.
- P. Kusuma, P. M. Pattison and B. Bugbee, From physics to fixtures to food: current and potential LED efficacy, Hortic. Res., 2020, 7(1), 56, DOI:10.1038/s41438-020-0283-7.
- A. Yavorskyy, O. Shvydkiv, C. Limburg, K. Nolan, Y. M. C. Delauré and M. Oelgemöller, Photooxygenations in a bubble column reactor, Green Chem., 2012, 14(4), 888–892, 10.1039/C2GC16439F.
- F. Larachi, A. Laurent, N. Midoux and G. Wild, Experimental study of a trickle-bed reactor operating at high pressure: two-phase pressure drop and liquid saturation, Chem. Eng. Sci., 1991, 46(5), 1233–1246, DOI:10.1016/0009-2509(91)85051-X.
- C. N. Satterfield, Trickle-Bed Reactors, AIChE J., 1975, 21(2), 209–228 CrossRef CAS.
- A. Gianetto, G. Baldi, V. Specchia and S. Sicardi, Hydrodynamics and solid-liquid contacting effectiveness in trickle-bed reactors, AIChE J., 1978, 24(6), 1087–1104, DOI:10.1002/aic.690240622.
- S. Li, F. Xin and L. Li, Reaction Engineering, in Reaction Engineering, Butterworth-Heinemann, 1st edn, 2017, ch. 9, pp. 405–444 Search PubMed.
- P. V. Danckwerts, Continuous flow systems. Distribution of residence times, Chem. Eng. Sci., 1995, 50, 3857–3866 CrossRef CAS.
- E. Kayahan, et al., Overcoming mass and photon transfer limitations in a scalable reactor: Oxidation in an aerosol photoreactor, Chem. Eng. J., 2021, 408, 127357, DOI:10.1016/j.cej.2020.127357.
- M. E. Leblebici, G. D. Stefanidis and T. Van Gerven, Comparison of photocatalytic space-time yields of 12 reactor designs for wastewater treatment, Chem. Eng. Process.: Process Intesif., 2015, 97, 106–111, DOI:10.1016/j.cep.2015.09.009.
- L. Buglioni, F. Raymenants, A. Slattery, S. D. A. Zondag and T. Noël, Technological Innovations in Photochemistry for Organic Synthesis: Flow Chemistry, High-Throughput Experimentation, Scale-up, and Photoelectrochemistry, Chem. Rev., 2022, 122(2), 2752–2906, DOI:10.1021/acs.chemrev.1c00332.
- ‘quantum yield’ in IUPAC Compendium of Chemical Terminology, 3rd ed. International Union of Pure and Applied Chemistry; 2006. Online version 3.0.1, 2019. DOI:10.1351/goldbook.Q04991.
- N. K. Nere, A. W. Patwardhan and J. B. Joshi, Liquid-Phase Mixing in Stirred Vessels: Turbulent Flow Regime, Ind. Eng. Chem. Res., 2003, 42(12), 2661–2698, DOI:10.1021/ie0206397.
Footnote |
| † Electronic supplementary information (ESI) available. See DOI: https://doi.org/10.1039/d4re00241e |
| This journal is © The Royal Society of Chemistry 2024 |

