Recycling spent batteries to green innovation: a CuCo-based composite as an electrocatalyst for CO2 reduction†
Jean C.
da Cruz
ab,
Ricardo M.
e Silva
 b,
Gelson T. S. T.
da Silva
 c,
Lucia H.
Mascaro
 c and
Caue
Ribeiro
 *b
*b
aFederal University of São Carlos, Chemistry Department, São Carlos-SP, Brazil
bEmbrapa Instrumentation, Nanotechnology National Laboratory for Agriculture (LNNA), São Carlos-SP, Brazil. E-mail: caue.ribeiro@embrapa.br
cInterdisciplinary Laboratory of Electrochemistry and Ceramics, Department of Chemistry, Federal University of Sao Carlos, São Carlos-SP, Brazil
First published on 24th May 2024
Abstract
The reuse of solid and gaseous waste is necessary to achieve a significant advance toward more sustainable and eco-friendly processes. It is a challenge in the electronic industry, where the materials are generally expensive and toxic (if disposed of in nature), requiring strategies for maximum material recovery. Here, we report a strategy to recycle lithium-ion batteries (LIBs), preparing a copper–cobalt composite catalyst designed to operate in electrochemical CO2 reduction to hydrocarbons. The proposed method allows fast and easy electrodeposition of a thin layer of spherical Cu/Co nanoparticles over a conductive substrate. The electrodes were assessed for their CO2 reduction activity at different potentials (−0.13, −0.33, and −0.53 V vs. RHE). As a result, we achieved different products such as methanol, acetic acid, ethanol, and hydrogen with selectivity according to the applied potential. The highest production and faradaic efficiency for C1+ compounds were for methanol, reaching 103 μmol mgcat and 65% after 3 h of reaction at an applied potential of −0.13 V vs. RHE. A proposed scheme, based on in situ FTIR spectra using D2O, suggests that CO2 initially undergoes one-electron reduction, forming *COads, which acts as a stable intermediate on the Cu surface. The Cu surface predominantly drives the reaction despite its higher amount in the CuCo-based composites. From that, various pathways can arise from the protonation of the intermediate, leading to the production of C2+ alcohols in smaller quantities or C1 alcohols in larger quantities and intensity.
Introduction
Recently, the United Nations established global goals for sustainable development that address changes in energy and climate.1 Recently, the United Nations established global goals for sustainable development, which address changes in energy and climate.1 In this sense, electrification is a cost-effective means of preventing or reducing greenhouse gas (GHG) emissions, which helps mitigate the consequences of climate change since it is one of the most cost-effective energy transitions.1 Lithium-ion batteries (LIBs) have emerged as one of the most viable strategies for modern civilization to reduce the amount of directly produced CO2. Batteries are a promising alternative to combustion-powered transport vehicles, which account for nearly 18% of total CO2 emissions.2 However, the metal used in the manufacture of these electronic devices causes severe environmental damage if disposed of in nature or not correctly recycled.3,4There are two industrial ways to recycle spent LIBs: the pyrometallurgical and hydrometallurgical processes.5 The latter is the primary method for recycling LIBs because it allows the recovery of metal ions under mild conditions, and its resulting solution can be harnessed through precipitation, extraction, or electrodeposition methods.6–8 Electrochemical recycling via electrodeposition is a promising strategy for separating and recovering metals from multi-component mixtures. It is a viable and controlled process to produce metal films, alloys, and multilayer deposits.7,9
Copper and cobalt are some of the metals found in used LIBs that hold exciting applications for supporting the achievement of global sustainable development goals, as they can contribute to reducing CO2 emissions by their use as building blocks for making value-added molecules.10,11 Currently, copper is the only metal capable of producing alcohols and dimerizing carbon molecules to produce C2+ compounds in an aqueous reaction related to the intermediate binding strength between CO2 molecules and the active copper sites.12,13 Simultaneously, cobalt-based catalysts have shown promising results for CO2 conversion, being an alternative to metals such as Au, Ag, Pd, or In.14–16 Recently, Wang's group reported that incorporating cobalt nanoparticles on single-layer nitrogen-doped graphene boosted the selective hydrogenation of CO2 to methanol, obtaining 71.4% methanol under mild conditions. 17 Kim's group reported the potential of a Co-based catalyst for direct CO2 hydrogenation at a mild temperature of 270 °C, achieving high-yield C5+ (21.1%) even during long-term catalytic reactions (up to 1425 h). 18
Bimetallic Cu/Co materials are promising electrocatalysts based on the synergism between the copper and cobalt particles, associated with the percentage of each metal, which drives the direction of the reactions. It may form mainly CO, CH4, >C2+, and alcohol. Guo et al. observed a faradaic efficiency (FE) of 97.4% for CO, using Cu/Co bimetallic catalysts. 19 Bernal et al. investigated the product selectivity of Cu/Co toward CO, HCOOH, and H2 by varying the size and composition of catalysts. They attested that small Co contents enhance Cu/Co NPs activity, while increasing particle size favors the CO2RR over the HER. 20 Grote et al. produced Cu–Co NPs with composition-dependent product selectivity, which demonstrated good selectivity for ethylene and alcohol synthesis when the Co content was maintained within the range of 5–15%.21 Zhang et al. confirmed the potential of this catalyst using density functional theory (DFT) methods to investigate the main pathways for alcohol production on bimetallic Cu/Co sites through syngas (CO/H2) conversion. According to the authors, the insertion of Co into copper-based catalysts can accelerate the whole reaction system by inserting CO and CHO on the surface or even by the decomposition of CHxO and CHxOH, which is necessary for the formation of higher alcohol precursors.22
Although the literature extensively explores copper- and cobalt-based materials as promising catalysts for the production of alcohols and C2+ compounds, there are few reports on the use of lithium-ion batteries (LIBs) as raw materials for such catalysts.23 Recent studies have indicated that the graphite anode present in discarded batteries can serve as a promising alternative carbon support for copper catalysts in CO2 conversion and the degradation of organic contaminants.24,25 However, both of them have not explored the potential metal ions in the cathode.
Thus, in our present study, we have effectively produced a catalyst by using a direct method that includes ion leaching, followed by filtration to eliminate carbon powder, and electrodeposition at ambient temperature. Notably, the copper and cobalt used in this catalyst were exclusively obtained from discarded lithium-ion batteries. Our approach adequately fits three pillars of circular economy, i.e., use of waste, straightforward synthesis method, and application for low-carbon production of chemicals (i.e., CO2 conversion to methanol at room temperature). Since the thermocatalytic process, commonly operating above 300 °C, is still the commercial route for methanol production, low-temperature routes are desirable in the context of energy efficiency for this product.26 Our results reveal the potential utilization of the suggested technique and material in advancing the understanding of a sustainable economy founded on environmentally friendly chemistry.
Experimental methods
Leaching of metals from spent Li-ion batteries
The material based on Cu/Co was prepared from waste cell phone lithium-ion batteries. Following the procedure described by Nascimento et al.,27 the lithium-ion batteries were dismantled piece by piece. The copper current collector underwent a cleansing process with distilled water to eliminate lithium salts. Subsequently, it was cut into smaller pieces and immersed in a beaker containing aqua regia solution (HCl![[thin space (1/6-em)]](https://www.rsc.org/images/entities/char_2009.gif) :
:![[thin space (1/6-em)]](https://www.rsc.org/images/entities/char_2009.gif) HNO3 – 3
HNO3 – 3![[thin space (1/6-em)]](https://www.rsc.org/images/entities/char_2009.gif) :
:![[thin space (1/6-em)]](https://www.rsc.org/images/entities/char_2009.gif) 1 v/v). The mixture was stirred magnetically at 60 °C for 2 hours to ensure complete leaching of copper and cobalt ions, resulting in a solution. This solution was then filtered to remove any solid residues (Fig. 1).
1 v/v). The mixture was stirred magnetically at 60 °C for 2 hours to ensure complete leaching of copper and cobalt ions, resulting in a solution. This solution was then filtered to remove any solid residues (Fig. 1).
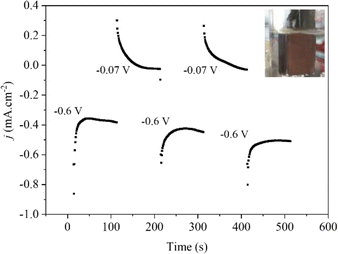 | ||
| Fig. 1 Chronoamperometry curves of electrodeposition of the spent LIBs at different deposition potentials on the FTO surface. | ||
Electrodeposition of the Cu/Co composites
The spent LIBs were reused by reducing the metal ions from leaching liquor to form a thin film of metal nanoparticles on fluorine oxide (FTO) coated glass substrates by electrodeposition.28 Firstly, the leaching liquor was ultrasonically cleaned in deionized water, isopropanol, deionized water, acetone, and then ethanol for 10 min each. The pH of the leaching liquor was adjusted to 2.7 with NaOH pellets to promote the proper nucleation of the metal nanoparticles on the substrate surface and then H3BO3 was added up to a concentration of 0.1 M to stabilize the pH during the electrodeposition.28 The nucleation and growth of nanoparticles were achieved by an electrodeposition method using a potentiostat (Metrohm Autolab PGSTAT30N), a homemade three-electrode cell containing an FTO-substrate (1 cm2 active area), Pt mesh, and Ag/AgCl (3 M KCl) as the working, counter, and reference electrodes, respectively, and leaching liquor as electrolyte. The electrodeposition process was carried out in multiple steps under potentiostatic conditions. Initially, a potential of −0.6 V was applied, followed by 0.07 V vs. RHE, as illustrated in Fig. 1. It allows a controlled and selective growth of the copper and cobalt particles on the substrate surface. After the electrochemical procedure was complete, we discovered a brown electrode that had been repeatedly cleaned with ethanol and dried with nitrogen gas. Following electrodeposition, the weight of the film was found to be around 0.173 mg cm−2.Structural characterization
The phase and crystallinity of the prepared film were characterized using an X-ray diffractometer (XRD; Shimadzu, XRD-600) with primary monochromatic high-intensity Cu Kα (λ = 1.541 Å) radiation. The morphology and the chemical composition of deposited materials were investigated using a scanning electron microscope (SEM; JEOL, JSM-6510) coupled with an energy dispersive spectrometer (EDS; Thermo Scientific) analysis. The quantitative analysis of copper and cobalt electrodeposited was performed by flame atomic absorption spectroscopy (FAAS; PerkinElmer, PinAAcle 900T). The flame was composed of synthetic air (10 mL) and acetylene (2.5 mL) at a wavelength of 324.75 nm. X-ray photoelectron spectroscopy (XPS; PHI 5000 VersaProbe II) was performed with incident radiation Al Kα. Surveys and high-resolution spectra were recorded using a pass energy of 0.8 and 0.1 eV, respectively. CasaXPS software was used for data analysis, and the C 1 s peak was employed as a calibration reference.Electrochemical study
All the electrocatalytic reactions were carried out at ambient temperature and pressure using a potentiostat (Metrohm Autolab PGSTAT30N). A homemade three-electrode electrochemical H-cell containing two compartments separated by a cationic exchange membrane was used (Nafion 117). The working and reference (Ag/AgCl, 3 M KCl) electrodes were set on the cathode side, and a counter electrode (platinum mesh) was set on the anode side of the H-cell. 0.1 M Na2SO4 (Sigma-Aldrich, 99.9%) (pH 7.8) aqueous solution was used as the electrolyte. Before each assay, that solution was saturated with N2 (99.99% purity) or CO2 (99.99% purity) gas for 15 min to remove the oxygen gas from the cathodic chamber.After this saturation period, the cell was hermetically closed, and the gaseous products generated at the end of the reaction were collected using a gas-tight syringe (Hamilton) and analyzed on a gas chromatograph (Thermo Trace 1310) equipped with a Carboxen 1010 PLOT capillary column. Argon (99.999%) was used as the carrier gas. The liquid product was measured on a Bruker 600 MHz NMR spectrometer in water suppression mode. After electrolysis, a 540 μL electrolyte was collected and combined with 60 μL of a standard solution comprising D2O (Sigma-Aldrich), DMSO (Sigma-Aldrich, 99.8%), and 3-(trimethylsilyl)propionic-2,2,3,3-d4 acid sodium salt (TSPd4) (Sigma-Aldrich).
ATR-IR spectra were collected with a 6700 Nicolet Fourier transform infrared spectrometer equipped with a mercury cadmium telluride (MCT) detector and a VeeMAX ATR apparatus (Pike Technologies) set at a 60° reflection angle. For each spectrum, 64 scans at a resolution of 4 cm−1 were typically obtained. The background was obtained at open circuit potential (OCP) after 15 min of continuous CO2 purge in the system. A purge of CO2 was kept constant during all the chronoamperometry measurements up to −0.33 V vs. RHE. The spectra are presented in absorbance mode with positive and negative peaks, showing an increase and decrease in the signal, respectively. In all experiments, the working electrode was pressed against a CaF2 prism to form a thin layer, 0.1 M Na2SO4 in D2O was used as a supporting electrolyte, and a Pt mesh was used as an auxiliary electrode. The potential applied to the working electrode was controlled with an Autolab potentiostat (Metrohm).
Results and discussion
Structural characterization
Table 1 shows the elemental concentrations of the ions found in the leached and electrodeposited liquor. These results reveal an ion concentration of 1918.7 mg L−1 in liquor, and 85.68% and 14.32% for Cu and Co, respectively. On the other hand, to determine the deposited elements and their concentration on the substrate surface, a film of the liquor was prepared by electrodeposition28 and then immersed in an acid solution to leach from the electrodeposited material. The elements observed were similar to those found in the leached liquor, but in 30 μg L−1 amounts, and 77.08 and 22.92% for Cu and Co, respectively. The reduction in the Cu/Co ratio observed at the electrode compared to the liquor can be attributed to the higher frequency of applying the potential −0.6 V vs. RHE compared to the potential −0.07 V vs. RHE. It indicates that at more negative potentials, despite the copper concentration being six times higher, the deposition kinetics of cobalt are more pronounced.29 However, it is essential to note that this electrochemical approach effectively maintains the original composition of the liquor on the substrate surface, with only a negligible reduction of ions. As a result, the leading solution can be reused efficiently, given the chosen electrochemical conditions of potential and reaction time.| Ion source | Total | Copper | Cobalt | |||
|---|---|---|---|---|---|---|
| mg L−1 | % | mg L−1 | % | mg L−1 | % | |
| Liquor leaching | 1918.7 | 100 | 1644 | 85.68 | 274.7 | 14.32 |
| Electrodeposited | 0.03 | 100 | 0.0232 | 77.08 | 0.0068 | 22.92 |
Fig. 2 shows the X-ray diffraction (XRD) patterns of the FTO glass substrate covered with the spent Li-ion battery. The pattern shows that the prominent peaks are the same as those observed for the pure FTO background located at 2θ of 28°, 34°, 38°, 52°, and 65°, corresponding to the (110), (101), (200), (211), and (301) planes, respectively. However, additional diffraction peaks are observed at 43°, 50°, and 55°, indicating the existence of mainly metallic Cu particles (PDF 03-065-9026). The low intensity of the peaks indexed to copper and cobalt electrodeposited particles indicates that the electrodeposition method led to the formation of thin films of metal nanoparticles.30 Furthermore, the absence of prominent peaks indexed to cobalt (metal or oxide) suggests that any Co precipitates existing in the prepared samples must either be consistent with the Cu matrix or too small,31 making phase identification unclear. This finding agrees with atomic absorption analysis, which reveals that Cu/Co has a higher fraction of copper species than the cobalt species.
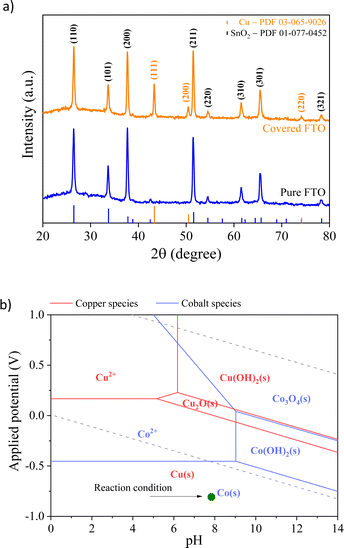 | ||
| Fig. 2 (a) XRD patterns of the pure substrate (FTO) and covered spent LIB particles; (b) superposition of Pourbaix diagrams for Cu and Co, indicating the expected produced phases. | ||
Fig. 3 shows the micrographs of the surface of the pure and Cu/Co nanoparticle-coated FTO substrates. The surface topography of the pure substrate (Fig. 3a) reveals that the FTO layer on the glass surface has a structure similar to a pyramidal shape.32 On the other hand, the electrodeposited particles on the substrate surface show a quasi-spherical morphology, with an average size of 0.27 μm (270 nm), homogeneously distributed over the substrate surface, and a relatively uniform film thickness of 2.64 μm. Moreover, elemental microanalysis confirms that these are nanoparticles of a bimetallic composed of copper and cobalt, in agreement with AAS and XRD data, demonstrating that the proposed synthesis method from spent batteries via electrodeposition is an efficient way to produce spherical Cu/Co composites at the nanoscale.
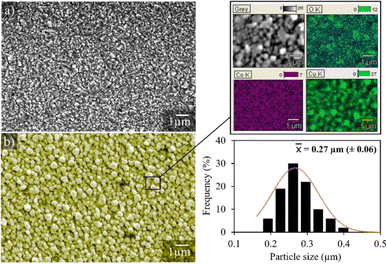 | ||
| Fig. 3 Representative images of the pure FTO substrate (a) and the FTO coated with Cu/Co particles (b). | ||
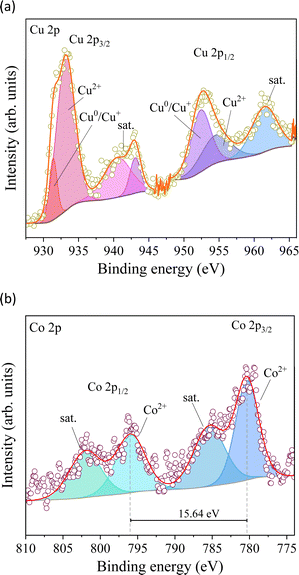
XPS measurements were carried out to understand the chemical surface of the electrodeposited material on the FTO substrate (Fig. 4). Cu 2p has two significant peaks between 934 and 952 eV in the high-resolution spectra (Fig. 4a), ascribed to Cu 2p3/2 and Cu 2p1/2.33 The observed peaks were deconvoluted into two peaks at 933.25 and 931.4 eV attributed to Cu 2p3/2 as well as 954.7 and 952.5 eV attributed to Cu 2p1/2, which are ascribed to the coexistence of Cu2+ and Cu0/Cu+ species on the electrode.34 The Co 2p core level XPS spectra of the prepared material display two prominent peaks ranging from 810 to 774 eV, corresponding to the Co 2p3/2 and Co 2p1/2 core levels (Fig. 4b).35 These signals were deconvoluted into two components each and were verified as a signal assigned to Co2+ and the satellite of Co oxide species. The difference in Co2+ between the 2p3/2 (780.4 eV) and 2p1/2 (796.05 eV) signals reaches 15.64 eV (Fig. 4b), which coincides with elemental cobalt spectra, implying the presence of Co species.36 Furthermore, the strong signal of satellite peaks belongs to Co2+ at 785.42 and 801.9 eV, confirming that cobalt species exist mainly as CoO.35 However, the noisy signal of the analysis does not clarify the presence of other cobalt species but confirms its low content in the electrodeposited material.
Electrocatalytic CO2 reduction
To identify the electrochemical redox properties of Cu/Co composites, cyclic voltammetry (CV) was performed in 0.1 M Na2SO4 with a scan rate of 25 mV s−1. The CV curve of the Cu/Co composite in saturated N2 electrolyte (Fig. 5a) shows two pairs of redox peaks between 0 and 1.0 V (vs. RHE). The redox peaks A1 and C1 can be associated with the oxidation and reduction of copper, respectively. On the other hand, the redox peaks A2 and C2 are related to the oxidation and reduction of cobalt, respectively.37,38 These redox peaks confirm the presence of copper and cobalt species in the prepared electrode, which supports the Pourbaix diagram depicted in Fig. 2b. The reversible profile indicates that the prepared electrode is stable even under structural stress promoted by the electrical stimulus induced by applied external potential.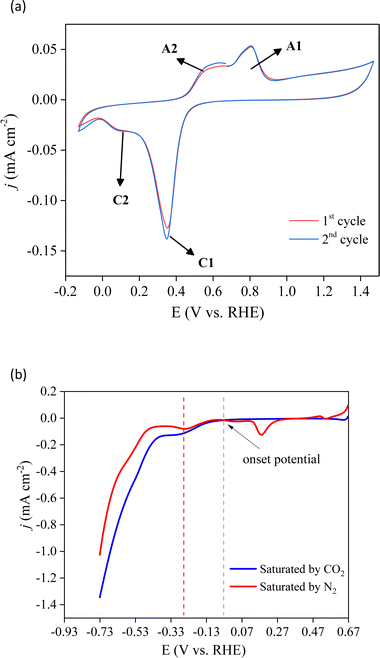 | ||
| Fig. 5 Cyclic (a) and linear (b) voltammetry of the prepared Cu/Co electrode in 0.1 M Na2SO4 under CO2 and N2 atmospheres at 25 mV s−1. | ||
The CO2RR process on Cu/Co electrodes was evaluated using linear scan voltammetry (LSV) curves in N2 and CO2-saturated electrolytes, as illustrated in Fig. 5b. It is possible to observe that the initial potential's current (0.67 V) is higher in the N2 atmosphere. This current is associated with the surface oxidation of copper. Subsequently, the cathodic peak detected at 0.18 V in N2-saturated solutions is attributed to the reduction of copper oxide. 39 Conversely, this reduction feature is not evident under CO2-saturated conditions, suggesting that this process may have been hindered by the adsorption of CO2 on the electrode. Starting from the onset potential at −0.03 V there is similarity in the presence and absence of CO2. One broad cathodic peak ensues, accompanied by an exponential increase in current in both electrolytes. The shoulder peak is ascribed to copper oxide reduction, while the exponential current is associated with water reduction to produce hydrogen gas. Up to ∼−0.33 V (vs. RHE), the cathodic current in the presence of CO2 surpasses that observed under the N2-saturated conditions, indicating the simultaneous occurrence of the CO2RR and H2 production. It indicates that under saturated CO2 and low applied potential, the Cu/Co deposited on the FTO surface selectively acts towards the CO2RR. However, as the applied potential increases, the hydrogen evolution reaction (HER) may become the predominant faradaic process within the studied potential range.
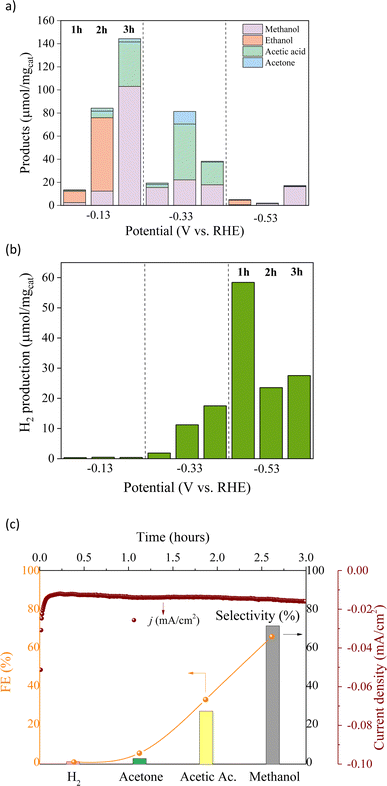
Chronoamperometry analysis (Fig. S1†) was performed further to investigate the performance of Cu/Co catalysts in the CO2RR. As shown in Fig. 6a and b, the CO2RR was performed within the potential range from −0.13 V to −0.53 V (vs. RHE), which decreased the oxygenated liquid products (methanol, acetic acid, acetone, and ethanol). At the same time, the increase in the HER indicates that liquid products are predominantly formed at the lower negative applied potential. Ethanol was the main product at −0.13 V (vs. RHE) with a production of ∼63.52 μmol mg−1 and a selectivity of 75% during the first two hours of the reaction. After three hours of reaction, the cathodic current density increased. In contrast, the ethanol production had been entirely surpassed, leading to other liquid products, yielding methanol (103.03 μmol mg−1), acetic acid (38.54 μmol mg−1), and acetone (2.77 μmol mg−1) with a FE of 65.5%, 32.7%, and 4.7%, respectively. It indicates a change in the reaction mechanism since methanol, the main product in the last hour, is from the formation pathway of ethanol, i.e., acetic acid and acetone may be associated with ethanol previous formation. On the other hand, the methanol should be directly formed by CO2, supposing that ethanol C–C bond breakage is not expected under these conditions. Furthermore, only H2 traces were detected at this potential, confirming the high selectivity for the CO2RR over the HER. At −0.33 V (vs. RHE), the main product was acetic acid with a maximum yield of 48.30 μmol mg−1 with 52% selectivity, in addition to the increase in acetone yield reaching up to 10.94 μmol mg−1. At the highest potential tested, the liquid products severely decreased, while the H2 formation increased from −0.33 to −0.53 V (vs. RHE), reaching a maximum selectivity (92%) at −0.53 V.
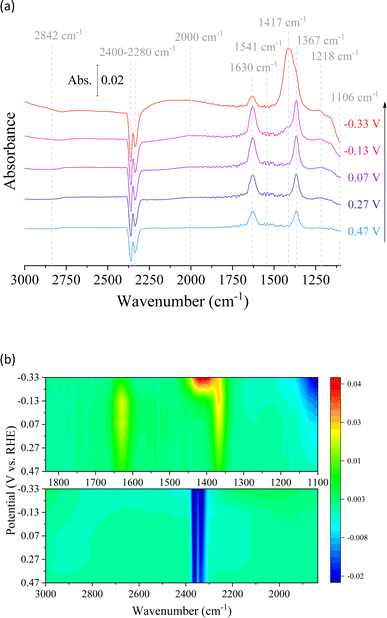
In situ electrochemical ATR-IR spectral measurements were carried out on the Cu/Co composite at different applied potentials in 0.1 M Na2SO4 + D2O under CO2-saturated conditions (Fig. 7). It aimed to examine the reaction intermediates and provide information about the electrocatalytic mechanism during CO2 conversion. The reaction pathway and intermediates of the CO2 catalytic reactions can be proposed based on the intensity and direction of the peaks, with positive peaks indicating chemical generation and negative peaks suggesting consumption. Upon applying potentials, distinct bands corresponding to various species were observed. These species included dissolved CO2 in the liquid, adsorbed CO, carbonate anions in the solution, and OH deformation.40 The reverted band intensity increased at 2400–2280 cm−1 in response to the applied potential, indicating increased CO2 consumption during the CO2RR process.41 At the same time, there is a slight peak at 1541 cm−1 and another at 2842 cm−1, attributed to the deformation of interfacial water molecules and OH adsorption on the surface, respectively. These results agree with electrocatalytic tests that indicate an increase in the catalytic process due to water molecule breakdown at high applied potentials. This result is supported by bicarbonate anions in D2O and well-defined bands at 1630 and 1367 cm−1. Furthermore, the presence of bicarbonate anions in D2O can be visualized (1630 and 1367 cm−1).42 However, the decrease of these signals with increasing potential, associated with an increase in the intensity of the inverted peak suggesting the consumption of the metal-coordinated carbonate (M-CO3) at 1106 cm−1, demonstrates the interaction of the CO2-derived species with the surface of the prepared material, resulting in the production of carbon-based compounds.43 In parallel, it is known that significant signals around 2000 cm−1 indicate the stretching vibration of metal–CO bonds. In addition, the peak observed at 1417 cm−1 can be attributed to *COO− with the two O coordinates as an intermediate for the CO2RR. 41,44 However, sodium formate (1580–1590 cm−1 and 1201 cm−1) in D2O was not detected, indicating its insignificance in the context of the reaction pathway leading to methanol formation and other catalytic reactions due to the unfavorable nature of this pathway.42 Finally, in the FT-IR in situ analysis (Fig. 7a), we can observe a small band at 1218 cm−1 that is assigned to the C–OH stretching, which can be associated with methanol production or the hydrogenated dimer, confirming the favorability of square sites for the formation of the hydrogenated dimer as an intermediate species for acetate or acetone CO2RR on the bimetallic Cu/Co electrodes.44,45
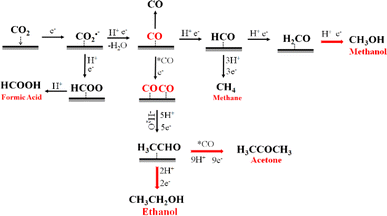
Based on in situ IR spectroscopic measurements, the conversion of the CO2RR mechanism can be explained by reaction intermediates and the products identified. The experimental results validate our hypothesis about the CO2 electroreduction pathway (Fig. 8). The first step involves the adsorption of CO2 onto the surface of the catalyst. It is followed by a reduction process that produces CO2˙−, which can undergo further reduction to become *COOH. The *COOH species can then desorb from the catalyst surface as formic acid (HCOOH) or be transformed into *CO. In this sense, the Cu/Co composite catalysts display a low ability for the synthesis of formic acid (HCOOH), indicating that the electroreduction of CO2 primarily proceeds via the *CO pathway. The adsorption of *CO onto the catalyst surface is a crucial requirement for the reaction to move towards C1 products or longer hydrocarbons, including ethanol and acetone, as also shown in previous results in the literature.46 Significantly, our catalyst exhibits a notable absence of carbon monoxide (CO) generation, while exhibiting high efficiency in producing soluble byproducts such as methanol, ethanol, acetic acid, and acetone. This observation underscores the importance of carbon monoxide as a critical intermediary. A comprehensive analysis of the electroreduction products of CO2 reveals the existence of two different pathways: the formation of methanol and acetic acid; the production of ethanol and acetone. The pathway for methanol and acetic acid synthesis involves the reduction of carbon monoxide (CO) to the *COH intermediate, which possesses the capability to undergo additional transformations leading to the formation of methane (CH4). In accordance with the expected results, our catalyst demonstrates a lack of methane (CH4) generation as a result of its enhanced preference for methanol and acetic acid.
Regarding C2 and C3 products, the chemical pathway occurs by coupling *CO*CO intermediates to H3CCHO*, a key intermediate able to produce ethanol from its reduction. In contrast, acetone is formed via H3CCHO* coupling with *CO, followed by various steps of electron and proton transfers. It should be noted that liquid products need many protons in all CO2 reduction processes. However, this proton reservoir could generate *H species followed by H2 formation (competitive reaction), restricting the system's ability to reduce CO2 effectively. Nonetheless, the protonation steps on the Cu/Co composite surface were selective for CO2 reduction products rather than the HER since they almost had no hydrogen production.
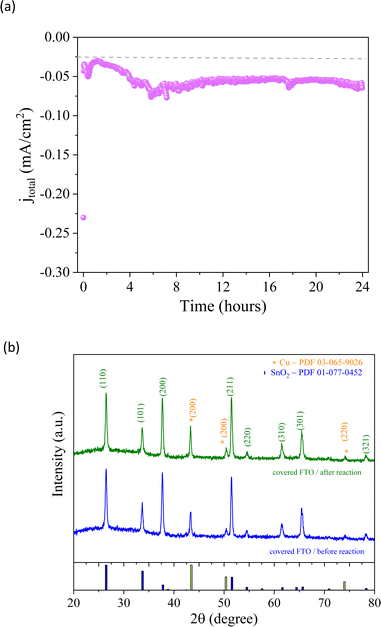
From a kinetic point of view, the two possible intermediate pathways (*COH or *CO*CO) of the CO2 reduction process exhibited the same trends previously discussed. After two hours of reaction, ethanol selectivity was approximately 75%, while methanol production was minimal since the ethanol pathway differs from the methanol pathway. The increase in methanol (71%) and acetic acid (27%), related to the *COH intermediate, and no ethanol production during the last 3rd hour support the possible reaction pathway of the CO2RR suggested above. An investigation was carried out to assess the integrity of the Cu/Co-based material that was produced. The same conditions as those described above were used for the experiment, applying −0.13 V vs. RHE for 24 hours. After the reaction was completed, it was observed that the current remained relatively stable (Fig. 9a), suggesting a potential lack of degradation in the electrode. In order to confirm this observation, XRD analysis (Fig. 9b) was carried out, which showed that there were no structural changes in the catalyst before and after the reaction, indicating that the method of synthesizing nanoparticles based on Cu/Co could be an interesting alternative for catalytic processes.
Conclusions
In summary, we have successfully demonstrated the preparation of electrocatalysts to selectively act on the CO2RR from spent lithium-ion batteries (LIBs). The prepared Cu/Co composite was electrodeposited uniformly on the surface of a FTO substrate, containing regular particle sizes with a high copper loading. Electrocatalytic tests under neutral conditions reveal a potential dependence and selectivity of the conducted reactions since the best condition was the application of −0.13 V (vs. RHE), achieving yields of methanol (103.03 μmol mg−1), acetic acid (38.54 μmol mg−1), and acetone (2.77 μmol mg−1) with a FE of ∼65%, 32.7%, and 4.7%, respectively, and completely suppressing the HER. In situ FTIR experiments reveal that the possible reaction mechanism for the production reveals that copper is the principal catalytic agent. Furthermore, cobalt may imply other reaction pathways, such as blocking the formation of intermediates that would lead to formic acid formation, thus leading to higher efficiency, at low applied potentials, in the production of CH3OH. Finally, the importance of these studies for reusing solid and gaseous wastes to reduce environmental and economic problems by converting CO2 into valuable chemicals and storing renewable energy is worth noting.Author contributions
Jean Cruz: conceptualisation, investigation, methodology, writing – original draft, and writing – review and editing. Ricardo Marques: methodology, validation, and writing – original draft. Gelson da Silva: conceptualisation, investigation, methodology, visualization, writing – original draft, and writing –review and editing. Lucia Mascaro: conceptualisation, funding acquisition, writing – review and editing, supervision, and project administration. Caue Ribeiro: conceptualisation, funding acquisition, methodology, writing – original draft, writing –review and editing, supervision, and project administration.Conflicts of interest
There are no conflicts to declare.Acknowledgements
The authors acknowledge financial support from CNPq (grants# 152607/2022-6, 311769/2022-5, and #406156/2022-0), FAPESP (grants #2022/10255-5, 2020/09628-6, 2018/01258-5, 2017/11986-5, and 2013/07296-2), FINEP (grant #01.22.0179.00), CAPES (Coordination for the Improvement of Higher Education Personnel-Finance Code 001), and Shell and the strategic importance of the support given by ANP (Brazil's National Oil, Natural Gas, and Biofuels Agency) through the R&D levy regulation. We would also like to thank the Agronano Network (Embrapa Research Network) and the São Carlos Institute of Physics at the University of São Paulo (IFSC/USP) for the XPS measurements.References
- United Nations, The 17 Goals, https://sdgs.un.org/goals, accessed 25 April 2023 Search PubMed.
- Z. Liu, Z. Deng, S. Davis and P. Ciais, Nat. Rev. Earth Environ., 2023, 4, 205–206 CrossRef PubMed.
- R. Torres and G. T. Lapidus, Waste Manage., 2016, 57, 131–139 CrossRef CAS PubMed.
- L. Zhang, Z. Xu and Z. He, ACS Sustain. Chem. Eng., 2020, 8, 11596–11605 CrossRef CAS.
- T. Langner, T. Sieber and J. Acker, Sci. Rep., 2021, 11, 6316 CrossRef CAS PubMed.
- V. G. Celante and M. B. J. G. Freitas, J. Appl. Electrochem., 2010, 40, 233–239 CrossRef CAS.
- K. Kim, D. Raymond, R. Candeago and X. Su, Nat. Commun., 2021, 12, 6554 CrossRef CAS PubMed.
- M. Landa-Castro, J. Aldana-González, M. G. Montes de Oca-Yemha, M. Romero-Romo, E. M. Arce-Estrada and M. Palomar-Pardavé, J. Alloys Compd., 2020, 830, 154650 CrossRef CAS.
- Z. Chen, W. Zou, R. Zheng, W. Wei, W. Wei, B.-J. Ni and H. Chen, Green Chem., 2021, 23, 6538–6547 RSC.
- Z. Chen, G. Zhang, L. Du, Y. Zheng, L. Sun and S. Sun, Small, 2020, 16, 2004158 CrossRef CAS PubMed.
- J. Zhao, S. Xue, J. Barber, Y. Zhou, J. Meng and X. Ke, J. Mater. Chem. A, 2020, 8, 4700–4734 RSC.
- L. Fan, C. Xia, F. Yang, J. Wang, H. Wang and Y. Lu, Sci. Adv., 2020, 6, eaay3111 CrossRef CAS PubMed.
- Y. Hori, in Modern Aspects of Electrochemistry, SpringerNew York, New York, NY, 2008, pp. 89–189 Search PubMed.
- P. Yang, R. Wang, H. Tao, Y. Zhang, M.-M. Titirici and X. Wang, Appl. Catal., B, 2021, 280, 119454 CrossRef CAS.
- C. Li, X. Tong, P. Yu, W. Du, J. Wu, H. Rao and Z. M. Wang, J. Mater. Chem. A, 2019, 7, 16622–16642 RSC.
- D. Bhalothia, H.-Y. Liu, S.-H. Chen, Y.-T. Tseng, W. Li, S. Dai, K.-W. Wang and T.-Y. Chen, Chem. Eng. J., 2024, 481, 148295 CrossRef CAS.
- J. Huang, X. Guo, G. Yue, Q. Hu and L. Wang, ACS Appl. Mater. Interfaces, 2018, 10, 44403–44414 CrossRef CAS PubMed.
- H. Jo, M. K. Khan, M. Irshad, M. W. Arshad, S. K. Kim and J. Kim, Appl. Catal., B, 2022, 305, 121041 CrossRef CAS.
- W. Guo, J. Bi, Q. Zhu, J. Ma, G. Yang, H. Wu, X. Sun and B. Han, ACS Sustain. Chem. Eng., 2020, 8, 12561–12567 CrossRef CAS.
- M. Bernal, A. Bagger, F. Scholten, I. Sinev, A. Bergmann, M. Ahmadi, J. Rossmeisl and B. R. Cuenya, Nano Energy, 2018, 53, 27–36 CrossRef CAS.
- J.-P. Grote, A. R. Zeradjanin, S. Cherevko, A. Savan, B. Breitbach, A. Ludwig and K. J. J. Mayrhofer, J. Catal., 2016, 343, 248–256 CrossRef CAS.
- M. Zhang, H. Gong and Y. Yu, Mol. Catal., 2017, 443, 165–174 CrossRef CAS.
- H. Xu, D. Rebollar, H. He, L. Chong, Y. Liu, C. Liu, C.-J. Sun, T. Li, J. V. Muntean, R. E. Winans, D.-J. Liu and T. Xu, Nat. Energy, 2020, 5, 623–632 CrossRef CAS.
- Y. Zhao, H. Wang, X. Li, X. Yuan, L. Jiang and X. Chen, J. Hazard. Mater., 2021, 420, 126552 CrossRef CAS PubMed.
- Y. Zhao, X. Yuan, L. Jiang, J. Wen, H. Wang, R. Guan, J. Zhang and G. Zeng, Chem. Eng. J., 2020, 383, 123089 CrossRef CAS.
- J. H. Clark, T. J. Farmer, L. Herrero-Davila and J. Sherwood, Green Chem., 2016, 18, 3914–3934 RSC.
- M. A. Nascimento, J. C. Cruz, G. D. Rodrigues, A. F. de Oliveira and R. P. Lopes, J. Cleaner Prod., 2018, 202, 264–272 CrossRef CAS.
- M. B. J. G. Freitas, V. G. Celante and M. K. Pietre, J. Power Sources, 2010, 195, 3309–3315 CrossRef CAS.
- L. Mentar, Ionics, 2012, 18, 223–229 CrossRef CAS.
- M. Pak, A. Moshaii, H. Siampour, S. Abbasian and M. Nikkhah, Microchim. Acta, 2020, 187, 276 CrossRef CAS PubMed.
- R. L. Antón, M. L. Fdez-Gubieda, A. García-Arribas, J. Herreros and M. Insausti, Mater. Sci. Eng., A, 2002, 335, 94–100 CrossRef.
- V. Torrisi, M. Censabella, G. Piccitto, G. Compagnini, M. Grimaldi and F. Ruffino, Coatings, 2019, 9, 68 CrossRef.
- F. A. Akgul, G. Akgul, N. Yildirim, H. E. Unalan and R. Turan, Mater. Chem. Phys., 2014, 147, 987–995 CrossRef CAS.
- M. C. Biesinger, Surf. Interface Anal., 2017, 49, 1325–1334 CrossRef CAS.
- Q. Zhang, J. Zuo, L. Wang, F. Peng, S. Chen and Z. Liu, ACS Omega, 2021, 6, 10910–10920 CrossRef CAS PubMed.
- C. Alex, S. Ch. Sarma, S. C. Peter and N. S. John, ACS Appl. Energy Mater., 2020, 3, 5439–5447 CrossRef CAS.
- E. Noormohammadi, S. Sanjabi, F. Soavi and F. Poli, Mater. Renew. Sustain. Energy, 2023, 12, 53–61 CrossRef.
- T. M. de Souza, D. C. B. do Lago and L. F. de Senna, Mater. Res., 2019, 22, e20180272 CrossRef.
- H. M. Yadav and J.-J. Lee, J. Solid State Electrochem., 2019, 23, 503–512 CrossRef CAS.
- X. Cao, D. Tan, B. Wulan, K. S. Hui, K. N. Hui and J. Zhang, Small Methods, 2021, 5, 2100700 CrossRef CAS PubMed.
- S. Zhu, B. Jiang, W.-B. Cai and M. Shao, J. Am. Chem. Soc., 2017, 139, 15664–15667 CrossRef CAS PubMed.
- M. T. Galante, P. V. B. Santiago, V. Y. Yukuhiro, L. A. Silva, N. A. Dos Reis, C. T. G. V. M. T. Pires, N. G. Macedo, L. S. Costa, P. S. Fernandez and C. Longo, ChemCatChem, 2021, 13, 859–863 CrossRef CAS.
- M. F. Baruch, J. E. Pander, J. L. White and A. B. Bocarsly, ACS Catal., 2015, 5, 3148–3156 CrossRef CAS.
- D. Bagchi, J. Raj, A. K. Singh, A. Cherevotan, S. Roy, K. S. Manoj, C. P. Vinod and S. C. Peter, Adv. Mater., 2022, 34, 2109426 CrossRef CAS PubMed.
- E. Pérez-Gallent, M. C. Figueiredo, F. Calle-Vallejo and M. T. M. Koper, Angew. Chem., Int. Ed., 2017, 56, 3621–3624 CrossRef PubMed.
- H. Guzmán, N. Russo and S. Hernández, Green Chem., 2021, 23, 1896–1920 RSC.
Footnote |
| † Electronic supplementary information (ESI) available. See DOI: https://doi.org/10.1039/d4se00368c |
| This journal is © The Royal Society of Chemistry 2024 |

