Pressure-swing absorption and desorption behaviours of ammonia in bis(trifluoromethylsulfonyl)amide salts†
Received
20th June 2024
, Accepted 9th October 2024
First published on 10th October 2024
Abstract
The absorption and desorption behaviours of NH3 in bis(trifluoromethylsulfonyl)amide (TFSA) salts were investigated using the pressure-swing method. The effects of cation species and temperature on the NH3 absorption behaviour of four TFSA salts, namely, Na[TFSA], K[TFSA], Mg[TFSA]2, and Ca[TFSA]2, were evaluated. NH3 was absorbed by these solid TFSA salts, and high NH3 desorption was observed for Na[TFSA] at 473 K and K[TFSA] at 300 K. The NH3 absorption behaviour varied with the cation of the TFSA salt. Crystallographic refinement showed that the crystal lattice of Na[TFSA] expanded and contracted along the c-axis upon NH3 absorption and desorption, respectively, indicating the coordination of NH3 molecules with cation sites between the lattice layers. For the alkaline-earth metal TFSA salts, NH4[TFSA] and amide compounds (Mg(NH2)2 or Ca(NH2)2) were formed after NH3 absorption. Therefore, two absorption processes—coordination and dissociation of NH3—occurred in the TFSA salts.
1 Introduction
For over a century, ammonia (NH3) has been produced, addressing food security as a nitrogen-based fertilizer and securing our livelihood by serving as a feedstock for various chemical products.1,2 However, conventional production (via the Haber–Bosch process) requires a substantial amount of energy because of the requirement of high pressures (5–20 MPa) and temperatures ranging from 673 to 873 K for the synthesis of NH3.1–7 In contrast, Aika et al.8–11 proposed an NH3 production system using a Ru catalyst and selective NH3 absorber. Conventional separations of NH3 involve cryogenic condensation below 240 K,12–14 even though NH3 is obtained from the synthetic reactors at high temperatures (∼473 K).15,16 The cryogenic condensation of high-temperature gases containing NH3 and reactants (H2 and N2) requires a substantial amount of energy, and the subsequent reheating to return the reactant gases to the synthetic reactor results in energy loss.10,11,17–19 The selective NH3 absorber reduces energy losses during NH3 separation, and swift NH3 separation using absorbers enables the synthesis of NH3 under mild conditions such as lower pressures and temperatures because the production rate of NH3 is improved by the prompt circulation of reactant gases.11,17–23 Liu and Aika18–20 confirmed that mixed halide compounds such as CaCl2 and CaBr2 exhibited a high NH3 storage capacity and established the production system for NH3 using these absorbers (the absorber-enhanced Haber–Bosch process). Malmali et al.24–31 demonstrated that NH3 was economically and efficiently produced using the absorber-enhanced Haber–Bosch process. They separated NH3 using halides as the absorber at 453 K and 0.6 MPa and confirmed that the production of NH3 was determined by the circulation rate of reactant gases. The absorber-enhanced Haber–Bosch process reduces the cost and energy consumption required to produce NH3. Although various types of absorbers have been investigated,17–41 the operation of the absorber-enhanced Haber–Bosch process has still not been optimized because of the complex NH3 absorption and desorption mechanisms, such as the discrete stoichiometry of ammine compounds and slow NH3 desorption.37 NH3 is absorbed into halides through the coordination of NH3 with the cation and formation of ammine complexes. Subsequently, it desorbs from halides by dissociation of ammine complexes and diffusion of NH3 into the gas phase.19 The formation and dissociation of ammine complexes are relatively slow. The rates of formation and dissociation of ammine complexes are predominantly determined by the heat of reaction (enthalpy change), which serves as the energy barrier for the absorption and desorption of NH3. The dissociation of many ammine compounds requires a substantial heat of reaction (∼100 kJ mol−1) (Table 1), resulting in a low NH3 desorption rate. This implies that the rate and efficiency of NH3 production are enhanced by improving the NH3 desorption function of the absorber. Malmali et al. desorbed NH3 from an absorber using the temperature-swing method (TSA). Meanwhile, we have developed a high-temperature NH3 absorber to separate NH3 obtained at 473 K from the synthetic reactor. This selective absorber reduced the heat loss during cooling and reheating NH3 and reactant gases, as NH3 is easily separated using the pressure-swing method (PSA). Bis(trifluoromethylsulfonyl)amide (TFSA) salts, which are amide salts with imino groups, have several desirable properties such as nonvolatility, nonflammability, high thermal stability, absorption of NH3, and low solubilities of H2 and N2.42–55 For example, NH3 dissolved in 1-ethyl-3-methyl-imidazolium ([emim]) [TFSA] at 300 K has solubilities of 42.3, 3.36, and 0.527 mmol g−1 at 1.0, 0.4, and 0.1 MPa, respectively.33 The heat of dissolution of NH3 in this TFSA salt (∼10 kJ mol−1) is lower than that required for the formation of ammine complexes (∼100 kJ mol−1), which indicates that the rates of absorption and desorption of NH3 in this TFSA salt are higher than those in halides. Furthermore, TFSA− anions can interact with metal centers either as bidentate ligands or by bridging several metal centers.56 Consequently, alkaline and alkaline-earth metal TFSA salts exhibit layered structures in the solid state, as shown in Fig. 1.56–59 Because the NH3 molecule coordinates with a cationic site,19,23 these solid TFSA salts are expected to absorb NH3 molecules at each cationic site between the lattice layers. In this study, we investigated the absorption/desorption behaviour of NH3 in solid TFSA salts at 473 and 300 K. For four TFSA salts, namely Na[TFSA], K[TFSA], Mg[TFSA]2, and Ca[TFSA]2, the effects of cation species and temperatures on the NH3 absorption behaviour were evaluated using crystallographic and kinetic analyses.
Table 1 NH3 absorption functions of each absorber at the standard state
| Absorber |
Ammine compounds |
Storage capacity |
Enthalpy change |
Reference |
| MgCl2 |
Mg(NH3)Cl2 |
11 mmol g−1 |
−93 kJ mol−1 |
32
|
| Mg(NH3)2Cl2 |
21 mmol g−1 |
−85 kJ mol−1 |
| Mg(NH3)6Cl2 |
63 mmol g−1 |
— |
| CaCl2 |
Ca(NH3)Cl2 |
9 mmol g−1 |
−81 kJ mol−1 |
| Ca(NH3)2Cl2 |
18 mmol g−1 |
−74 kJ mol−1 |
| Ca(NH3)4Cl2 |
37 mmol g−1 |
−83 kJ mol−1 |
| Ca(NH3)8Cl2 |
72 mmol g−1 |
−164 kJ mol−1 |
| CaBr2 |
Ca(NH3)Br2 |
5 mmol g−1 |
−71 kJ mol−1 |
| Ca(NH3)2Br2 |
10 mmol g−1 |
−79 kJ mol−1 |
| Ca(NH3)6Br2 |
20 mmol g−1 |
−182 kJ mol−1 |
| Ca(NH3)8Br2 |
40 mmol g−1 |
−83 kJ mol−1 |
| [emim][TFSA] |
— |
42 mmol g−1 @ 1.0 MPa |
−7 kJ mol−1 |
33
|
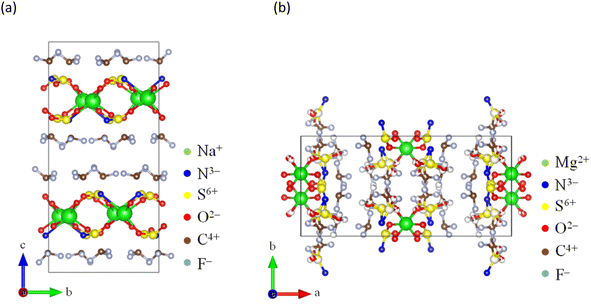 |
| | Fig. 1 Crystal structures of TFSA salts: (a) Na[TFSA]57 and (b) Mg[TFSA]2.59 | |
2 Experimental
The NH3 absorption/desorption cycles of the four TFSA salts were measured using a magnetic suspension balance (MSB-143, Rubotherm GmbH, Germany) and the pressure-swing method. Commercially available TFSA salts such as Na[TFSA] (purity: >98%; SO989), K[TFSA] (purity: >98%; B2543), Mg[TFSA]2 (purity: >97%; M2861), and Ca[TFSA]2 (purity: >97%; C3263) were purchased from Tokyo Chemical Industry Co. Ltd. The experimental setup is described in a separate paper.60 The TFSA powder sample (∼300 mg) was placed in a Pt basket (ø 20 mm × 50 mm) hanging from a magnet, and the basket was suspended inside the furnace via the magnetic force. Before initiating the NH3 absorption/desorption cycle, the TFSA sample was dehydrated at 493 K for 1 h under vacuum as pretreatment. After dehydration, pure NH3 gas (99.9% purity; Resonac Holdings Corp., Tokyo, Japan) was introduced into the furnace. NH3 absorption into the sample was conducted under a NH3 gas pressure of 0.5 MPa for 2 h (pressure-swing absorption), whereas NH3 desorption was conducted under a NH3 gas pressure of 0.1 MPa for 3 h (pressure-swing desorption). The pressure of NH3 was controlled by the temperature of the NH3 tank immersed in an ethanol bath. After NH3 absorption/desorption cycles, the sample powders were characterized using X-ray diffraction (XRD; Ultima IV, Rigaku Corp., Japan). XRD data were obtained in the 2θ range of 5–90° at room temperature, with a step interval of 0.01°, using Cu-Kα radiation, calibrated with Si powder. The obtained diffraction patterns were analysed via the entire powder pattern fitting method,61,62 using PDXL (Rigaku Corp.) and split pseudo-Voigt functions. The corresponding crystal structures were visualized using VESTA.63
3 Results and discussion
3.1 Absorption and desorption behaviours of ammonia
Typical NH3 absorption/desorption cycles for Na[TFSA] at 473 K are shown in Fig. 2. Na[TFSA] exhibits a stable NH3 absorption capacity at 473 K and all pressures (0.1 and 0.5 MPa of NH3 gas). The absorption capacity (Cabs) and desorption capacity (Cdes) of NH3 are defined as follows:| |  | (1) |
| |  | (2) |
where Ws is the sample weight before the NH3 absorption/desorption cycle, Wabs is the sample weight after the absorption cycle, and Wdes is the sample weight after the desorption cycle. MNH3 is the molar weight of NH3. The absorption/desorption rates (vabs and vdes) are defined as the rates at which 80% of the capacity is achieved in each cycle. Na[TFSA] absorbs NH3 (Cabs = 3.05 mmol g−1) and exhibits the highest NH3 desorption capacity (Cdes = 2.83 mmol g−1) among the four TFSA salts. This result indicates that almost all of the absorbed NH3 in Na[TFSA] can be collected via PSA. The XRD patterns of the Na[TFSA] powder before and after the NH3 absorption/desorption cycles are shown in Fig. 3. The observed diffraction patterns are consistent with Na[TFSA] with a monoclinic P21/n structure,57 exhibiting crystal orientation and expansion along the c-axis after the absorption/desorption cycles. This result suggests that the NH3 molecules are absorbed between the lattice layers of Na[TFSA]. As shown in Fig. 4, the NH3 absorption behaviour varies based on the cation species of the TFSA salts. The results of the NH3 absorption/desorption cycles for each TFSA sample are summarized in Table 2. Only a small amount of NH3 is absorbed by K[TFSA] (Fig. 4a). Among the TFSA salts, Mg[TFSA]2 exhibits the highest NH3 absorption capacity (Cabs = 8.29 mmol g−1) at 473 K, although the desorption capacity is low (Cdes = 1.22 mmol g−1) (Fig. 4b and Table 2). The Cabs values increase in the order of Mg[TFSA]2 > Ca[TFSA]2 > Na[TFSA]. This result is consistent with that reported by Liu and Aika.23 They identified the absorption site of NH3 and clarified the absorption mechanism with alkaline or alkaline-earth metal cations using a thermal conductivity detector and FT-IR spectroscopy. NH3 is absorbed at these cation sites by three processes: coulombic attraction, the formation of ammonium ions, and the formation of ammine complexes in cation sites. Therefore, it is likely that NH3 is absorbed at the alkaline or alkaline-earth metal cations of the TFSA salts. Based on the results of Liu and Aika,23 NH3 molecules are absorbed through the coulombic attraction between alkaline or alkaline-earth metal cations and the nitrogen anions of NH3. Therefore, Cabs varies with the surface charge density of the alkaline or alkaline-earth metal cations. After the NH3 absorption/desorption cycle at 473 K, the solid Mg[TFSA]2 liquefies (Fig. 5b). This liquefaction decreases the NH3 desorption from Mg[TFSA]2. The XRD pattern of the solidified Mg[TFSA]2 sample at room temperature is shown in Fig. 6a. The observed diffraction pattern is assigned to NH4[TFSA] with an orthorhombic Pnab structure65 and Mg(NH2)2 with a cubic I41/acd:2 structure,66 indicating that the Mg2+ cations are displaced by NH4+ cations as follows:| | | Mg[TFSA]2 + 4NH3 → 2NH4[TFSA] + Mg(NH2)2 | (3) |
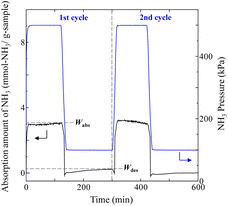 |
| | Fig. 2 Typical NH3 absorption/desorption cycles of Na[TFSA] at 473 K. | |
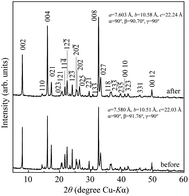 |
| | Fig. 3 XRD patterns of Na[TFSA] before and after NH3 absorption/desorption cycles at 473 K. | |
 |
| | Fig. 4 Typical NH3 absorption/desorption cycles for TFSA salts at 473 K: (a) K[TFSA], (b) Mg[TFSA]2, and (c) Ca[TFSA]2. | |
Table 2 NH3 absorption/desorption measurements at 473 K
| TFSA |
Cycle |
Absorption capacity, Cabs (mmol g−1) |
Absorption rate, vabs (mmol g−1 min−1) |
Desorption capacity, Cdes (mmol g−1) |
Desorption rate, vdes (mmol g−1 min−1) |
|
The results of Na–Y zeolite were referred from ref. 64.
|
| Na[TFSA] |
1st |
3.05 |
0.81 |
2.83 |
0.17 |
| 2nd |
3.03 |
0.19 |
3.03 |
0.20 |
| Mg[TFSA]2 |
1st |
8.29 |
0.36 |
1.22 |
0.02 |
| 2nd |
8.66 |
— |
1.51 |
0.02 |
| Ca[TFSA]2 |
1st |
5.19 |
0.47 |
1.74 |
0.07 |
| 2nd |
5.18 |
0.32 |
1.95 |
0.09 |
| Na–Y zeolitea |
1st |
5.08 |
4.14 |
2.18 |
0.10 |
| 2nd |
5.45 |
0.59 |
2.09 |
0.09 |
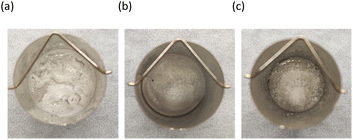 |
| | Fig. 5 Photographs of TFSA salts after the NH3 absorption/desorption cycles at 473 K: (a) Na[TFSA], (b) Mg[TFSA]2, and (c) Ca[TFSA]2 in the Pt basket (ø 20 mm). | |
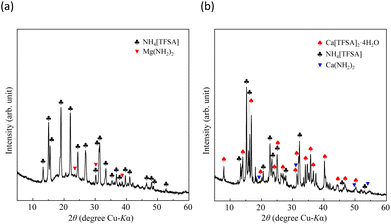 |
| | Fig. 6 XRD patterns of alkaline-earth metal TFSA salts after NH3 absorption/desorption cycles at 473 K: (a) Mg[TFSA]2 and (b) Ca[TFSA]2. | |
Liquefaction of solid salts that absorb excessive NH3 has already been reported.40,60,67 Ammonium (NH4+) cations and amide (NH2−) anions have been observed in bis(fluorosulfonyl)amide (FSA) salts after NH3 absorption, and the FSA salts were liquefied by formation of a eutectic mixture among them.60 Similarly, the liquefaction of the Mg[TFSA]2 salt can be explained by a eutectic phenomenon. This indicates that the NH3 molecule coordinates with the Mg2+ cation between the lattice layers and dissociates in the Mg[TFSA]2 salt. Therefore, two absorption processes, coordination and dissociation, occur in Mg[TFSA]2, as shown in Fig. 7. The XRD pattern of the Ca[TFSA]2 sample shows phases of Ca[TFSA]2,57 NH4[TFSA], and Ca(NH2)2 (ref. 68) (Fig. 6b). Therefore, in addition to Mg[TFSA]2, the above mentioned two absorption processes occur in Ca[TFSA]2. To evaluate the temperature dependence of the NH3 absorption/desorption behaviour of the solid TFSA salts, NH3 absorption/desorption cycles were examined at 300 K (Fig. 8 and Table 3). Cabs was higher at lower temperatures. At 300 K, Na[TFSA] exhibited the highest Cabs. K[TFSA] absorbed NH3 under 0.5 MPa and showed the high desorption function of NH3. All absorbed NH3 was desorbed from K[TFSA] under 0.1 MPa. The difference of NH3 absorption behaviours by temperature can be attributed to the NH3 molecular motion. The NH3 molecular motion was vigorous and Cabs decreased at high temperature (473 K). On the other hand, the absorbed NH3 did not desorb from Mg[TFSA]2 at 300 K (Fig. 8b). The crystal lattice of Na[TFSA] shrank after NH3 absorption/desorption cycles at 300 K (Fig. 10a), implying that the Na[TFSA] lattice expanded during NH3 absorption and shrank during NH3 desorption. Mg[TFSA]2 remained in the solid state after NH3 absorption/desorption cycles at 300 K (Fig. 9). The XRD pattern of the Mg[TFSA]2 sample after cycling at 300 K showed both Mg[TFSA]2 and NH4[TFSA] phases (Fig. 10b). The Mg2+ cations in Mg[TFSA]2 were not entirely displaced by NH4+ cations. Therefore, the absorption process was limited by the dissociation of NH3 in Mg[TFSA]2 at 300 K. Regarding kinetics, the NH3 absorption rate of Na[TFSA] was similar to its NH3 desorption rate. Na[TFSA] exhibited the highest vabs and vdes among the TFSA samples. vabs and vdes values were higher at lower temperatures. In addition, although all TFSA salts except K[TFSA] showed similar NH3 absorption behaviour at 473 K, they exhibited different behaviours at 300 K (Fig. 11). This was caused by the difference in the absorption processes; the absorption into the TFSA salts was limited by the dissociation of NH3 in the salts. The double exponential model used to evaluate the kinetics of the two absorption processes is as follows:69–71
| | W(t) = Acrd![[thin space (1/6-em)]](https://www.rsc.org/images/entities/char_2009.gif) exp(−kcrdt) + Adis exp(−kcrdt) + Adis![[thin space (1/6-em)]](https://www.rsc.org/images/entities/char_2009.gif) exp(−kdist) + C exp(−kdist) + C | (4) |
where
W(
t) is the change in sample weight over time
t after the start of NH
3 absorption, and
kcrd and
kdis are the rate constants for the coordination and dissociation of NH
3, respectively.
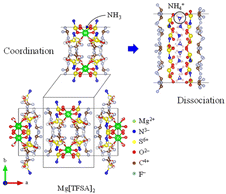 |
| | Fig. 7 Absorption mechanism of NH3 into TFSA salt. | |
 |
| | Fig. 8 Typical NH3 absorption/desorption cycles in various TFSA salts at 300 K: (a) Na[TFSA], (b) K[TFSA], (c) Mg[TFSA]2, and (d) Ca[TFSA]2. | |
Table 3 NH3 absorption/desorption measurements at 300 K
| TFSA |
Cycle |
Absorption capacity, Cabs (mmol g−1) |
Absorption rate, vabs (mmol g−1 min−1) |
Desorption capacity, Cdes (mmol g−1) |
Desorption rate, vdes (mmol g−1 min−1) |
| Na[TFSA] |
1st |
23.34 |
3.61 |
11.77 |
0.53 |
| 2nd |
23.26 |
1.29 |
11.72 |
0.52 |
| K[TFSA] |
1st |
18.48 |
2.56 |
18.37 |
0.63 |
| 2nd |
17.02 |
0.87 |
17.02 |
0.60 |
| Ca[TFSA]2 |
1st |
21.64 |
2.05 |
8.92 |
0.57 |
| 2nd |
22.07 |
1.25 |
8.76 |
0.57 |
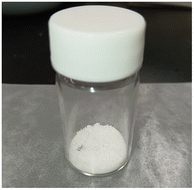 |
| | Fig. 9 A photograph of the Mg[TFSA]2 sample after NH3 absorption/desorption cycles at 300 K. Mg[TFSA]2 sample in the glass bottle (ø 24 mm, 10 mL). | |
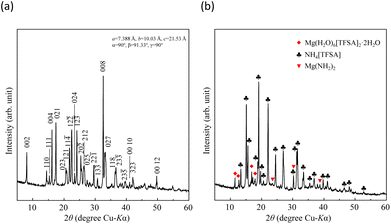 |
| | Fig. 10 XRD patterns of TFSA salts after NH3 absorption/desorption cycles at 300 K: (a) Na[TFSA] and (b) Mg[TFSA]2. | |
 |
| | Fig. 11 Initial stages of NH3 absorption/desorption of TFSA salts: (a) absorption at 473 K, (b) desorption at 473 K, (c) absorption at 300 K, and (d) desorption at 300 K. | |
A
crd and Adis are the frequency factors for the coordination and dissociation, respectively, and C is a constant. The first and second terms on the right side of eqn (4) correspond to the coordination and dissociation of NH3 in the TFSA salts, respectively. The kinetic parameters were obtained by fitting the initial stage of the NH3 absorption curves for each TFSA salt (Fig. 11a and c) using eqn (4), and the values are listed in Tables 4 and 5. The least-squares fitting results are shown in Fig. S1 and S2.† The rate constants of the coordination step are considerably higher than those of the dissociation step (kcrd > kdis), confirming dissociation to be the rate-determining step. The value of kcrd increases and that of kdis decreases with decreasing temperature. For Ca[TFSA]2 at 300 K, kdis is significantly small, suggesting that the dissociation of NH3 in Ca[TFSA]2 is slow at 300 K. Therefore, coordination is the dominant process, whereas dissociation progressed to a lesser extent in the Ca[TFSA]2 salt.
Table 4 Kinetic parameters of NH3 absorption into TFSA salts at 473 K
| TFSA |
A
crd
|
A
dis
|
C
|
k
crd × 10−3 (s−1) |
k
dis × 10−3 (s−1) |
R
2
|
| Na[TFSA] |
−2.13927 |
−2.85738 |
4.996652 |
47.22 |
6.248 |
0.9994 |
| Mg[TFSA]2 |
−3.44905 |
−7.41104 |
10.86009 |
78.91 |
2.623 |
0.9994 |
| Ca[TFSA]2 |
−2.75006 |
−5.69369 |
8.44375 |
62.09 |
2.520 |
0.9991 |
Table 5 Kinetic parameters of NH3 absorption into TFSA salts at 300 K
| TFSA |
A
crd
|
A
dis
|
C
|
k
crd × 10−3 (s−1) |
k
dis × 10−3 (s−1) |
R
2
|
| Na[TFSA] |
−10.4859 |
−27.7007 |
38.1866 |
57.22 |
4.742 |
0.9999 |
| K[TFSA] |
−16.5615 |
−20.9808 |
37.5423 |
19.48 |
1.188 |
0.9997 |
| Mg[TFSA]2 |
−7.29562 |
−9.26933 |
16.54037 |
242.0 |
2.128 |
0.9967 |
| Ca[TFSA]2 |
−7.03838 |
−59.9431 |
66.89941 |
299.2 |
0.893 |
0.9996 |
3.2 Comparison of TFSA salts with zeolites
In our previous study,64 NH3 adsorption and desorption behaviours on zeolites at 473 K were observed by PSA cycling (0.1–0.5 MPa), and their stability for NH3 storage was confirmed. Typical NH3 adsorption and desorption behaviours of Na–Y and A-4 zeolites at 473 K are shown in Fig. S3.† As shown in Table 2, although the NH3 adsorption capacity of the Na–Y zeolite (Cads = 5.08 mmol g−1, 7.16 mol m−3) is higher than that of Na[TFSA] (Cabs = 3.05 mmol g−1, 7.13 mol m−3), the NH3 desorption capacity of the Na–Y zeolite (Cdes = 2.18 mmol g−1, 3.07 mol m−3) is lower than that of Na[TFSA] (Cdes = 2.83 mmol g−1, 6.62 mol m−3). Additionally, the NH3 desorption rate of Na–Y zeolite (vdes = 0.10 mmol g−1 min−1) is lower than that of the Na[TFSA] salt (vdes = 0.17 mmol g−1 min−1). Hence, the NH3 desorption function of the Na–Y zeolite is less than that of Na[TFSA]. These results indicate that zeolites contain non-collectible NH3 during this PSA cycle (0.1–0.5 MPa, collection ratio: 43%). In contrast, almost all the NH3 absorbed by the Na[TFSA] salt is collected (collection ratio: 93%). Therefore, the high NH3 desorption function is an advantage of NH3 separation using TFSA salts. Finally, to evaluate the durability of the Na[TFSA] for NH3 absorption/desorption at 473 K, five NH3 absorption/desorption cycles were conducted (Fig. 12a). Stable NH3 absorption/desorption behaviours were observed, although the baseline of balance was drifted by multiple changes in NH3 pressure. From the cycle performance of the NH3 desorption capacity as a working capacity (Fig. 12b), it was confirmed that Na[TFSA] absorbed and desorbed NH3 in stably and repeatably. Furthermore, even after five NH3 absorption/desorption cycles, Na[TFSA] remained as a sold-state and no other compounds such as NH4[TFSA] were observed (Fig. 12c). From these results, the durability of the Na[TFSA] was confirmed for NH3 absorption/desorption at 473 K.
 |
| | Fig. 12 The results of NH3 absorption/desorption cycles (5 cycles) of Na[TFSA] at 473 K. (a) NH3 absorption/desorption curves, (b) cycle performance of working capacity, and (c) the XRD pattern of the Na[TFSA] sample after five NH3 absorption/desorption cycles. | |
4 Conclusions
The NH3 absorption and desorption behaviours of TFSA salts were investigated using PSA. The effects of the cation species and temperature on the NH3 absorption behaviour were evaluated for four TFSA salts: Na[TFSA], K[TFSA], Mg[TFSA]2, and Ca[TFSA]2. NH3 was absorbed by all of these solid TFSA salts. Among them, Na[TFSA] at 473 K and K[TFSA] at 300 K exhibited high NH3 desorption ability, with NH3 desorption capacities of 2.83 and 18.37 mmol g−1 and collection ratios of 93 and 99%, respectively. The NH3 absorption behaviour depended on the cation species of the TFSA salt. Crystallographic refinement showed that the crystal lattice of Na[TFSA] expanded and contracted along the c-axis during NH3 absorption and desorption, respectively, suggesting high desorption of NH3 molecules from the lattice layers. For alkaline-earth metal TFSA salts, NH4[TFSA] and amide compounds (Mg(NH2)2 or Ca(NH2)2) were formed after NH3 absorption. This indicated that NH3 dissociated in solid TFSA salts. Therefore, two absorption processes, namely, coordination and dissociation of NH3, occurred in the solid TFSA salts. Kinetic analysis confirmed that NH3 dissociation was the rate-determining step for NH3 storage in the salts.
Data availability
The data supporting this article have been included as part of the ESI.†
Author contributions
M. T.: investigation, data curation, visualization, writing – original draft. R. F.: investigation, data curation. J. R.: supervision, funding acquisition, writing – review and editing, revision and suggestions. All the authors participated in discussions of the results and in preparing the manuscript.
Conflicts of interest
There are no conflicts to declare.
Acknowledgements
This research was supported by the Science and Technology Research Partnership for Sustainable Development (SATREPS) in collaboration with the Japan Science and Technology Agency (JST, JPMJSA2104) and the Japan International Cooperation Agency (JICA). The authors gratefully acknowledge support provided by the Research Foundation. We would also like to thank Mr Shun Mashiko and Mr Morihiro Suzuki for their work on the preliminary experiments.
References
- J. W. Erisman, M. A. Sutton, J. Galloway, Z. Klimont and W. Winiwarter, Nat. Geosci., 2008, 1, 636 CrossRef CAS.
- A. Valera-Medina, H. Xiao, M. Owen-Jones, W. I. F. David and P. J. Bowen, Prog. Energy Combust. Sci., 2018, 69, 63 CrossRef.
- K. E. Lamb, M. D. Dolan and D. F. Kennedy, Int. J. Hydrogen Energy, 2019, 44, 3580 CrossRef CAS.
- D. R. MacFarlane, P.-V. Cherepanov, J. Choi, B. H. R. Suryanto, R. Y. Hodgetts, J. M. Bakker, F. M. F. Vallana and A. N. Simonov, Joule, 2020, 4, 1186 CrossRef CAS.
- M. Ravi and J. W. Makepeace, Chem. Sci., 2022, 13, 890 RSC.
- S. Sun, Q. Jiang, D. Zhao, T. Cao, H. Sha, C. Zhang, H. Song and Z. Da, Renewable Sustainable Energy Rev., 2022, 169, 112918 CrossRef CAS.
- P. Mayer, A. Ramirez, G. Pezzella, B. Winter, S. M. Sarathy, J. Gascon and A. Bardow, iScience, 2023, 26, 107389 CrossRef CAS PubMed.
- K. Aika, H. Hori and A. Ozaki, J. Catal., 1972, 27, 424 CrossRef CAS.
- K. Aika, Angew Chem. Int. Ed. Engl., 1986, 25, 558 CrossRef.
- K. Aika and T. Kakegawa, Catal. Today, 1991, 10, 73 CrossRef CAS.
-
K. Aika and H. Kobayashi, CO2 Free Ammonia as an Energy Carrier, Springer, Singapore, 2023 Search PubMed.
- J. Guo and P. Chen, Chem, 2017, 3, 709 CAS.
- Q. Wang, J. Guo and P. Chen, J. Energy Chem., 2019, 36, 25 CrossRef.
- H. Liu, Chin. J. Catal., 2014, 35, 1619 CrossRef CAS.
- P. Wang, F. Chang, W. Gao, J. Guo, G. Wu, T. He and P. Chen, Nat. Chem., 2016, 9, 64 CrossRef PubMed.
- R. Shi, X. Zhang, G. I. N. Waterhouse, Y. Zhao and T. Zhang, Adv. Energy Mater., 2020, 10, 2000659 CrossRef CAS.
- C. Y. Liu and K. Aika, Chem. Lett., 2002, 31, 798 CrossRef.
- C. Y. Liu and K. Aika, Ind. Eng. Chem. Res., 2004, 43, 7484 CrossRef CAS.
- C. Y. Liu and K. Aika, Bull. Chem. Soc. Jpn., 2004, 77, 123 CrossRef CAS.
- C. Y. Liu and K. Aika, Ind. Eng. Chem. Res., 2004, 43, 6994 CrossRef CAS.
- C. Y. Liu and K. Aika, Res. Chem. Intermed., 2002, 28, 409 CrossRef CAS.
- C. Y. Liu and K. Aika, Bull. Chem. Soc. Jpn., 2003, 76, 1463 CrossRef CAS.
- C. Y. Liu and K. Aika, J. Jpn. Pet. Inst., 2003, 46, 301 CrossRef CAS.
- M. Malmali, Y. Wei, A. McCormick and E. L. Cussler, Ind. Eng. Chem. Res., 2016, 55, 8922 CrossRef CAS.
- M. Malmali, G. Le, J. Hendrickson, J. Prince, A. V. McCormick and E. L. Cussler, ACS Sustainable Chem. Eng., 2018, 6, 6536 CrossRef CAS.
- M. Malmali, M. Reese, A. V. McCormick and E. L. Cussler, ACS Sustainable Chem. Eng., 2018, 6, 827 CrossRef CAS.
- C. Smith, M. Malmali, C. Liu, A. V. McCormick and E. L. Cussler, ACS Sustainable Chem. Eng., 2018, 6, 11827 CrossRef CAS.
- D. K. Ojha, M. J. Kale, A. V. McCormick, M. Reese, M. Malmali, P. Dauenhauer and E. L. Cussler, ACS Sustainable Chem. Eng., 2019, 7, 18785 CrossRef CAS.
- B. Lin, T. Wiesner and M. Malmali, ACS Sustainable Chem. Eng., 2020, 8, 15517 CrossRef CAS.
- B. Lin, F. H. Nowrin, J. J. Rosenthal, A. S. Bhown and M. Malmali, ACS Sustainable Chem. Eng., 2023, 11, 9880 CrossRef CAS.
- C. E. Onuoha, M. J. Kale, M. Malmali, P. J. Dauenhauer and A. V. McCormick, Ind. Eng. Chem. Res., 2024, 63, 5608 CrossRef CAS.
-
E. W. Washburn, International Critical Tables of Numerical Data, Physics, Chemistry and Technology 7, McGraw-Hill, NY, 1929 Search PubMed.
- A. Yokozeki and M. B. Shiflett, Ind. Eng. Chem. Res., 2007, 46, 1605 CrossRef CAS.
- T. Aoki, T. Ichikawa, H. Miyaoka and Y. Kojima, J. Phys. Chem. C, 2014, 118, 8412 CrossRef.
- Y. Kojima and M. Yamaguchi, Int. J. Hydrogen Energy, 2020, 45, 10233 CrossRef CAS.
- H. Chu, G. Wu, Z. Xiong, J. Guo, T. He and P. Chen, Chem. Mater., 2010, 22, 6021 CrossRef CAS.
- M. J. Kale, D. K. Ojha, S. Biswas, J. I. Militti, A. V. McCormick, J. H. Schott, P. J. Dauenhauer and E. L. Cussler, ACS Appl. Energy Mater., 2020, 3, 2576 CrossRef CAS.
- C. Shen, P. Wang, L. Shen, X. Yin and Z. Miao, Ind. Eng. Chem. Res., 2022, 61, 8616 CrossRef CAS.
- W. Q. Gong, Y. X. Fu, Y. Zhou, M. S. Sun, Z. M. Li, N. H. Lu and D. J. Tao, Sep. Purif. Technol., 2023, 322, 124304 CrossRef CAS.
- K. Zong and D. Deng, Sep. Purif. Technol., 2024, 349, 127869 CrossRef CAS.
- Y. Cao, K. Jiang and D. Deng, Sustainable Energy Fuels, 2024, 8, 3933 RSC.
- J. Foropoulos and D. D. DesMarteau, J. Am. Chem. Soc., 1982, 104, 4260 CrossRef CAS.
- J. Foropoulos and D. D. DesMarteau, J. Fluorine Chem., 1982, 21, 9 CrossRef.
- L. Xue, D. D. DesMarteau and W. T. Pennington, Angew Chem. Int. Ed. Engl., 1997, 36, 1331 CrossRef CAS.
- P. Johansson, S. P. Gejji, J. Tegenfeldt and J. Lindgren, Electrochim. Acta, 1998, 43, 1375 CrossRef CAS.
- A. Yokozeki and M. B. Shiflett, Appl. Energy, 2007, 84, 1258 CrossRef CAS.
- W. Shi and E. J. Maginn, AIChE J., 2009, 55, 2414 CrossRef CAS.
- J. Palomar, M. Gonzalez-Miquel, J. Bedia, F. Rodriguez and J. J. Rodriguez, Sep. Purif. Technol., 2011, 82, 43 CrossRef CAS.
- J. Bedia, J. Palomar, M. Gonzalez-Miquel, F. Rodriguez and J. J. Rodriguez, Sep. Purif. Technol., 2012, 95, 188 CrossRef CAS.
- Y. Li, M. C. Ali, Q. Yang, Z. Zhang, Z. Bao, B. Su, H. Xing and Q. Ren, ChemSusChem, 2017, 10, 3368 CrossRef CAS PubMed.
- F. Zhong, H. Peng, D. Tao, P. Wu, J. Fan and K. Huang, ACS Sustainable Chem. Eng., 2019, 7, 3258 CrossRef.
- A. Finotello, J. E. Bara, D. Camper and R. D. Noble, Ind. Eng. Chem. Res., 2007, 47, 3453 CrossRef.
- M. Ramdin, T. W. de Loos and T. J. H. Vlugt, Ind. Eng. Chem. Res., 2012, 51, 8149 CrossRef CAS.
- M. Ramdin, S. P. Balaji, J. M. Vicent-Luna, J. J. Gutiérrez-Sevillano, S. Calero, T. W. de Loos and T. J. H. Vlugt, J. Phys. Chem. C, 2014, 118, 23599 CrossRef CAS.
- A. Rivera-Pousa, R. Lois-Cuns, M. Otero-Lema, H. Montes-Campos, T. Méndez-Morales and L. Miguel Varela, J. Chem. Inf. Model., 2024, 64, 164 CrossRef CAS PubMed.
- L. Xue, D. D. DesMarteau and W. T. Pennington, Solid State Sci., 2005, 7, 311 CrossRef CAS.
- K. Matsumoto, T. Matsui, T. Nohira and R. Hagiwara, J. Fluorine Chem., 2015, 174, 42 CrossRef CAS.
- L. Xue, C. W. Padgett, D. D. DesMarteau and W. T. Pennington, Solid State Sci., 2002, 4, 1535 CrossRef CAS.
- G. Veryasov, U. Harinaga, K. Matsumoto and R. Hagiwara, Eur. J. Inorg. Chem., 2017, 2017, 1087 CrossRef CAS.
- M. Tokushige, R. Fujisawa and J. Ryu, Sustainable Energy Fuels, 2024, 8, 397 RSC.
- G. S. Pawley, J. Appl. Crystallogr., 1981, 14, 357 CrossRef CAS.
- H. Toraya, J. Appl. Crystallogr., 1986, 19, 440 CrossRef CAS.
- K. Momma and F. Izumi, J. Appl. Crystallogr., 2011, 44, 1272 CrossRef CAS.
- M. Tokushige and J. Ryu, ACS Omega, 2023, 8, 32536 CrossRef CAS.
- M. G. Davidson, P. R. Raithby, A. L. Johnson and P. D. Bolton, Eur. J. Inorg. Chem., 2003, 2003, 3445 CrossRef.
- H. Jacobs, Z. Anorg. Allg. Chem., 1971, 382, 97 CrossRef CAS.
- L. Gao, H. Fang, Z. Li, X. Yu and K. Fan, Inorg. Chem., 2011, 50, 4301 CrossRef CAS PubMed.
- R. Juza and H. Schumacher, Z. Anorg. Allg. Chem., 1963, 324, 278 CrossRef CAS.
- N. Koga, Y. Goshi, S. Yamada and L. A. Pérez-Maqueda, J. Therm. Anal. Calorim., 2013, 111, 1463 CrossRef CAS.
- İ. Tosun, Int. J. Environ. Res. Public Health, 2012, 9, 970 CrossRef.
- V. Kiss and K. Ősz, Int. J. Chem. Kinet., 2017, 49, 602 CrossRef CAS.
|
| This journal is © The Royal Society of Chemistry 2024 |
Click here to see how this site uses Cookies. View our privacy policy here.  Open Access Article
 *
*


![[thin space (1/6-em)]](https://www.rsc.org/images/entities/char_2009.gif) exp(−kcrdt) + Adis
exp(−kcrdt) + Adis![[thin space (1/6-em)]](https://www.rsc.org/images/entities/char_2009.gif) exp(−kdist) + C
exp(−kdist) + C


