Stimulated-source-independent persistent luminescence phosphor Sr2Ta2O7:Tb3+, Tm3+ for multi-mode anti-counterfeiting applications†
Zexun
Li
a,
Jinmeng
Xiang
*a,
Changheng
Chen
a,
Ziyang
Wu
a,
Minkun
Jin
a,
Xiaoqi
Zhao
b,
Lei
Zhao
 b and
Chongfeng
Guo
 *a
*a
aState Key Laboratory of Photon-Technology in Western China Energy, Institute of Photonics & Photon-Technology, Northwest University, Xi’an 710127, China. E-mail: guocf@nwu.edu.cn; Tel: +86-29-88302661
bSchool of Physics and Opto-Electronic Technology, Baoji University of Arts and Sciences, Baoji, Shaanxi 721016, China
First published on 19th March 2024
Abstract
There is great interest in advancing optical anti-counterfeiting technology for use in information security, but the emission colors of traditional anti-counterfeiting phosphors vary depending on the stimulation source, which diminishes the difficulty of counterfeiting. Persistent luminescence (PersL) phosphors are particularly suitable for anti-counterfeiting applications because of their multimodal luminescence features. Herein, a PersL phosphor Sr2Ta2O7:Tb3+, Tm3+ exhibited emission independence from the stimulation source, and emitted stable and reliable blue-green luminescence in down-conversion luminescence, PersL, up-conversion luminescence, and photo-stimulated luminescence. Depending on the multimodal luminescence features of Sr2Ta2O7:Tb3+/Tm3+ phosphors, numerous patterns were successfully obtained to confirm its excellent anti-counterfeiting ability. This work illustrates the potentiality of the stimulated-source-independent multi-mode anti-counterfeiting long-lasting phosphor Sr2Ta2O7:Tb3+/Tm3+ as a viable strategy for developing highly secure materials.
Introduction
With the rapid development of the online shopping era, counterfeit currencies, securities, luxury products, electronics, foods, and medicaments have widely infiltrated into every corner of our life, across all walks of life. In response to these issues, advanced anti-counterfeiting technologies have been applied to prevent economic losses, health damage, and security threats to society, companies, and individuals.1–3 Among various security techniques such as optical, magnetism, plasmons, laser holography, and markers to curb counterfeiting, luminescent materials offer low-cost color-tunable capability, with high identification and rapid response, and also exhibit rich excitation or stimulation modes.4,5 However, traditional luminescence anti-counterfeiting materials generally emit single-mode down-conversion (DC) or up-conversion (UC) static photoluminescence (PL),6,7 and are highly susceptible to being cracked and counterfeited.8,9 In response to this, luminescent materials have been combined with a variety of stimulation modes using different methods, and multi-mode luminescent anti-counterfeiting materials came into being, which were usually easily copied mixture combinations or possessed a complicated core–shell structure.10,11To further improve the security level of information encryption, more advanced single-phased multimodal luminescent materials have been designed based on their responses to multiple excitation/stimuli sources,12 and they are difficult to imitate due to the integration of numerous excitation modes in one.13 The most popular strategy is integrated up-/down-conversion into one host to achieve various color emissions. For example, the phosphor La2MgGeO6:Bi3+, Er3+ exhibits green UC emission from Er3+ under the excitation of 980 nm or blue DC emission from Bi3+ and green from Er3+ under the excitation of 322 nm near ultraviolet (n-UV) light due to the energy transfer.14 Additionally, Ba2GdTaO6:Mn4+, Er3+ emits yellow-green and yellow UC luminescence from Er3+ under the irradiation of 980- and 1550-nm lasers, respectively, as well as deep red-light emission from Mn4+ under 365 nm excitation.15 Both of these phosphors are excellent for anti-counterfeiting applications though the anti-counterfeiting information remains in the static anti-counterfeiting stage, which is receptive to the introduction of dynamic factors such as persistent luminescence (PersL), thermoluminescence (TL), and temperature in anti-counterfeiting materials to improve the anti-counterfeiting capability or security level.16,17
PersL materials are typical time-dependent dynamic luminescent materials, and have been widely introduced in anti-counterfeiting applications. The time-dependent intensity endows PersL materials with a unique dynamic anti-counterfeiting mode.18,19 PersL phosphors can also be accompanied by photo-stimulated luminescence (PSL) and TL, which enrich their dynamic anti-counterfeiting mode.20 The PersL phosphor Sr3Y2Ge3O12:Tb3+, Er3+ exhibits green DC emission at 550 nm from Tb3+ under ultraviolet (UV) excitation and also shows red UC emission at 660 nm from Er3+ upon irradiation with a 980-nm laser. Thus, this phosphor with static and dynamic emission possesses excellent anti-counterfeiting and information-hiding functions with UC, DC, PersL, PSL, and several stimulation modes of mechano-luminescence (ML).21 However, luminescent anti-counterfeiting materials based on PersL phosphors still face the limitation of excitation source-dependent emission color,22 which weakens the application range of anti-counterfeiting and also increases the difficulty of identification. It is necessary to develop a multiple-mode-stimulated luminescent anti-counterfeiting material based on PersL, in which the emission color does not vary with the excitation source nor with combined dynamic and static emission.
Herein, a persistent luminescence phosphor Sr2Ta2O7:Tb3+ (STO:Tb3+) was synthesized through a solid-state method, and it displays green emission under the excitation of n-UV light and 980-nm near-infrared (NIR) light when stimulated at high temperatures. Furthermore, the PersL performance was greatly improved through co-doping Tm3+ in STO:0.5%Tb3+, which also introduced blue-green UC emission from Tm3+ and energy transfer from Tm3+ to Tb3+ under the excitation of 808-nm laser diodes. What is interesting is that the blue-green emission of STO:0.5%Tb3+,0.7%Tm3+ does not depend on variation of the stimulation mode. The mechanisms of DC, PersL, PSL, and UC were also investigated in detail, and the potential application was evaluated through designing a series of anti-counterfeiting patterns using STO:0.5%Tb3+,0.7%Tm3+. The results of tests indicated that the anti-counterfeiting performance of this compound was outstanding.
Experimental section
Synthesis of luminescent material
To synthesize the samples, a straightforward solid-phase reaction method at high temperature was adopted. The synthesis procedure for Sr2Ta2O7:Tb3+ involved the accurate weighing and grinding of stoichiometric analytical reagent (A. R.) SrCO3, high purity Tb4O7 (99.99%), and Ta2O5 (99.99%) using an agate mortar for 20 minutes. Additionally, 3% H3BO3 (A. R.) was added as a flux. Subsequently, the mixture was transferred into an alumina crucible and pre-sintered at 500 °C for 2 hours, followed by annealing at 1300 °C for 6 hours. Once subjected to heat treatment, the resulting product was finely ground into a powder for subsequent characterization. The synthesis process for Sr2Ta2O7:Tb3+, Tm3+ co-doped samples was the same as that for Sr2Ta2O7:Tb3+, with the only difference being the varied molar ratios of SrCO3 and rare earth oxide raw materials.Characterization
The samples underwent X-ray diffraction (XRD) analysis using a Rigaku-Dmax3C X-ray diffractometer equipped with a Cu target λ = 1.5406 Å. The tube voltage and current were set to 40 kV and 30 mA, respectively. Scanning was performed within the range of 10° ≤ 2θ ≤ 80°, with a step size of 0.02°. The photoluminescence emission (PL), photoluminescence excitation (PLE), and PersL spectra were characterized using an Edinburgh-FLS920 steady-state/transient spectrometer (Edinburgh Instruments, UK). A 450-W Xe lamp was employed as the light source. The thermoluminescence (TL) curves were obtained using an LTTL-3DS instrument (Radiation Tec), with an 80–700 K heating range and a heating rate of 2 K s−1. The element distribution and surface morphology of the samples were analyzed using scanning electron microscopy (SEM, Thermo Scientific-Apreo S), and the microscope was also equipped with an energy-dispersive X-ray spectrometer.Theoretical calculation
The vienna ab initio simulation package (VASP) was utilized for all theoretical calculations. The structural optimization employed a combination of generalized gradient approximation and van der Waals (vdW) correction. The cutoff energy was set at 550 eV, while the convergence criteria for energy and force were established at 10−5 eV and 0.01 eV Å−1, respectively. For the analysis of formation energy, the computation model consisted of a primitive cell comprising 4 Sr, 4 Ta, and 14 O atoms. A k-point sampling grid of 8 × 8 × 8 was used for structure optimization, whereas 13 × 13 × 13 and 10 × 10 × 10 were applied for the free energy of single Tm and Tb atoms, respectively.Results and discussion
Phase identification and crystal structure
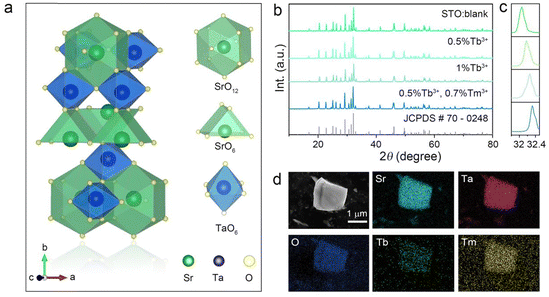
The structure of STO is shown in a diagram in Fig. 1a. It is identified as an orthorhombic system with space group Cmcm (63), in which the Ta atom is coordinated with six oxygen ions to form a TaO6 octahedron site, but two types of Sr are coordinated with six and twelve oxygen atoms, respectively. The TaO6 octahedron sites were connected by corner sharing, and Sr1O6 and Sr2O12 share arris with TaO6 polyhedra.23 To determine the cationic site occupancy tendency of Tb3+ and Tm3+ dopants in STO, the relative radius difference (ΔR) and formation energy (Eform) of Tb3+ and Tm3+ entering into different sites were calculated using eqn (1) and (2), respectively:24,25 | (1) |
| Eform = Edoped − Ebulk + Eatom − Edopant | (2) |
Generally, dopant prefers to enter into sites with close ionic radius and valence. When the coordination number (CN) is six, the ionic radii of Sr2+ (CN = 6, r = 1.18 Å) is closer to that of Tb3+ (CN = 6, r = 0.92 Å) and Tm3+ (CN = 6, r = 0.88 Å) than Ta5+ (CN = 6, r = 0.64 Å), and the relative radius differences between Tb3+/Tm3+ and Sr2+ (CN = 6, ΔR = 22.03/25.42%) are smaller than those of Tb3+/Tm3+ and Ta3+ (CN = 6, ΔR = 43.75/37.50%) (Table S1, ESI†), which indicates that Tb3+ and Tm3+ prefer to enter into Sr1O6 sites rather than TaO6 octahedra.26,27 However, it is difficult to distinguish the selective occupancy tendency between Sr1O6 and Sr2O12 because of the lack of ionic radii in Tb3+ and Tm3+ with a CN of twelve. Therefore, the formation energy (Eform) of different Tb-/Tm-substituted sites was calculated. As listed in Table S2 (ESI†), the Eform of Sr1O6 substituted by Tb/Tm (−0.14/0.21 eV) is much smaller than that of Sr2O12 (0.94/1.24 eV), whereas the Eform of Tb/Tm entering into the Ta site (4.94/4.23 eV) is the highest. Considering the relative radius difference and the formation energy of Tb3+/Tm3+ entering into different sites, Tb/Tm tend to occupy the position of the Sr1O6 site.
XRD patterns of the blank, Tb3+ single-doped, and Tb3+/Tm3+ co-doped STO are representatively presented in Fig. 1b. All Bragg reflections are well indexed to the standard profile of STO (JCPDS #70-0248), but the strongest Bragg reflection (170) gradually shifts to a large angle (in Fig. 1c) with increasing concentration of dopants, confirming that the phases of these samples are pure, and Tb3+/Tm3+ successfully entered the host and occupied the larger Sr2+ lattice sites. Furthermore, particles of the STO:0.5%Tb3+,0.7%Tm3+ phosphor exhibit an irregular shape approximately 1 μm in size. The energy-dispersive X-ray spectroscopy (EDS) results indicate that the corresponding elements Sr, Ta, O, Tb, and Tm are evenly distributed (Fig. 1d), which further illustrates that Tb and Tm were doped into the host.
The band structure (Fig. S1a, ESI†) as well as the PDOS were calculated to reveal the bandgap (Eg) and composition of the conduction band minimum (CBM) and valence band maximum (VBM) (Fig. S1b, ESI†). The calculated Eg is 2.7 eV, and the VBM and CBM mainly consisted of O-2p and Ta-5d orbitals, respectively. According to the UV-Vis absorption spectrum of the matrix, the Eg was fitted to be 4.5 eV, which is greater than the calculated value because of the underestimated atomic interaction by GGA (Fig. S1c, ESI†).28
Luminescent properties of Sr2Ta2O7:Tb3+
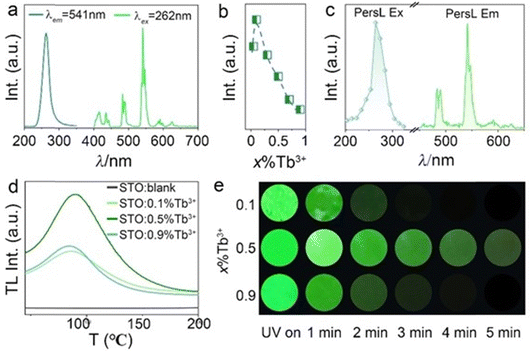
The PL and PLE spectra of 0.5%Tb3+-doped STO are presented in Fig. 2a, in which the PLE spectrum monitored at the dominant green emission peak at 541 nm was composed of a broadband ranging from 220 to 350 nm centered at 262 nm originating from the spin-allowed 4f8 → 4f75d transitions of the Tb3+ ion. The PL spectrum consists of characteristic emissions of two groups of bands: originating transitions from 5D3 and 5D4 to the ground state multiplet 7FJ. The former includes emission that peaked at 415 and 435 nm (5D3 → 7F5,4), while the latter includes emission lines at 490, 541, 590, and 620 nm (5D4 → 7F6,5,4,3).29,30 To determine the optimal content of Tb3+, the varying PL intensity curve was plotted as a function of Tb3+ concentration in samples STO:x%Tb3+ (x = 0.05, 0.1, 0.3, 0.5, 0.7, 0.9). As depicted in Fig. 2b, the emission intensity first increased and then decreased after reaching the maximum at 0.1%.According to the above analysis, Tb3+ substitutes for Sr2+ so that it can enter the STO host, in which defects or traps that contribute to the generation of PersL will probably arise in an unequal substitution. As expected, a bright green PersL appeared after extinguishing the UV lamp. As shown in Fig. 2c, the provided PersL emission and excitation spectra exhibit similarities to the static PL and PLE spectra, thereby suggesting that the PersL and PL emissions originated from the identical luminescent center of Tb3+ ions.
Use of the TL spectrum is one of the most popular methods to characterize the trap depth and density of PersL phosphors, where the trap depth is proportional to the peak temperature of TL, and the PersL duration and intensity are also proportional to the TL intensity. If the trap depth is too shallow, the PersL will not last for a long time; on the contrary, no PersL will appear at room temperature for trap levels that are too deep.31 According to previous results, a strong TL peak located at the range of 50–100 °C was necessary for phosphors with PersL.32 To confirm the appearance of defects or traps, the TL spectra of STO, STO:0.1%Tb3+, STO:0.5%Tb3+, and STO:0.9%Tb3+ are displayed in Fig. 2d, where no TL peak appeared in the blank STO but a strong and broad TL band centered at 85 °C appeared with the doping of Tb3+, which indicated that the appearance of defects or traps was caused by unequal substitution. Simultaneously, the TL intensity increases with increasing Tb3+ concentration and arrives at the maximum of 0.5% without an obvious shift in the TL position, as shown in Fig. S2 (ESI†). This indicates the highest trap concentration and constant trap depth, and implies that the longest interval of PersL appeared at the 0.5% Tb3+ doping concentration. Due to the different emission mechanisms of PL and PersL, PersL quenches at higher concentrations as compared to PL. Additionally, dynamic PersL photos of phosphors with concentrations of x%Tb3+ (x = 0.1, 0.5, 0.9) were captured at different decay times. STO:0.5%Tb3+ exhibited the longest and most intense green PersL emission, which was observed for approximately 5 min after UV light irradiation ceased (Fig. 2e).
PL and PersL properties of STO:Tb3+, Tm3+
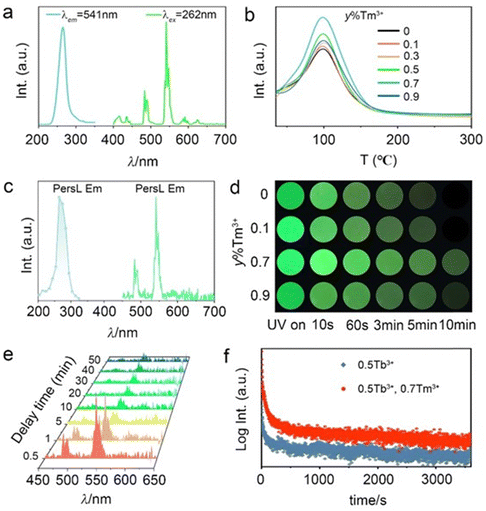
For the PersL phosphor, the electrons captured by traps can be released through heating or NIR photo-stimulation, which enriches the excitation mode as applied in anti-counterfeiting. To further increase the security level, Tm3+ was introduced in STO:0.5%Tb3+ because it increases the defect concentration via un-equivalent substitution of Sr2+ by Tm3+ to improve the persistent luminescence performance. The UC emission of Tm3+ can also be efficiently excited by an 808-nm laser to increase the stimulated mode.The PL and PLE spectra of a co-doped sample of STO:0.5%Tb3+, 0.7%Tm3+ were the same as that of STO:0.5%Tb3+ except for the PL intensity (Fig. 3a and Fig. S3, ESI†). Co-doping with Tm3+ increased the PL intensity of the sample by enhancing lattice distortion to further break the f–f forbidden transitions of Tb3+,33 or by attenuating the cross-relaxation possibility through decreasing the critical distance between Tb3+ ions.34 The degree of distortion of the TbO6 site caused by the substitution of Sr2+ with Tb3+ or Tm3+/Tb3+ was calculated according to eqn (3), based on the structural optimization of Tb3+- or Tm3+/Tb3+-doped STO (Fig. S4, ESI†):35
 | (3) |
To investigate the influence of Tm3+ doping on PersL performance, the TL spectra of STO:0.5%Tb3+, y%Tm3+ are presented in Fig. 3b as a function of the amount of Tm3+. All TL intensities of 0.5%Tb3+−y%Tm3+ co-doped STO were improved by varying degrees without other significant changes in comparison with the singly doped sample STO:0.5%Tb3+, which confirmed that the addition of Tm3+ only increases the density of defects or traps without changing the trap depth or introducing new traps. The PLE and PL spectra of STO:0.5%Tb3+, 0.7%Tm3+ PersL were similar to that of STO:0.5%Tb3+, and this further illustrates that co-doping Tm3+ does not change the PL and PersL center (Fig. 3c). The most intense TL indicates a long duration time, thus the sample STO:0.5%Tb3+, 0.7%Tm3+ exhibited the longest PersL. The corresponding PersL images of STO:0.5%Tb3+, y%Tm3+ (y = 0.1, 0.7, 0.9) also confirmed that the 0.7%Tm3+ co-doped sample exhibited the most intense and the longest PersL in the duration time (Fig. 3d). The PersL spectra of STO:0.5%Tb3+, 0.7%Tm3+ were measured and are displayed in Fig. 3e at different times (0–50 min). A clear PersL characteristic emission peak remained after stopping excitation for 50 min. The PersL phosphorescence decay curves of both samples are also given in Fig. 3f, in which the decay time of STO:0.5%Tb3+, 0.7%Tm3+ is obviously longer than that of STO:0.5%Tb3+.
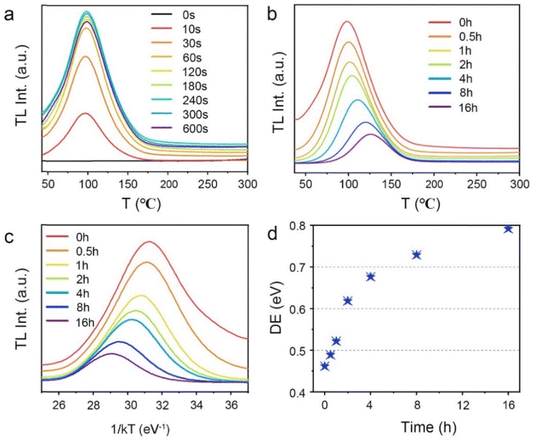
To comprehensively increase our understanding of the PersL mechanism, irradiation duration-dependent TL spectra of STO:0.5%Tb3+,0.7%Tm3+ are presented in Fig. 4a. It was found that as the stimulation time was prolonged, the TL intensity rapidly increased, and then remained basically stable with an imperceptible change, which indicated that the traps quickly filled with electrons and reached saturation when charging for approximately 240 s. As the irradiation continued, the electrons were more likely to immediately recombine with the emission center to produce luminescence instead of being caught by the traps. In addition, the wide span of the TL curves in Fig. 4a suggests that the depths of the traps are continuously distributed, which can be further demonstrated through the release of electrons from the traps. Thus, the TL spectra of STO:0.5%Tb3+,0.7%Tm3+ were measured with different decay times from 0 to 16 h after pre-stimulation for 240 s with a 254-nm UV lamp (in Fig. 4b). The TL peak gradually moved toward high temperature, and the intensity decreased with the increase in temperature, which indicated that the traps in the PersL phosphor were continuously distributed. Moreover, the trap depth distribution of the STO:0.5%Tb3+,0.7%Tm3+ phosphor was obtained by fitting with the Arrhenius equation, in which the initial rise analysis method was selected to obtain the required physical parameters:36–38
 | (4) |
![[thin space (1/6-em)]](https://www.rsc.org/images/entities/char_2009.gif) ln(I) vs. 1/kT coordinates. A plot of the trap depth as a function of decay times is given in Fig. 4d. With the decay time increasing from 0 to 16 h, the trap depths of the STO:0.5%Tb3+,0.7%Tm3+ phosphor were calculated to be 0.46, 0.49, 0.52, 0.61, 0.67, 0.73, and 0.79 eV. The gradual increase in the trap depth further revealed that the trap in the STO:0.5%Tb3+,0.7%Tm3+ phosphor is wide with a continuous depth distribution.
ln(I) vs. 1/kT coordinates. A plot of the trap depth as a function of decay times is given in Fig. 4d. With the decay time increasing from 0 to 16 h, the trap depths of the STO:0.5%Tb3+,0.7%Tm3+ phosphor were calculated to be 0.46, 0.49, 0.52, 0.61, 0.67, 0.73, and 0.79 eV. The gradual increase in the trap depth further revealed that the trap in the STO:0.5%Tb3+,0.7%Tm3+ phosphor is wide with a continuous depth distribution.
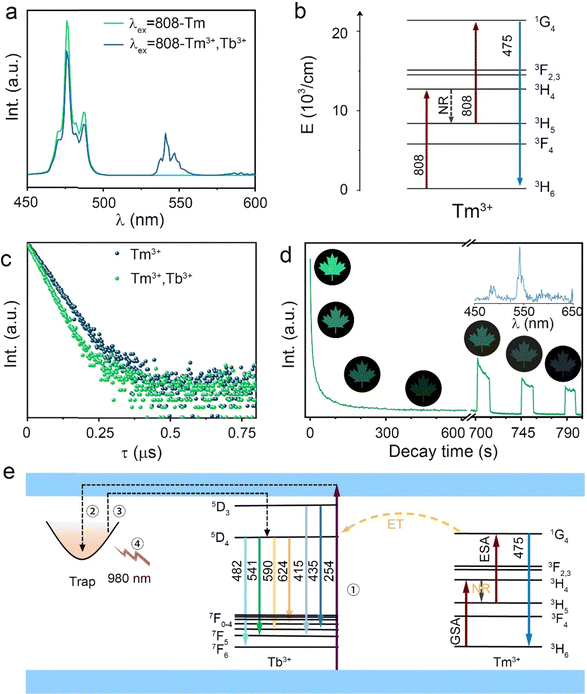
As mentioned above, Tm3+ ions can also realize the UC process to increase the anti-counterfeiting mode apart from increasing the trap concentration.39,40 The UC emission spectra of STO:0.7%Tm3+ and STO:0.5%Tb3+,0.7%Tm3+ are displayed in Fig. 5a with the irradiation of an 808-nm laser, in which the UC spectrum of STO:0.7%Tm3+ consists of characteristic blue emissions (475 nm) that originated from 1G4 → 3H6, while the spectrum of the STO:0.5%Tb3+,0.7%Tm3+ sample also includes a green emission (541 nm) that originated from 5D4 → 7F5 of Tb3+ ions in addition to the blue emission from Tm3+. The mechanism of UC luminescence was also investigated to understand the possible UC processes. The double logarithmic curve fitting of UC emission intensity I(UC) related to 808-nm laser pump power density (P) was carried out (in Fig. S5, ESI†), which can be expressed as:41
| I(UC) ∝ Pn | (5) |
Fig. 5b shows the possible UC process in the Tm3+-doped STO system, in which two phonons were involved with the excitation of the 808-nm laser. First, the electrons located at the ground state energy level (3H6) transit to the intermediate state energy level 3H4 (Tm3+) through the ground state absorption (GSA) process: 3H6 + 808-nm photon → 3H4.42 Next, electrons at 3H4 transferred to the 3H5 energy level by a non-radiative relaxation (NR) process, and then jumped to 1G4 energy level states through the excited states absorption (ESA) process: 3H5 + 808-nm photon → 1G4. Subsequently, blue emission at approximately 475 nm was achieved from the 1G4 → 3H6 transition. In phosphor STO:0.5%Tb3+,0.7%Tm3+, the 5D4 level of Tb3+ was populated via energy transfer (ET) from the 1G4 excited energy level of Tm3+,43 and this can be proved by measuring the fluorescence lifetime of Tm3+, which peaked at 475 nm. The fluorescence decay curves of Tm3+ ion emission (λem = 475 nm) in Tm3+ singly doped and Tm3+-Tb3+ co-doped STO are illustrated in Fig. 5c. They can be well fitted by eqn (8), a double exponential equation, as follows:44
 | (6) |
 | (7) |
The calculated τavg decreased from 6.16 ms for a Tm3+-single doped sample to 4.66 ms for a Tb3+−Tm3+ co-doped sample (Fig. 5c). The ET efficiency from Tm3+ to Tb3+ was calculated based on the following formula:
 | (8) |
Although the 808-nm laser can achieve UC and PSL processes in the STO:0.5%Tb3+,0.7%Tm3+ sample, the higher energy of 808 nm causes the electrons in the deep traps to be excited earlier in the UC process, and thus, PSL and UC occur at the same time, which prevents the PSL process from being observed. The 980-nm laser, which has a lower energy, was used as the light source for the PSL process, while 808 nm was used to realize only the UC process. Because the process of PSL is similar to that of PersL, the function of the 980-nm laser is the same as that of thermal stimulation to excite the electrons stored in the trap. Then, the electrons escape and return to the luminescent center Tb3+ through CBs to emit PersL/PSL light.46
The spectral shapes produced by the two processes are very similar, and the PSL emission spectrum is shown in the inset of Fig. 5d. In addition, after pre-irradiating STO:0.5%Tb3+,0.7%Tm3+ for 240 s, the PersL lasted approximately 10 min and then became nearly invisible (L < 0.32 mcd m−2). However, PersL can be repeatedly remotivated by a 980-nm laser so that emission continued for an additional 30 s (Fig. 5d). The anti-counterfeiting pattern continued in subsequent repetitions until the intensity became nearly constant during excitation, indicating that the electrons in the deep trap have been fully released. Thus, the PSL process efficiently enriches anti-counterfeiting applications.
A possible mechanism for PersL in the STO:Tb3+, Tm3+ phosphor is illustrated in Fig. 5e, in which the electrons in the valence band (VB) and the ground state of Tb3+ are excited to the conduction band (CB) (process 1) under 254-nm UV lamp excitation. Some electrons are subsequently captured by the traps close to the bottom of the CB (process 2), and the remainder of the electrons are returned to the ground state energy level through the luminescent center Tb3+, which results in green DC luminescence. Traps with different depths can be charged when stimulated because the traps in the STO:Tb3+, Tm3+ phosphor are wide with continuous depth. After stopping the excitation, the DC luminescence immediately stops, while the electrons ensnared in the trap escape under the external thermal disturbance and return to the 5D4 state of Tb3+ through CBs, emitting 541-nm PersL (process 3). When nearly all the electrons stored in the shallow trap escaped, the PersL became nearly invisible (L < 0.32 mcd m−2), but some electrons still remained in the deep traps, which can be stimulated by a 980-nm laser and returned to the 5D4 state to generate PSL (process 4). A hypothesis has been proposed regarding the mechanism used by Tb to achieve PersL based on previous studies.47–49 Under a 254-nm UV lamp, the above process can be triggered, and is expressed by the following formula:
| Tb3+ + hv ⇌ (Tb3+)* ⇌ Tb4+ + e− | (9) |
Anti-counterfeiting applications
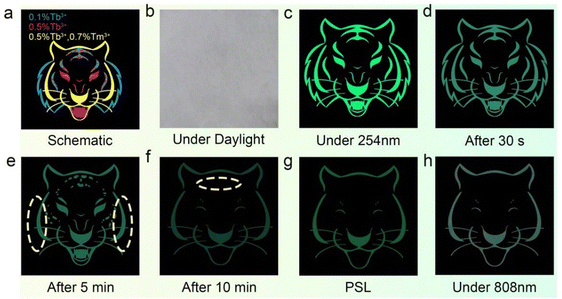
Based on the PL, PersL, PSL, and UC properties of STO:0.5%Tb3+,0.7%Tm3+, an anti-counterfeiting application utilized three phosphors: STO:0.1%Tb3+, STO:0.5%Tb3+, and STO:0.5%Tb3+,0.7%Tm3+. The cat, leopard, and tiger patterns were printed using STO:0.5%Tb3+,0.7%Tm3+, STO:0.5%Tb3+, and STO:0.1%Tb3+ phosphors, respectively (Fig. 6a). The anti-counterfeiting pattern is white and indistinguishable under daylight (Fig. 6b), while only the tiger head appeared under the irradiation of the 254-nm UV lamp because Tb3+ is at the luminescent center of all these phosphors (Fig. 6c). After turning off the illumination for 30 seconds, the largest tiger head pattern appeared because all the patterns show green PersL (Fig. 6d). After ceasing excitation for 5 min, only the leopard head can be observed in Fig. 6e because the beard of the tiger head disappears to the naked eye, which occurred because the STO:0.1%Tb3+ phosphor has the shortest PersL time, and thus, the tiger head faded faster than the other patterns. Because the STO:0.5%Tb3+,0.7%Tm3+ phosphor has a stronger PersL than that of the STO:0.5%Tb3+ phosphor, the leopard spots initially faded, resulting in the pattern appearing to be a cat head to the naked eye after 10 min (Fig. 6f). The above three processes (Fig. 6d–f) vividly demonstrate the dynamic evolution of the ‘tiger-leopard-cat’ pattern.In addition, the entire pattern dimmed after excitation was stopped for 15 min, but the cat head was once again obtained in Fig. 6g through the PSL mode using a 980-nm laser for excitation. Using the 808-nm laser to irradiate the pattern also can result in obtaining the cat head through the UC process, which does not depend on pre-irradiation with a 254-nm UV lamp (Fig. 6h). These methods increase the means of reading anti-counterfeiting patterns and significantly improve practical applications. This multi-mode emission phosphor with the ability to participate in dynamic and static anti-counterfeiting demonstrates its excellent potential for anti-counterfeiting applications, especially considering the heightened sensitivity of the human eye to green light.
Conclusion
In summary, the STO:Tb3+, Tm3+ phosphor with stimulated-source-independent luminescence properties was obtained, in which the PL, PersL, PSL, and UC processes can be realized. The STO:Tb3+, Tm3+ phosphor emitted green light at 541 nm under 254-nm UV lamp excitation and exhibited green PersL behavior at room temperature. The introduction of Tm3+ ions increased the density of traps and also enabled the phosphor to show UC processes under 808-nm NIR laser excitation. By prolonging the recorded time, a multi-mode anti-counterfeiting technique was achieved based on the difference in carrier release efficiency in shallow traps. PSL emission with a peak at 541 nm was achieved when stimulated by a 980-nm laser. Therefore, a multi-mode monochromatic anti-counterfeiting material with PL, PersL, PSL, and UC behaviors was realized based on the emission colors of the STO:Tb3+, Tm3+ phosphor, which is stimulated-source-independent, and offers a fresh approach for developing a multi-mode monochromatic emission system that can successfully enhance security and anti-counterfeiting capabilities in encoding technology.Conflicts of interest
There are no conflicts to declare.Acknowledgements
This work was supported by the National Natural Science Foundation of China (No. 12374383, 11974278) and the Youth Innovation Team of Shaanxi Universities (No. 23JP167).References
- K. Huang, N. Le, J. S. Wang, L. Huang, L. Zeng, W. Xu, Z. Li, Y. Li and G. Han, Adv. Mater., 2022, 34, 2107962 CrossRef CAS PubMed.
- Y. Tang, M. Deng, M. Wang, X. Liu, Z. Zhou, J. Wang and Q. Liu, Adv. Opt. Mater., 2023, 11, 2201827 CrossRef CAS.
- J. Zhang, Z. Wang, X. Huo, X. Meng, Y. Wang, H. Suo and P. Li, Laser Photonics Rev., 2023, 17, 202300751 Search PubMed.
- H. Peng, S. Bi, M. Ni, X. Xie, Y. Liao, X. Zhou, Z. Xue, J. Zhu, Y. Wei, C. N. Bowman and Y. Mai, J. Am. Chem. Soc., 2014, 136, 8855–8858 CrossRef CAS PubMed.
- J. Sang, J. Zhou, J. Zhang, H. Zhou, H. Li, Z. Ci, S. Peng and Z. Wang, ACS Appl. Mater. Inter., 2019, 11, 20150–20156 CrossRef CAS PubMed.
- J. Andres, R. D. Hersch, J. E. Moser and A. S. Chauvin, Adv. Funct. Mater., 2014, 24, 5029–5036 CrossRef CAS.
- J. M. Meruga, W. M. Cross, P. S. May, Q. Luu, G. A. Crawford and J. J. Kellar, Nanotechnology, 2012, 23, 395201 CrossRef PubMed.
- X. Zhang, X. Hou, J. Gao, Z. Wang, X. Zhao, C. Xu and D. Gao, J. Mater. Chem. C, 2023, 11, 16631–16637 RSC.
- T. Sun, B. Xu, B. Chen, X. Chen, M. Li, P. Shi and F. Wang, Nanoscale, 2017, 9, 2701–2705 RSC.
- X. Zhou, S. Zhang, K. Han, J. Jin, Y. Sun and Z. Xia, Adv. Opt. Mater., 2023, 2302429 CrossRef.
- M. Deng, X. Cao, Y. Tang, Z. Zhou, L. Liu, X. Liu, P. Zhang, L. Chang, H. Ruan, X. Guo, J. Wang and Q. Liu, Adv. Photonics, 2023, 5, 026001 CAS.
- Y. Duan, S. Fu, Z. Wang, S. Xu and J. Zhang, J. Mater. Chem. C, 2023, 11, 6004–6009 RSC.
- X. Zhou, L. Ning, J. Qiao, Y. Zhao, P. Xiong and Z. Xia, Nat. Commun., 2022, 13, 7589 CrossRef CAS PubMed.
- Y. Chen, J. Lin, J. Fu, R. Ye, L. Lei, Y. Shen, D. Deng and S. Xu, J. Lumin., 2022, 252, 119404 CrossRef CAS.
- M. Jin, Y. Wu, Z. Zhang, J. Xiang and C. Guo, Opt. Laser Technol., 2022, 152, 108144 CrossRef CAS.
- T. Lyu, P. Dorenbos and Z. Wei, Chem. Eng. J., 2023, 461, 141685 CrossRef CAS.
- T. Lyu, P. Dorenbos, C. Li, S. Li, J. Xu and Z. Wei, Chem. Eng. J., 2022, 435, 135038 CrossRef CAS.
- K. Huang, X. Dou, Y. Zhang, X. Gao, J. Lin, J. Qu, Y. Li, P. Huang and G. Han, Adv. Funct. Mater., 2021, 31, 2009920 CrossRef CAS.
- S. Wang, Z. Song and Q. Liu, J. Mater. Chem. C, 2023, 11, 48–96 RSC.
- S. Liu, H. Cai, S. Zhang and Q. Liu, Mater. Today Chem., 2022, 24, 100806 CrossRef CAS.
- H. Guo, T. Wang, X. Zhu, H. Liu, L. Nie, L. Guo, T. Gu, X. Xu and X. Yu, J. Colloid Interface Sci., 2023, 640, 719–726 CrossRef CAS PubMed.
- T. Lyu, P. Dorenbos and Z. Wei, Laser Photonics Rev., 2023, 17, 2300323 CrossRef CAS.
- N. Ishizawa, F. Marumo, T. Kawamura and M. Kimura, Acta Crystallogr., Sect. B: Struct. Crystallogr. Cryst. Chem., 1976, 32, 2564–2566 CrossRef.
- M. J. Gillan, J. Phys.: Condens. Matter, 1989, 1, 689 CrossRef CAS.
- J. Xiang, J. Zheng, Z. Zhou, H. Suo, X. Zhao, X. Zhou, N. Zhang, M. S. Molokeev and C. Guo, Chem. Eng. J., 2019, 356, 236–244 CrossRef CAS.
- B. Zhang, J. Zhang, Y. Guo, J. Wang, J. Xie, X. Li, W. Huang, L. Wang and Q. Zhang, J. Alloys Compd., 2019, 787, 1163–1172 CrossRef CAS.
- C. Wang, M. Deng, Y. Tang, T. Sun, M. Wang, J. Wang, Z. Zhou and J. Wang, J. Phys. Chem. Lett., 2023, 14, 6386–6394 CrossRef CAS PubMed.
- I. Hisayoshi, T. Takao, Y. Takeshi and H. Kimihiko, J. Chem. Phys., 2001, 115, 3540–3544 CrossRef.
- C. Guo, X. Ding, H. J. Seo, Z. Ren and J. Bai, Opt. Laser Technol., 2011, 43, 1351–1354 CrossRef CAS.
- L. Lei, M. Yi, Y. Wang, Y. Hua, J. Zhang, P. N. Parasd and S. Xu, Nat. Commun., 2024, 15, 1140 CrossRef CAS PubMed.
- M. Deng, Y. Tang, J. Chen, Y. Tang, J. Wang, T. Sun, M. Wang, J. Zhu, Z. Zhou and J. Wang, J. Phys. Chem. Lett., 2023, 14, 3818–3825 CrossRef CAS PubMed.
- C. Guo, Q. Tang, C. Zhang, D. Huang and Q. Su, J. Luminescence, 2007, 126, 333–338 CrossRef CAS.
- S. W. S. McKeever, Thermoluminescence of solids, Cambridge University Press, 1985 Search PubMed.
- G. Blasse and A. Bril, Philips Res. Rep., 1967, 22, 481–504 CAS.
- J. Rodriguez-Carvajal, M. Hennion, F. Moussa and A. H. Moudden, Phys. Rev. B: Condens. Matter Mater. Phys., 1998, 57, R3189 CrossRef CAS.
- P. Bräunlich, J. Appl. Phys., 1967, 38, 2516–2519 CrossRef.
- Z. Zhou, X. Wang, X. Yi, H. Ming, Z. Ma and M. Peng, Chem. Eng. J., 2021, 421, 127820 CrossRef CAS.
- K. V. d Eeckhout, A. J. J. Bos, D. Poelman and P. F. Smet, Phys. Rev. B: Condens. Matter Mater. Phys., 2013, 87, 045126 CrossRef.
- L. Lei, Y. Wang, W. Xu, R. Ye, Y. Hua, D. Deng, L. Chen, P. N. Parasd and S. Xu, Nat. Commun., 2022, 13, 5739 CrossRef CAS PubMed.
- J. Li, B. Lei, J. Qin, Y. Liu and X. Liu, J. Am. Ceram. Soc., 2013, 96, 873–878 CrossRef CAS.
- Y. Li, C. Chen, M. Jin, J. Xiang, J. Tang, X. Zhao, J. Zheng and C. Guo, J. Lumin., 2022, 247, 118915 CrossRef CAS.
- J. Ding, C. Li, L. Zhu, D. Zhao, J. Li and Y. Zhou, Ceram. Int., 2022, 48, 8779–8782 CrossRef CAS.
- X. Xue, M. Thitsa, T. Cheng, W. Gao, D. Deng, T. Suzuki and Y. Ohishi, Opt. Express, 2016, 24, 26307–26321 CrossRef CAS PubMed.
- J. Xiang, J. Zheng, X. Zhao, X. Zhou, C. Chen, M. Jin and C. Guo, Mater. Chem. Front., 2022, 6, 440–449 RSC.
- C. Chen, J. Xiang, Y. Chen, M. Jin, J. Zheng, N. Zhang and C. Guo, Ceram. Int., 2022, 48, 1851–1856 CrossRef CAS.
- X. Chen, Y. Li, K. Huang, L. Huang, X. Tian, H. Dong, R. Kang, Y. Hu, J. Nie, J. Qiu and G. Han, Adv. Mater., 2021, 33, 2008722 CrossRef CAS PubMed.
- V. Chernov, R. Meléndrez, M. P. Montero, W. M. Yen and M. B. Flores, Radiat. Meas., 2008, 43, 241–244 CrossRef CAS.
- Y. Li, M. Gecevicius and J. Qiu, Chem. Soc. Rev., 2016, 45, 2090–2136 RSC.
- J. Xu, J. Ueda and S. Tanabe, J. Mater. Chem. C, 2016, 4, 4380–4386 RSC.
Footnote |
| † Electronic supplementary information (ESI) available. See DOI: https://doi.org/10.1039/d4tc00732h |
| This journal is © The Royal Society of Chemistry 2024 |

