Rational decoration of porous organic polymers with silver nanoparticles for strategic reduction of hazardous nitroaryl compounds†
Mohammed G.
Kotp
a,
Ahmed F. M.
EL-Mahdy
 a and
Shiao-Wei
Kuo
 *ab
*ab
aDepartment of Materials and Optoelectronic Science, Center for Functional Polymers and Supramolecular Materials, National Sun Yat-Sen University, Kaohsiung, 80424, Taiwan. E-mail: kuosw@faculty.nsysu.edu.tw
bDepartment of Medicinal and Applied Chemistry, Kaohsiung Medical University, Kaohsiung 807, Taiwan
First published on 14th November 2024
Abstract
Porous organic polymers (POPs) have garnered significant attention across various industries due to their promising physicochemical properties. In this study, we employ the classical Friedel–Crafts alkylation strategy to synthesize two types of porous organic polymers, namely Py–CH POP and TPA–CH POP, utilizing chloranil (CH), pyrene (Py), and triphenylamine (TPA) as building blocks. The Py–CH POP exhibits coaxial-like morphologies, uniform micropores, and a moderate surface area of up to 822 m2 g−1, along with excellent thermal stability, recording a char output of 69.6 wt%. Notably, these CH POPs contain dynamic hydroxyl groups that can effectively attract Ag+ ions from silver nitrate solutions and facilitate their reduction into silver nanoparticles, resulting in the formation of Ag@Py–CH and Ag@TPA–CH POP nanocomposites. These nanocomposites serve as efficient nano-catalysts for the reduction of hazardous p-nitrophenol (p-NP) to the safer p-aminophenol (p-AP) at ambient temperature. Importantly, the Ag@Py–CH and Ag@TPA–CH POP nanocomposites demonstrate comparable normalized reduction rates of p-NP, reaching up to 65.3 mg s−1. The quaternary amine sites in the Ag@TPA–CH POP nanocomposites play a crucial role in this catalytic reaction, enhancing interactions with the phenolic hydroxyl groups of p-NP and thereby accelerating the reduction process compared to Ag@Py–CH POP. This strategy presents a dynamic approach for the reduction of p-NP, leading to the clean production of p-AP.
Introduction
Nitroaromatic compounds are of significant interest due to their widespread use in various industries, including the production of dyes, pesticides, and pharmaceuticals. However, their extensive application has led to severe environmental contamination, as these compounds are highly toxic, recalcitrant to biodegradation, and pose serious risks to human health and ecosystems. The electron-withdrawing nature of the nitro group contributes to their chemical stability and resistance to degradation, making them persistent pollutants in soil and groundwater thus chief calls are derived for their elimination.1–3 Realistically, herbicides and dyes industries generate vast amounts of hazardous nitroaromatic molecule, called p-nitrophenol (p-NP), as its cumulation, propagation out of food chain and within nervous system respectively can give rise to failure of liver and kidney in addition to other lethal diseases.4,5 Therefore, Environmental Protection Agency (EPA) has classified p-NP as a dangerous toxin then maximizes content of it to 10 parts per billion (ppb) within drinkable aqua. Indeed, there are numerous methods recommended to serve the elimination of p-NP such as microwave-assisted oxidation,6 bacterial remediation, gamma irradiation,7 electro,8 or photocatalytic oxidations, photocatalytic ozonation,9 and reductions; however, these disposing methods have considerable defects. For example, elevated operational costs as well as unsafety of electrical pulses and gamma rays of microwave-electrochemical utilizes oxidations techniques preclude the practical uses of these methods.10 The photocatalytic degradation bounds by faint concentrations.11 Bacterial remediation can be employed for limiting the p-NP content (<200 mg L−1), besides each form of nitroaryls acquires a certain kind of bacterium.12 On the other hand, the heterogenous ozonation able to degrade p-NP but suffers unsustainability and an instability after consecutive cycles.13Importantly, heterogeneous reductions of nitrophenols consider the proper strategy due to cheaper energy requirements, effectiveness, ease of operation, and security, nevertheless, higher reduction rates are still industrial provocations.1,14 On the other hand, reducing the nitro units is a vital process toward removal these hazardous part; moreover, para-aminophenol (p-AP) molecule affording through this reaction, considers safe and applicable for many industries as drugs, anticorrosion materials, dyes,15 as well as an optoelectronic molecule for such synthesis of phenolic resin,16–18 polybenzoxazine,19 and poly(cyanate ester).20 Interestingly, the rate of p-NP reduction accelerates using few quantities of energy to fulfil the H2 pressure. On the other hand, such reducing the kinetic barrier of reducing agents toward electron acceptors fasts the corresponding reduction rate of p-NP.
Recently, noble metals nanoparticles (Pt, Ag, Pd, Ru, and Au) albeit generally expensive are employ as beneficial catalysts for such these reductions processes.21–24 Considering this important point, Ag is cost effective, thermally stable, and comparatively abundant relative to other noble metals.
Otherwise, Ag nanoparticles could suffer from agglomeration thus, chemists challenges to anchor these nanoparticles onto diverse carriers such as silica substrates,25 carbonaceous materials,26 or inorganic materials to limit their severe self-assembly and suite the proper application.24,27 Notably, Ag nanoparticles have diverse applications across multiple industries. They serve as antimicrobial agents in medical devices and wound dressings, help inhibit microbial growth in food packaging and play a role in water purification for environmental remediation. Additionally, Ag nanoparticles are utilized in electronics for conductive inks and sensors, in cosmetics for their antimicrobial benefits, in textiles for antibacterial protection, and in biosensors for detecting biological molecules.
Porous organic polymers (POPs) have engaged great concern owing to their unparalleled features such as high thermal and chemical stabilities, high surface area, lower density and diversified synthetic styles.28–44 Actually, the synthesis cost of POPs considers a potential defect of their use due to catalyzing their polymerization processes via expensive metal complexes.45 For example; cobalt complexes catalyzes the trimerizations of alkynes,46 Ni-catalyzed Yamamoto homocoupling,47 and Pd-catalyzes Suzuki reactions48–52 or Sonogashira–Hagihara couplings.39,53,54 Otherwise, hyper-crosslinked polymers (HCPs) could be synthesized through simple and cost-effective materials via Friedel–Crafts alkylation catalyzes cost effective ferric chloride (FeCl3) without uses of functionalized monomers or precious metals.55 Further, FeCl3 can be drained completely after a simple workup. Furthermore, features derived monomers could likely to be fully kept as well as structures of obtained polymers can be characterized easily thus this strategy considers for prospective synthesis of POPs.56
While it is true that previous studies have utilized reducing agents such as hydrazine for synthesizing Ag nanoparticles onto POPs, our work diverges by exploring alternative simple and green reduction methods. Notably, the distinct properties of pyrene (Py) and triphenylamine (TPA) linked chloranil (CH) in the reduction of nitroaromatic compounds have not been thoroughly investigated in prior research. Moreover, green reduction of Ag nanoparticles onto POPs is still challengeable. This exploration is crucial, as it may lead to novel insights into the synthesis and functionality of Ag nanoparticles in environmental applications. Our study aims to contribute valuable knowledge to the field and enhance the understanding of how different monomers can impact the efficiency and effectiveness of decorated Ag nanoparticles in conjunction with POPs for environmental remediation.
Herein, we synthesized a couple of POPs nominated Py–CH and TPA–CH POPs based Py and TPA respectively with CH for the first time considering Friedel–Crafts alkylation strategy (Scheme 1). Those Py–CH and TPA–CH POPs possessed high surface area up to 463, and 822 m2 g−1, respectively, with higher thermal stabilities. Truly, CH considers as a strong oxidizing agent thus their Keto groups can be easily converted into hydroxyl groups, consequently, our Py–CH and TPA–CH POPs could offer many hydroxyl sites.57 Fulfilling the concept of green chemistry, the generated hydroxyl groups within CH POPs able to deal as chelating and reductive sites for Ag+ ions into Ag nanoparticles without using of any external and hazardous reducing agents such as hydrazine affording Ag@Py–CH POP, and Ag@TPA–CH POP nanocomposites, respectively.
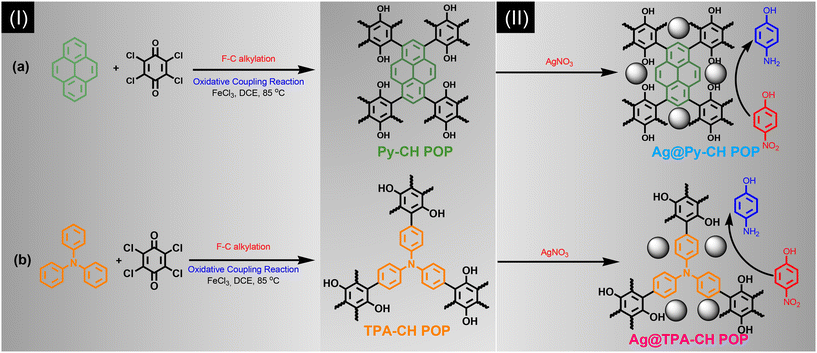 | ||
| Scheme 1 Synthesis of (Ia) Py–CH POP, (Ib) TPA–CH POP, (IIa) Ag@Py–CH POP and (IIb) Ag@TPA–CH POP nanocomposites. | ||
We performed a rational synthesis of Ag decorated POPs using various aqueous concentrations of silver salt (1 and 3 mM) for each CH POPs affording 1Ag@Py–CH POP, 3Ag@Py–CH POP, 1Ag@TPA–CH POP and 3Ag@TPA–CH POP. The catalysis reactions using 1Ag@Py–CH POP, 3Ag@Py–CH POP, 1Ag@TPA–CH POP and 3Ag@TPA–CH POP nanocomposites toward the reduction of p-NP achieving pseudo first order kinetic model with higher catalysis rates up to 4.03 × 10⁻³, 9.7 × 10⁻³, 6.34 × 10⁻³, and 6.34 × 10⁻³ s−1 respectively. Furthermore, our decorated CH POPs showed comparable normalized kinetic rates regarding previous catalysts.
Experimental
Materials
Reagents including anhydrous ferric chloride (FeCl3) and dichloroethane (DCE, 99%) were purchased from Sigma Aldrich. Triphenylamine (TPA, powder), and silver nitrate (AgNO3, crystals) were supported by Alfa Aesar. Chloranil (CH, powder), p-NP was obtained from TCI America. All solvents used for achieving our study were from Analytical quality utilized without any additional purifying.Preparation of pristine Py–CH POP
The Friedel–Crafts alkylation protocol was reported previously.55 Briefly, Py (4 mmol, 0.81 g) and anhydrous FeCl3 (0.012 mmol, 1.97 g) were dissolved in anhydrous 1,2-dichloroethane (50 mL), then chloranil powder (4.1 mmol, 1 g) was added to the reaction flask. The mixture was magnetically stirred under reflux system and nitrogen atmosphere for ten consecutive hours at ambient temperature, subsequently rising at 100 °C for 4 days. During this process, the elastic precipitate was separated out. The reaction mixture has poured into methanol for recrystallization then washed by water, methanol, acetone, and THF to eliminate any salt residuals. Collect the powder by filtration, then dried by suction at 100 °C for a full day (yield: 85%).Preparation of TPA–CH POP
TPA (4.1 mmol, 0.98 g) with dehydrated FeCl3 (1.97 g, 0.012 mmol) had dissolved in anhydrous 1,2-dichloroehtane (50 mL), then chloranil (4.1 mmol, 1 g) was supplemented to reaction mixture. The mixture was magnetically stirred under same previously mentioned conditions about ten consecutive hours at ambient conditions then temperature had raised as high as 100 °C for 4 days. During this process, the elastic precipitate was filtered out. The reaction mixture has poured into methanol for recrystallization then washed by water, methanol, acetone, and THF to eliminate any salt residuals. Finally, the greenish-yellow powder had been retrieved and processed by suction at 100 °C for 24 h (yield: 93%).Preparation of Ag@Py–CH and Ag@TPA–CH POPs nanocomposites
The green strategy of anchoring Ag nanoparticles has previously discussed.58 A couple of AgNO3 fluids were made individually by concentration 0.1 and 0.3 mM. The Py–CH and TPA–CH POPs (10 mg) were immersed in the specific AgNO3 fluids (10 mL). The combinations were swirled magnetically overnight, then powders were separated, washed up to five times using methanol and water. Powders were filtered, then dried out under 50 °C producing outcomes of xAg@Py–CH and xAg@TPA–CH POPs nanocomposites where x was 1 or 3 depending on the corresponding concentration of AgNO3. ICP detected 0.67, 1.20, 0.29, and 0.58 wt% of Ag respectively for 1Ag@Py–CH POP, 3Ag@Py–CH POP, 1Ag@TPA–CH POP and 3Ag@TPA–CH POP.Conversion from p-NP into p-AP mediated Ag@Py–CH POP nanocomposite
The reduction procedures of p-NP has reported previously.4,23 Briefly, p-NP (2.0 mL, 0.16 mM) plus NaBH4 (0.5 mL, 0.08 M) had been charged into the well stoppered chamber, afterward previously xAg@Py–CH or xAg@TPA–CH POPs nanocomposites (0.2 mL, 1 mg mL−1) were charged. Notably, similar concentrations regarding the p-NP were employed within conditions of reduction experiments. Moreover, a UV-Vis spectrophotometer was employed to monitor the progress of the reduction over time intervals.Recovery of Ag@Py–CH and Ag@TPA–CH POPs nanocomposites
To define recovery processes of 1Ag@Py–CH and 1Ag@TPA–CH POPs nanocomposites toward such conversion of the p-NP, nanocomposites quantities (catalyst) were increased tenfold to minimize error effect. The Ag@Py–CH and Ag@TPA–CH POP nanocomposites were conducted for five consecutive runs; they were separated through centrifugation at 6000 rpm then washed by water and methanol, dried before the subsequent run as well.Results and discussion
Characterizations of CH POPs
Couple novel CH-based POPs nominated Py–CH and TPA–CH POPs were synthesized in a quantitative yield via Friedel–Crafts alkylation strategy between (CH) and two aromatic units Py and TPA, respectively (Scheme I(a) and II(b)). Importantly, both CH POPs do not show any solubility through standard solvents including acetone, EtOH, MeOH, or even THF, implying their high degree of crosslinking. The chemical textures of as-prepared CH-POPs were clarified applying FTIR as well solid state 13C spinning (MAS) NMR scans. Initially, the FTIR profiles of Py–CH and TPA–CH POPs, as shown in Fig. 1(a), demonstrate the complete disappearance of strong peaks around 600 cm−1, which correspond to vibrational C–Cl units. This observation confirms the successful crosslinking between the building subunits. The FTIR spectrum of Py–CH displays characteristic signals at 3415 cm−1, 3043 cm−1, 1598 cm−1, and 1074 cm−1, while TPA–CH POP exhibits bands at approximately 3448 cm−1, 3040 cm−1, 1606 cm−1, and 1038 cm−1. These peaks are attributed to the vibrational modes of C-OH, C–H (aromatic), C![[double bond, length as m-dash]](https://www.rsc.org/images/entities/char_e001.gif) C, and C–O, respectively, indicating successful formation of CH-POPs.
C, and C–O, respectively, indicating successful formation of CH-POPs.
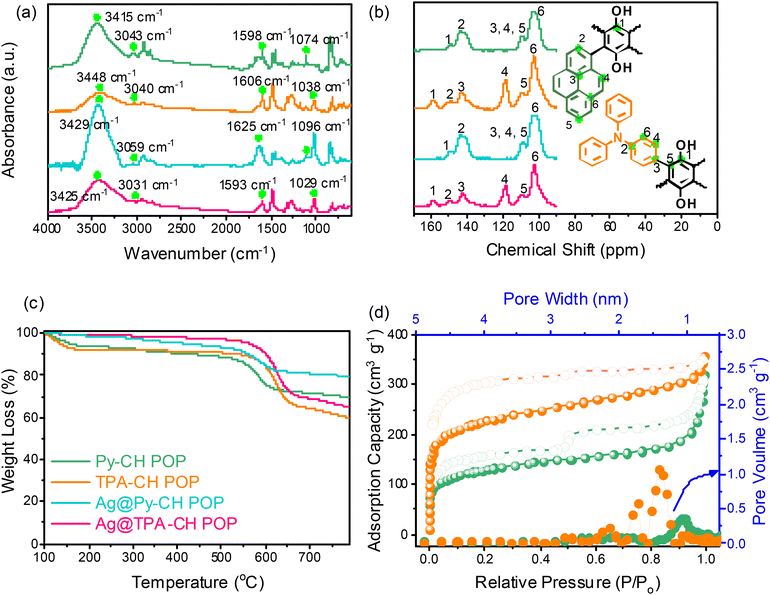 | ||
| Fig. 1 (a) FTIR, (b) sold state NMR (c) TGA profiles of Py–CH, TPA–CH, Ag@Py–CH, and Ag@TPA–CH POPs, and (d) BET and pore sizes profile of Py–CH, and TPA–CH POPs. | ||
In the 13C SSNMR spectrum of Py–CH POP (Fig. 1(b)), a peak at 148.211 ppm is attributed to the carbon atom connected to hydroxyl (OH) groups. Additionally, peaks observed at 143.676 ppm, 109.052 ppm, and 102.241 ppm correspond to the aromatic C![[double bond, length as m-dash]](https://www.rsc.org/images/entities/char_e001.gif) C and C–H bonds present in the polymer structure. Conversely, 13C SSNMR spectrum of TPA–CH POP (Fig. 1(b)) exhibits a signal at 157.867 ppm, which is assigned to the carbon attached to an OH group, along with a peak at 149.565 ppm corresponding to the C–N bond in the TPA monomer. Further peaks at 143.109 ppm, 118.205 ppm, 109.904 ppm, and 102.525 ppm are associated with the aromatic C
C and C–H bonds present in the polymer structure. Conversely, 13C SSNMR spectrum of TPA–CH POP (Fig. 1(b)) exhibits a signal at 157.867 ppm, which is assigned to the carbon attached to an OH group, along with a peak at 149.565 ppm corresponding to the C–N bond in the TPA monomer. Further peaks at 143.109 ppm, 118.205 ppm, 109.904 ppm, and 102.525 ppm are associated with the aromatic C![[double bond, length as m-dash]](https://www.rsc.org/images/entities/char_e001.gif) C and C–H bonds in TPA–CH POP.
C and C–H bonds in TPA–CH POP.
For better emphasizing the elemental composition of CH-POPs surfaces and their relative electronic states we conducted XPS analysis (Fig. S1(a) and (b)†). In this regard, the high resolution XPS signals of C 1s, O 1s, and N 1s were clearly detected for Py–CH and TPA–CH POPs materials (Fig. 2), which primarily confirms their chemical texture. Further, the C 1s spectrum of Py–CH POP sample deconvolutes into three signals (Fig. 2a), which impute to triple carbonaceous species, including sp2 carbons (C![[double bond, length as m-dash]](https://www.rsc.org/images/entities/char_e001.gif) C, 284.9 eV), sp2 carbon attached phenolic O (C-OH, 286.2 eV), C
C, 284.9 eV), sp2 carbon attached phenolic O (C-OH, 286.2 eV), C![[double bond, length as m-dash]](https://www.rsc.org/images/entities/char_e001.gif) O units (287.3 eV). Moreover, deconvolutions of this O signal in Py–CH POP sample exhibit three oxygen species assigned at 534.4, 533.4, 532.1 eV (Fig. 2(a)), which respectively reveals to Waterous O, C-OH, as well –C
O units (287.3 eV). Moreover, deconvolutions of this O signal in Py–CH POP sample exhibit three oxygen species assigned at 534.4, 533.4, 532.1 eV (Fig. 2(a)), which respectively reveals to Waterous O, C-OH, as well –C![[double bond, length as m-dash]](https://www.rsc.org/images/entities/char_e001.gif) O units. Otherwise, C 1s profile within TPA–CH POP sample deconvolutes into four signals (Fig. 2(b)) referring to four carbonaceous species, including sp2 carbons (C
O units. Otherwise, C 1s profile within TPA–CH POP sample deconvolutes into four signals (Fig. 2(b)) referring to four carbonaceous species, including sp2 carbons (C![[double bond, length as m-dash]](https://www.rsc.org/images/entities/char_e001.gif) C, 284.8 eV), sp2 carbon attached phenolic oxygen (C-OH, 285.9 eV), sp2 carbon (C–N, 286.3 eV), as well as C
C, 284.8 eV), sp2 carbon attached phenolic oxygen (C-OH, 285.9 eV), sp2 carbon (C–N, 286.3 eV), as well as C![[double bond, length as m-dash]](https://www.rsc.org/images/entities/char_e001.gif) O groups (287.1 eV).
O groups (287.1 eV).
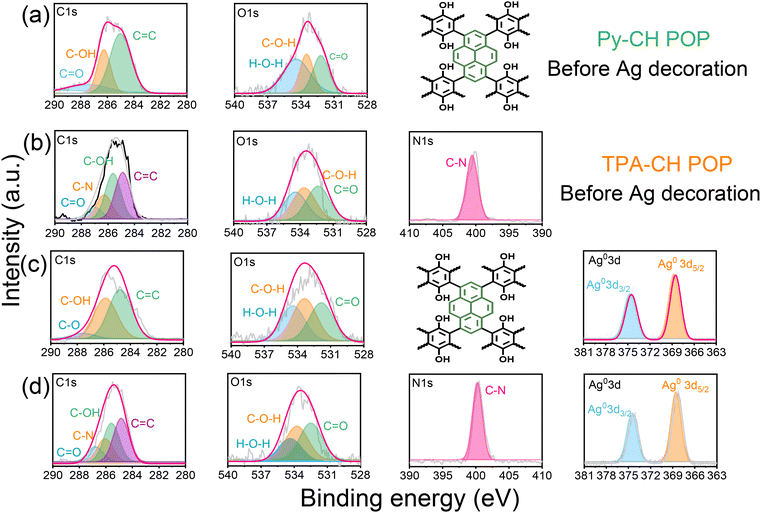 | ||
| Fig. 2 XPS spectrum profiles of Py–CH (row a), TPA–CH (row b) POPs, 3Ag@Py–CH (row c), and 3Ag@TPA–CH POPs (row d). | ||
Similar to Py–CH POP, the TPA–CH POP sample shows triple oxygen species at around 534.4, 533.5, and 532.2 eV (Fig. 2b), respectively reveals to hydrated O, C-OH, as well as –C![[double bond, length as m-dash]](https://www.rsc.org/images/entities/char_e001.gif) O units. Importantly, XPS profile of TPA–CH POP (Fig. 2(b)) shows an additional N 1s signal which fits to singlet peak at 400.1 eV of C–N units. Actually, POPs are renowned for their high thermal stabilities, in this regard, both Py–CH, and TPA–CH POPs exhibit outstanding degree of thermal stabilities based TGA under an inert condition. As emphasized in Fig. 1c, as well Table S1,† the decomposition temperatures (Td10) of Py–CH, and TPA–CH POPs are 437 and 540 °C respectively, achieving high char yields of 69.6 wt% and 59.8 wt%, respectively. These outstanding thermal stabilities of Py–CH, and TPA–CH POPs confirm the high degree of π–π stacking interactions between their layers. Porosities of as-synthesized CH POPs were characterized though analyzing N2 adsorb/desorb isotherms under 77 K (Fig. 1(d)). These plots display an acute increase under minimal relative pressure emphasizing their microporous nature (Fig. 1(d)), in addition to high specific surface areas which reached up to 463 and 822 m2 g−1 for Py–CH, and TPA–CH POPs, respectively (Fig. 1(d) and Table S1†), and these surface areas fall within a moderate range when compared to state-of-the-art porous materials.4,59 Interestingly, the sharp desorption stage occurred in between P/P0 of 0.5 to 0.45 reveals the cavitation of N2 elucidating these pores possess the geometry of an inkbottle.60,61 Moreover, nonlocal density functional theory (NLDFT) confirmed the micrporous nature of Py–CH and TPA–CH POPs elucidating their tunable pore sizes of 1.07, and 1.34 nm respectively. Pore volumes of those Py–CH and TPA–CH POPs were 0.492 and 0.547 cm3 g−1 respectively (Table S1†). Motivated by physical properties, chemical nature and high surface areas of Py–CH, and TPA–CH POPs, they assume to be potential surfaces for noble metals decoration.
O units. Importantly, XPS profile of TPA–CH POP (Fig. 2(b)) shows an additional N 1s signal which fits to singlet peak at 400.1 eV of C–N units. Actually, POPs are renowned for their high thermal stabilities, in this regard, both Py–CH, and TPA–CH POPs exhibit outstanding degree of thermal stabilities based TGA under an inert condition. As emphasized in Fig. 1c, as well Table S1,† the decomposition temperatures (Td10) of Py–CH, and TPA–CH POPs are 437 and 540 °C respectively, achieving high char yields of 69.6 wt% and 59.8 wt%, respectively. These outstanding thermal stabilities of Py–CH, and TPA–CH POPs confirm the high degree of π–π stacking interactions between their layers. Porosities of as-synthesized CH POPs were characterized though analyzing N2 adsorb/desorb isotherms under 77 K (Fig. 1(d)). These plots display an acute increase under minimal relative pressure emphasizing their microporous nature (Fig. 1(d)), in addition to high specific surface areas which reached up to 463 and 822 m2 g−1 for Py–CH, and TPA–CH POPs, respectively (Fig. 1(d) and Table S1†), and these surface areas fall within a moderate range when compared to state-of-the-art porous materials.4,59 Interestingly, the sharp desorption stage occurred in between P/P0 of 0.5 to 0.45 reveals the cavitation of N2 elucidating these pores possess the geometry of an inkbottle.60,61 Moreover, nonlocal density functional theory (NLDFT) confirmed the micrporous nature of Py–CH and TPA–CH POPs elucidating their tunable pore sizes of 1.07, and 1.34 nm respectively. Pore volumes of those Py–CH and TPA–CH POPs were 0.492 and 0.547 cm3 g−1 respectively (Table S1†). Motivated by physical properties, chemical nature and high surface areas of Py–CH, and TPA–CH POPs, they assume to be potential surfaces for noble metals decoration.
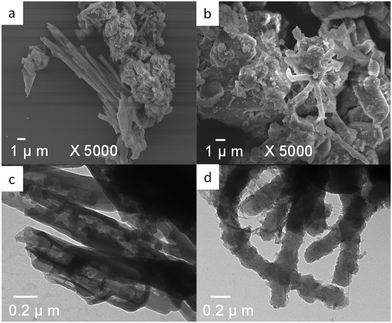
The morphologies of Py–CH, and TPA–CH POPs were visualized using these spectroscopies of FE-SEM and HR-TEM. As shown in Fig. 3(a) and (b), FE-SEM images imply that both Py–CH and TPA–CH POPs exhibit coaxial structures. Basically, TEM image (Fig. 3c) shows hollow tubes of Py–CH POP, and nanorods like structures of TPA–CH POP. This coaxial natures may reveal to non-planar structure of CH molecule within these POPs.62,63
Characterizations of Ag@CH POPs
In this section, we conducted a green embellishment (no dangerous reducing chemicals) to get Ag@CH POPs. Importantly, the Ag+ ions assumed to be captured through impregnated hydroxyl units of Py–CH, and TPA–CH POPs (Scheme 1II).58 These hydroxyl (OH) units not only capture Ag+ but also facilitate the reduction of Ag+ ions to yield Ag nanoparticles and thus this study offers a green methodology.The FTIR spectra of the Ag@Py–CH and Ag@TPA–CH POP nanocomposites, also displayed in Fig. 1(a), show only slight shifts in signals compared to the pristine Py–CH and TPA–CH POPs. Specifically, the vibrational modes for Ag@Py–CH POP are observed at 3429 cm−1, 3059 cm−1, 1625 cm−1, and 1096 cm−1. Similarly, for Ag@TPA–CH POPs, the shifts occur at 3425 cm−1, 3431 cm−1, 1593 cm−1, and 1029 cm−1. These results further support our findings regarding the physical interactions between silver nanoparticles and the surfaces of CH-POPs. Similarly, the 13C SSNMR spectra of the as-decorated nanocomposites Ag@Py–CH and Ag@TPA–CH POPs, as illustrated in Fig. 1(b), exhibit subtle chemical shifts compared to the pristine Py–CH and TPA–CH POPs. These shifts provide further confirmation of the previously mentioned assumption regarding the physical interactions between the Ag nanoparticles and the surfaces of the CH-POPs. Importantly, TGA of 3Ag@Py–CH, and 3Ag@TPA–CH POPs nanocomposites showed slightly higher Td10 values than pristine Py–CH, and TPA–CH POPs, which raised up to 563, and 602 °C, respectively. Furthermore, Ag@Py–CH, and Ag@TPA–CH POPs nanocomposites achieved a high char yields up to 65.0, and 79.5 wt%, respectively as shown in Fig. 1(c). To validate the thermal properties of our Ag nanocomposites, we have conducted TGA for both the pristine Py–CH POP and Ag@Py–CH POP in an air atmosphere. The results indicate a char yield of 1.11% for the pristine Py–CH POP and 2.07% for the Ag@Py–CH POP after heating to 800 °C. Additionally, the Td10 were found to be 352 °C for the pristine Py–CH POP and 525 °C for the Ag@Py–CH POP (Fig. S2†). Similarly, we performed TGA on the pristine TPA–CH POP and Ag@TPA–CH POP, which yielded char yields of 0.66% and 1.26%, respectively. The Td10 values were recorded at 510 °C for the pristine TPA–CH POP and 521 °C for the Ag@TPA–CH POP. These inspiring TGA results imply the high thermal stability of our nanocomposites (Ag@Py–CH, and Ag@TPA–CH POPs) after Ag decoration.
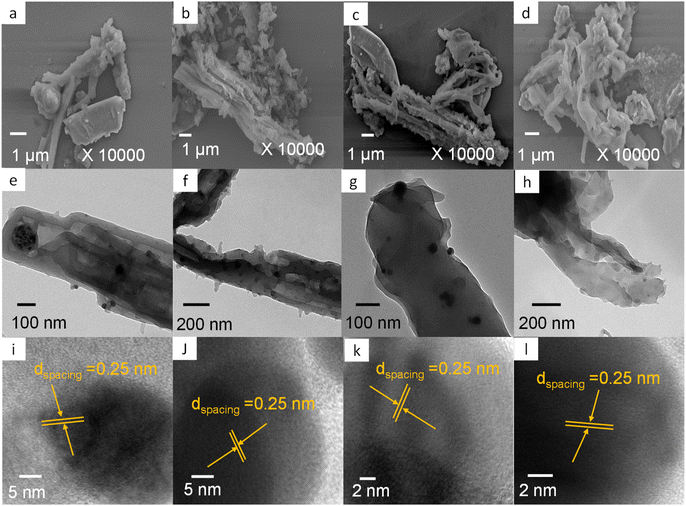
Fig. 4(a)–(d) show SEM visualizations of 1Ag@Py–CH, 3Ag@Py–CH, 1Ag@TPA–CH, and 3Ag@TPA–CH POPs nanocomposites respectively similar to their pristine surface Py–CH and TPA–CH POPs without severe Ag nanoparticles aggregations. On the other hand, Fig. 4(e) and (f) represent TEM images of 1Ag@Py–CH, and 3Ag@Py–CH POPs nanocomposites, confirming their hollow tubes like morphology with dispersed Ag nanoparticles without considerable agglomeration which reveals to their surface area as well as suitable pores within pristine Py–CH POP. Furthermore, the TEM visualizations of 1Ag@TPA–CH, and 3Ag@TPA–CH POPs nanocomposites (Fig. 4(g) and (h)) showed the good dispersibility of Ag nanoparticles onto rods of the TPA–CH POP. High resolution TEM (HR-TEM) employed for deeply visualizations of Ag nanoparticles deposited onto CH-POPs (Fig. 4(i)–(l)); inter-planar distances between strips evaluated from corresponding lattice fringes of Ag@CH POPs nanocomposite to be 0.25 nm which matched well with lattice axis [111] of cubic Ag.64 Furthermore, we conducted high resolution XPS survey, which confirm surface ingredients of 3Ag@Py–CH, and 3Ag@TPA–CH POPs nanocomposites (Fig. 2(c) and (d)). Actually, XPS analysis of 3Ag@Py–CH, and 3Ag@TPA–CH POPs nanocomposites exhibit the same functional groups of C 1s, O 1s, and N 1s of the pristine Py–CH, and TPA–CH POPs at the same binding energies. On the other hand, XPS analyses of 3Ag@Py–CH, and 3Ag@TPA–CH POPs nanocomposites (Fig. 2(c) and (d)) showed characteristic peaks of Ag atoms at binding energies of 374.9 eV (3d3/2) as well as 367.1 eV (3d5/2), respectively. Herein, we can assume that Ag nanoparticles could not effectively influence binding energies in those atomic ingredients of the pristine Py–CH, and TPA–CH POPs, this assumption matches well with FTIR results.
Catalytic reduction of p-NP
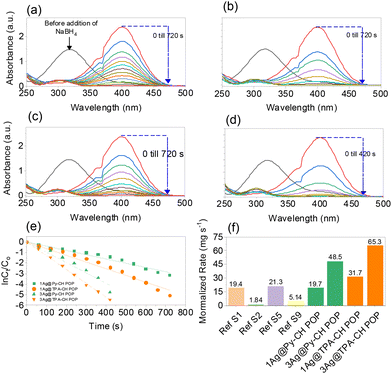
As early reported, the heterogeneous reduction of toxic nitrophenol into safer amine form considers the ideal disposal protocol due to chemical and bio stabilities of the former.14,65 Basically, the catalytic conversion of p-NP into p-AP was selected as a model to investigate the catalytic efficiency of the synthesized Ag nanoparticles decorated POPs. Technically, aqueous NaBH4 employs for reducing the p-NP into p-AP catalyzing via noble metals nanoparticles.66,67 Firstly, the color of the p-NP converted to deep yellow upon the addition of NaBH4 and the UV-Vis absorption peak of the former transformed from 317 nm into 400 nm as shown in Fig. 5(a)–(d), indicating the formation of p-NP− anions.68 Ultimately, color fades from deep yellow to ultimate colorless within time after the addition xAg@Py–CH and xAg@TPA–CH POPs nanocomposites (Fig. 5(a)–(d)). Therefore, the UV absorption signal at 400 nm decrease within time intervals in addition to generation another signal at 300 nm elucidating the conversion into p-AP and such complete disappearance of the former implies the complete reduction of p-NP.69 Of note, no signal change was observed in the absence of our nano-catalysts within the same reaction, which validate the catalytic performances of xAg@Py–CH and xAg@TPA–CH POPs nanocomposites (Fig. S3(a) and (b)†).Utilization of 1Ag@Py–CH, 3Ag@Py–CH, 1Ag@TPA–CH and 3Ag@TPA–CH POPs nanocomposites, derived to complete reductions of p-NP within 660, 360, 480, and 300 s respectively (Fig. 5(a) and (b)). Interestingly, xAg@TPA–CH POPs nanocomposites have better catalytic activity than xAg@Py–CH POPs nanocomposites (Fig. 5(a) and (b)), this superior performance of the former assumes to the capability of tertiary amines based xAg@TPA–CH POPs nanocomposites to form hydrogen bonding with phenolic hydroxyl units consequently motivates the reduction rate. Significantly, the concentration of the reducing agent (NaBH4) was higher than p-NP therefore, these reactions supposed to follow pseudo-first-order kinetic models.23,70,71 Realistically, the pseudo-first-order kinetic assumption expressed via equation of  considering the apparent rate constant (Kapp), preliminary concentration (C0), concentration at time intervals (Ct), and time per seconds (t). Thereby, the Kapp of 1Ag@Py–CH, 3Ag@Py–CH, 1Ag@TPA–CH and 3Ag@TPA–CH POPs nanocomposites are 4.03 × 10⁻³, 9.7 × 10⁻³, 6.34 × 10⁻³, and 6.34 × 10⁻³ s−1, respectively (Fig. 5(e)). On the other hand, the normalized rate constants of 1Ag@Py–CH, 3Ag@Py–CH, 1Ag@TPA–CH and 3Ag@TPA–CH POPs nanocomposites are 19.7, 48.5, 31.7, and 65.3 mg s−1, respectively. From this point, we suppose, such an increase of the dipping AgNO3 concentration reveals a higher deposition percentage of Ag nanoparticles onto Py–CH or even TPA–CH POPs as proven through ICP data. Therefore, reducing efficiencies of the 3Ag@Py–CH POP toward p-NP is higher than 1Ag@Py–CH POPs nanocomposites. Similarly, the 3Ag@TPA–CH POP nanocomposite is better than 1Ag@TPA–CH POPs nanocomposites. The normalized rates of our xAg@Py–CH and xAg@TPA–CH POPs nanocomposites comparing with previously reported Ag nanoparticles decorated polymers used for heterogeneous reduction of p-NP exhibit promising catalytic efficiency than pyridinyl-phenanzine CMP,4 cellulose microgels,72 Gd-MOFs,73 spherical COF,74 sugar-based micro/mesoporous hypercross-linked polymers75 and others (Fig. 5(f) and Table S2†). Further, we tested the efficiency of 1Ag@Py–CH, 1Ag@TPA–CH POP toward the reduction of p-chloro nitrobenzene,76 results imply significant catalysis performances via these catalysts (Fig. S4†).
Importantly, turnover number (TON) and turnover frequency (TOF) for the reduction of p-NP using various Ag@Py–CH and Ag@TPA–CH nanocomposites reveals important insights into their catalytic performance. The TON values indicate the total number of moles of p-AP produced per mole of catalyst. For instance, the TON for 1Ag@Py–CH POP is recorded at 4.03 min−1, while the 3Ag@Py–CH POP exhibits a higher TON of 9.70 min−1 (Fig. S5a†). On the other hand, the 1Ag@TPA–CH POP shows a TON of 6.34 min−1, while the 3Ag@TPA–CH POP achieves a higher TON of 13.06 min−1 (Fig. S5b†). This suggests that increasing the Ag loading enhances catalytic efficiency. The TOF values, which measure the rate of reaction per mole of catalyst per hour, also show variability, with 1Ag@Py–CH POP showing a TOF of 366.76 h−1 compared to 385.73 h−1 for 3Ag@Py–CH POP. Otherwise, the 1Ag@TPA–CH POP exhibiting a TOF of 1119.66 h−1, indicating high initial catalytic activity. However, TOF decreases over time for all samples, suggesting that although the catalysts are initially effective, their activity diminishes as the reaction progresses.
Notably, the relationship between TON and TOF reveals an exponential increase in TON over time, indicating that more product is formed as the reaction continues. This rapid conversion suggests that the catalysts are highly effective in facilitating the reduction of p-NP to p-aminophenol. Conversely, TOF values exhibit an exponential decrease with time, indicating that while initial catalytic activity is high, it declines as reactants are converted into products. This decline could be attributed to several factors, such as substrate depletion, product inhibition, or potential deactivation of active sites on the catalyst.
When comparing these results with previously reported materials in the literature (Table S3†), it is evident that our Ag@Py–CH and Ag@TPA–CH nanocomposites demonstrate competitive performance in terms of both TON and TOF. For instance, studies have shown that other metal-based catalysts often exhibit lower TOF values under similar conditions due to issues such as leaching or deactivation. The high TOF observed in our study reflects not only the effective interaction between Ag nanoparticles and the POPs but also highlights the stability and reusability of our synthesized nanocomposites.
Catalytic mechanism
For these kind of catalytic reactions, noble metals decorated polymers (nano-catalysts) provide a suitable surface for reactants (p-NP, and NaBH4), since electron transfers facilitate the reduction processes which supposed to be modulated through these nanocatalysts. Theoretically and experimentally, the catalytic reduction of p-NP catalyzed by xAg@Py–CH and xAg@TPA–CH POPs nanocomposites, and under standard conditions could be followed the plausible mechanics as emphasized in Scheme 2. Briefly, the p-NP may be adsorbed onto xAg@Py–CH and xAg@TPA–CH POPs nanocomposites, then Ag nanoparticles react with borohydride groups to produce an Ag–H pair. After that, hydrogens move between p-NP and Ag–H complex thus reducing nitroaromatic units then capturing again by Ag–H units forming hydroxyl-amines. Finally, p-AP molecules could form due to repeated actions of Ag–H complex as shown in Scheme 2. Importantly, homogeneous distributions of Ag nanoparticles highly recommend forming Ag–H complex, moreover porous nature of Py–CH and TPA–CH POPs accelerate the mass transfer of reactants through catalytic active sites. Again, amine units of TPA–CH POP facilitate such formations of hydrogen bonding with phenolic hydroxyls hence accelerating the kinetic reduction rate of xAg@TPA–CH POP nanocomposite than xAg@Py–CH POP nanocomposite.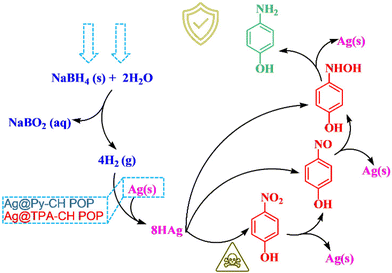 | ||
| Scheme 2 The proposed reduction mechanism of p-NP catalyzed Ag nanoparticles decorated CH-POPs nanocomposites. | ||
Recovery investigations
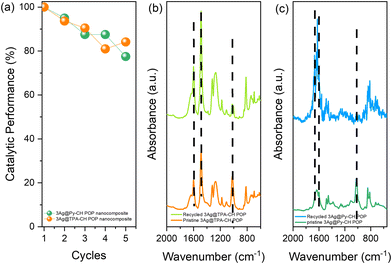
From the perspective future and practical employment of xAg@TPA–CH and xAg@Py–CH POP nanocomposites within catalysing reductions of p-NP, their stabilities consider an important parameter. Here, Ag@TPA–CH and Ag@Py–CH POPs nanocomposites were recovered and reused up to five consecutive runs for the conversion of p-NP into p-AP (Fig. 6(a)). There were no significant losses within catalytic performances of xAg@TPA–CH and xAg@Py–CH POP nanocomposites within increasing cycle number. We have conducted ICP tests to measure the Ag content in the supernatant following the completion of our recycling experiments. The results indicate that no Ag nanoparticles were detected in the supernatant, suggesting that leaching is not a significant factor contributing to the observed decrease in catalytic performance. Instead, we believe that the reduction in catalytic activity is primarily attributed to minimal sample loss that may occur between cycling processes. These results elucidate that our nano-catalysts developed by the current study (Ag@TPA–CH and Ag@Py–CH POP nanocomposites) exhibit outstanding stabilities within several recycles. Furthermore, FTIR signals of the Ag@TPA–CH and Ag@Py–CH POP nanocomposites after recycling tests exhibit very little shifts compared with fresh moieties (Fig. 6(b)–(c)). These important results assume the chemical stabilities of Ag@CH POPs nanocomposites for their futuristic usage.Conclusions
We synthesized CH-based POPs (Py–CH POP, and TPA–CH POP) via simple Friedel–Crafts alkylation. Further, we characterized these novel POPs using FTIR, solid state NMR, TGA, BET methodologies, XPS, SEM, and TEM which emphasized the outstanding physical and chemical properties of these novel materials. Furthermore, hydroxyl units based Py–CH, and TPA–CH POPs facilitated capturing of Ag+ ions achieving preparations of Ag@Py–CH, and Ag@TPA–CH POPs nanocomposites (green reduction). The Ag@Py–CH, and Ag@TPA–CH POPs nanocomposites showed efficient catalytic performances within disposal of hazardous pollutants. The Ag@Py–CH, and Ag@TPA–CH POPs nanocomposites provided higher normalized catalytic reduction rates of p-NP up to 48.5, and 65.3 mg s−1 respectively comparable with reported catalysts used for this regard. Further, Ag@ Py–CH, and Ag@TPA–CH POPs nanocomposites displayed efficient recyclability without considerable losses of performance. Furthermore, this paper not only offers new substrates used as high rated catalysts toward p-NP reductions but also exhibits a new strategy for simple and green decoration of porous polymers with Ag nanoparticles for various life applications.Data availability
The data supporting this article have been included as part of the ESI.†Conflicts of interest
There are no conflicts to declare.Acknowledgements
This study was supported financially by the National Science and Technology Council, Taiwan, under contracts NSTC 113-2223-E-110-001 and 113-2221-E-110 -012 -MY3.References
- T. Zhou, Z. Liu and T. Yu, Ind. Eng. Chem. Res., 2024, 63, 12806–12814 CrossRef CAS.
- T. Ma, X. Tan, Q. Zhao, Z. Wu, F. Cao, J. Liu, X. Wu, H. Liu, X. Wang and H. Ning, Ind. Eng. Chem. Res., 2019, 59, 129–136 CrossRef.
- Y. Li, J. Shen, Y. Hu, S. Qiu, G. Min, Z. Song, Z. Sun and C. Li, Ind. Eng. Chem. Res., 2015, 54, 9750–9757 CrossRef CAS.
- M. G. Kotp, A. F. M. El-Mahdy, T.-L. Yang and S.-W. Kuo, Microporous Mesoporous Mater., 2022, 331, 111669 CrossRef CAS.
- D. S. Rana, S. Kalia, R. Kumar, N. Thakur, R. K. Singh and D. Singh, Environ. Nanotechnol., Monit. Manage., 2022, 18, 100724 CAS.
- B. Liu, S. Li, Y. Zhao, W. Wu, X. Zhang, X. Gu, R. Li and S. Yang, J. Hazard. Mater., 2010, 176, 213–219 CrossRef CAS.
- O. Güven, S. Demirci, S. D. Sütekin, B. Ari and N. Sahiner, Radiat. Phys. Chem., 2022, 198, 110217 CrossRef.
- B. Jiang, A. Li, C. Shuang, Y. Tan, Y. Pan and F. Liu, Chemosphere, 2022, 305, 135400 CAS.
- Y. Tan, W. Chen, G. Liao, X. Li, J. Wang, Y. Tang and L. Li, Appl. Catal., B, 2022, 306, 121133 CAS.
- R. Manno, V. Sebastian, S. Irusta, R. Mallada and J. Santamaria, Catal. Today, 2021, 362, 81–89 CAS.
- S.-X. Li, F.-Y. Zheng, X.-L. Liu, F. Wu, N.-S. Deng and J.-H. Yang, Chemosphere, 2005, 61, 589–594 CAS.
- L. Song, L. Shu, Y. Wang, X.-F. Zhang, Z. Wang, Y. Feng and J. Yao, Int. J. Biol. Macromol., 2020, 143, 922–927 CAS.
- Z. Qu, X. Xu, H. Ren, T. Sun, L. Huang and Z. Gao, J. Environ. Chem. Eng., 2022, 10, 108185 CrossRef CAS.
- P. Zhao, X. Feng, D. Huang, G. Yang and D. Astruc, Coord. Chem. Rev., 2015, 287, 114–136 CrossRef CAS.
- S. Uehara, N. Inomata, A. Suzuki, M. Matsuura and M. Aihara, J. Dermatol., 2014, 41, 560–561 CrossRef CAS PubMed.
- W.-C. Chen, Y.-T. Liu and S.-W. Kuo, Polymers, 2020, 12, 2151 CrossRef CAS.
- Y.-C. Huang, W.-C. Chen and S.-W. Kuo, Macromolecules, 2022, 55, 8918–8930 CrossRef CAS.
- T.-C. Chou and S.-W. Kuo, Macromolecules, 2024, 57, 5958–5970 CrossRef CAS.
- C.-F. Wang, Y.-T. Wang, P.-H. Tung, S.-W. Kuo, C.-H. Lin, Y.-C. Sheen and F.-C. Chang, Langmuir, 2006, 22, 8289–8292 CrossRef CAS PubMed.
- W.-C. Chen, M. M. Ahmed, C.-F. Wang, C.-F. Huang and S.-W. Kuo, Polymer, 2019, 185, 121940 CrossRef.
- D. Jain and G. Madras, Ind. Eng. Chem. Res., 2017, 56, 2008–2024 CrossRef CAS.
- F. Shao, X. Wang, Z. Zhao, Z. Wei, X. Zhong, Z. Yao, S. Deng, S. Wang, H. Wang and A. Li, Ind. Eng. Chem. Res., 2022, 61, 3474–3482 CrossRef CAS.
- M. M. Ayad, W. A. Amer and M. G. Kotp, Mol. Catal., 2017, 439, 72–80 CrossRef CAS.
- M. M. Ayad, W. A. Amer, M. G. Kotp, I. M. Minisy, A. F. Rehab, D. Kopecký and P. Fitl, RSC Adv., 2017, 7, 18553–18560 RSC.
- T.-H. Chang, K.-W. Chuang, Y.-C. Chang and C.-M. Chou, Mater. Chem. Phys., 2022, 280, 125823 CrossRef CAS.
- N. T. L. Chi, M. Narayanan, A. Chinnathambi, C. Govindasamy, B. Subramani, K. Brindhadevi, T. Pimpimon and S. Pikulkaew, Environ. Res., 2022, 208, 112684 CrossRef.
- M. Rahimi, E. B. Noruzi, E. Sheykhsaran, B. Ebadi, Z. Kariminezhad, M. Molaparast, M. G. Mehrabani, B. Mehramouz, M. Yousefi and R. Ahmadi, Carbohydr. Polym., 2020, 231, 115696 CrossRef CAS PubMed.
- D.-H. Yang, Y. Tao, X. Ding and B.-H. Han, Chem. Soc. Rev., 2022, 51, 761–791 RSC.
- Z. Zhang, J. Jia, Y. Zhi, S. Ma and X. Liu, Chem. Soc. Rev., 2022, 51, 2444–2490 RSC.
- S. Wang, H. Li, H. Huang, X. Cao, X. Chen and D. Cao, Chem. Soc. Rev., 2022, 51, 2031–2080 RSC.
- C.-W. Hsiao, A. M. Elewa, M. G. Mohamed, M. G. Kotp, M. M.-C. Chou and S.-W. Kuo, Colloids Surf., A, 2024, 134658 CrossRef CAS.
- T.-L. Lee, A. M. Elewa, M. G. Kotp, H.-H. Chou and A. F. M. El-Mahdy, Chem. Commun., 2021, 57, 11968–11971 RSC.
- M. G. Mohamed, A. F. M. El-Mahdy, M. G. Kotp and S.-W. Kuo, Mater. Adv., 2022, 3, 707–733 RSC.
- M. G. Kotp, N. L. Torad, H. Nara, W. Chaikittisilp, J. You, Y. Yamauchi, A. F. M. El-Mahdy and S.-W. Kuo, J. Mater. Chem. A, 2023, 11, 15022–15032 Search PubMed.
- A. F. M. El-Mahdy, J. Lüder, M. G. Kotp and S.-W. Kuo, Polymers, 2021, 13, 1385 CrossRef CAS.
- M. G. Kotp, S. U. Sharma, J.-T. Lee, A. F. M. El-Mahdy and S.-W. Kuo, J. Taiwan Inst. Chem. Eng., 2022, 134, 104310 CrossRef CAS.
- M. G. Kotp and S.-W. Kuo, Polymers, 2024, 13, 1759 CrossRef.
- A. O. Mousa, M. G. Mohamed, Z.-I. Lin, C.-H. Chuang, C.-K. Chen and S.-W. Kuo, Eur. Polym. J., 2023, 196, 112254 CrossRef CAS.
- A. O. Mousa, M. G. Mohamed, Z.-I. Lin, C.-H. Chuang, C.-K. Chen and S.-W. Kuo, J. Taiwan Inst. Chem. Eng., 2024, 157, 105448 CrossRef CAS.
- A. O. Mousa, S. U. Sharma, S. V. Chaganti, T. H. Mansoure, P. N. Singh, M. Ejaz, C.-H. Chuang, J.-T. Lee, S.-W. Kuo and M. G. Mohamed, J. Power Sources, 2024, 608, 234624 CrossRef.
- A. O. Mousa, Z.-I. Lin, C.-H. Chuang, C.-K. Chen, S.-W. Kuo and M. G. Mohamed, Int. J. Mol. Sci., 2023, 24, 8966 CrossRef CAS.
- A. O. Mousa, C.-H. Chuang, S.-W. Kuo and M. G. Mohamed, Int. J. Mol. Sci., 2023, 24, 12371 CrossRef CAS PubMed.
- M. G. Kotp and S.-W. Kuo, Mater. Today Chem., 2024, 41, 102299 CrossRef.
- M. G. Kotp, A. F. M. El-Mahdy, M. M. Chou and S.-W. Kuo, New J. Chem., 2024, 48, 14435–14443 Search PubMed.
- J.-S. M. Lee and A. I. Cooper, Chem. Rev., 2020, 120, 2171–2214 CAS.
- K. Liang, L. Lu, X. Liu, D. Yang, S. Wang, Y. Gao, H. Alhumade, H. Yi and A. Lei, ACS Catal., 2021, 11, 14892–14897 CAS.
- H. Qiu, B. Shuai, Y.-Z. Wang, D. Liu, Y.-G. Chen, P.-S. Gao, H.-X. Ma, S. Chen and T.-S. Mei, J. Am. Chem. Soc., 2020, 142, 9872–9878 CrossRef CAS PubMed.
- M. G. Kotp, A. M. Elewa, A. F. M. El-Mahdy, H.-H. Chou and S.-W. Kuo, ACS Appl. Energy Mater., 2021, 4, 13140–13151 CAS.
- M. Ahmed, M. G. Kotp, T. H. Mansoure, R.-H. Lee, S.-W. Kuo and A. F. M. El-Mahdy, Microporous Mesoporous Mater., 2022, 333, 111766 CAS.
- M. G. Kotp, J. Lüder, S.-W. Kuo and A. F. M. El-Mahdy, Mater. Adv., 2024, 5, 4142–4150 CAS.
- M. G. Kotp, S.-W. Kuo and A. F. M. El-Mahdy, Colloids Surf., A, 2024, 133210 CAS.
- M. G. Kotp, C.-L. Chang and A. F. El-Mahdy, J. Water Process Eng., 2023, 53, 103675 Search PubMed.
- F. Khosravi, M. Gholinejad, J. M. Sansano and R. Luque, Mol. Catal., 2022, 522, 112199 CAS.
- A. O. Mousa, M. G. Mohamed, C.-H. Chuang and S.-W. Kuo, Polymers, 2023, 15, 1891 CrossRef CAS.
- J. Wang, L. Zhang, Y. Jing, W. Huang and X. Zhou, Tetrahedron Lett., 2009, 50, 4978–4982 CrossRef CAS.
- S. Che and L. Fang, Chem, 2020, 6, 2558–2590 CAS.
- S. Isikli, M. Lecea, M. Ribagorda, M. C. Carreño and R. Díaz, Carbon, 2014, 66, 654–661 CrossRef CAS.
- H.-L. Cao, H.-B. Huang, Z. Chen, B. Karadeniz, J. Lü and R. Cao, ACS Appl. Mater. Interfaces, 2017, 9, 5231–5236 CrossRef CAS PubMed.
- S. Ren, R. Dawson, D. J. Adams and A. I. Cooper, Polym. Chem., 2013, 4, 5585–5590 RSC.
- M. G. Kotp, N. L. Torad, J. Lüder, A. El-Amir, W. Chaikittisilp, Y. Yamauchi and A. F. M. El-Mahdy, J. Mater. Chem. A, 2023, 11, 764–774 RSC.
- X.-H. Du, Z. Jiang, Z. Liu and C. Xu, Microporous Mesoporous Mater., 2022, 332, 111711 CrossRef CAS.
- S. S. Chu, G. Jeffrey and T. Sakurai, Acta Crystallogr., 1962, 15, 661–671 CrossRef CAS.
- G. Das, T. Skorjanc, S. K. Sharma, T. Prakasam, C. Platas-Iglesias, D. S. Han, J. Raya, J. C. Olsen, R. Jagannathan and A. Trabolsi, ChemNanoMat, 2018, 4, 61–65 CrossRef CAS.
- T.-K. Huang, T.-H. Cheng, M.-Y. Yen, W.-H. Hsiao, L.-S. Wang, F.-R. Chen, J.-J. Kai, C.-Y. Lee and H.-T. Chiu, Langmuir, 2007, 23, 5722–5726 CrossRef CAS.
- M. Capocelli, M. Prisciandaro, A. Lancia and D. Musmarra, Chem. Eng. J., 2014, 254, 1–8 CrossRef CAS.
- Q. Yue, J. Li, Y. Zhang, X. Cheng, X. Chen, P. Pan, J. Su, A. A. Elzatahry, A. Alghamdi and Y. Deng, J. Am. Chem. Soc., 2017, 139, 15486–15493 CrossRef CAS.
- P.-C. Chen, G. Liu, Y. Zhou, K. A. Brown, N. Chernyak, J. L. Hedrick, S. He, Z. Xie, Q.-Y. Lin and V. P. Dravid, J. Am. Chem. Soc., 2015, 137, 9167–9173 CrossRef CAS PubMed.
- M. Li and G. Chen, Nanoscale, 2013, 5, 11919–11927 RSC.
- S. Bae, S. Gim, H. Kim and K. Hanna, Appl. Catal., B, 2016, 182, 541–549 CrossRef CAS.
- J. Sun, Y. Fu, G. He, X. Sun and X. Wang, Catal. Sci. Technol., 2014, 4, 1742–1748 RSC.
- J. Du and Z. Xia, Anal. Methods, 2013, 5, 1991–1995 RSC.
- Y. Han, X. Wu, X. Zhang, Z. Zhou and C. Lu, ACS Sustainable Chem. Eng, 2016, 4, 6322–6331 CAS.
- Y.-P. Wu, G.-W. Xu, W.-W. Dong, J. Zhao, D.-S. Li, J. Zhang and X. Bu, Inorg. Chem., 2017, 56, 1402–1411 CAS.
- N. Wang, F. Wang, F. Pan, S. Yu and D. Pan, ACS Appl. Mater. Interfaces, 2021, 13, 3209–3220 CAS.
- Q. Yin, Q. Chen, L.-C. Lu and B.-H. Han, Beilstein J. Org. Chem., 2017, 13, 1212–1221 CAS.
- A. Monga and B. Pal, RSC Adv., 2015, 5, 39954–39963 RSC.
Footnote |
| † Electronic supplementary information (ESI) available. See DOI: https://doi.org/10.1039/d4py01179a |
| This journal is © The Royal Society of Chemistry 2025 |

