NIR emissive probe for fluorescence turn-on based dead cell sorting and in vivo viscosity mapping in C. elegans†
Goraksha T.
Sapkal‡
 a,
Farhan
Anjum‡
 b,
Abdul
Salam§
 a,
Bodhidipra
Mukherjee§
 b,
Shilpa
Chandra
 c,
Purabi
Bala
a,
Richa
Garg
 a,
Shagun
Sharma
 a,
Kush
Kaushik
 a and
Chayan Kanti
Nandi
 *a
*a
aSchool of Chemical Sciences, Indian Institute of Technology Mandi, Mandi, HP-175075, India. E-mail: chayan@iitmandi.ac.in
bSchool of Biosciences and Bioengineering, Indian Institute of Technology Mandi, Mandi, HP-175075, India
cIndian Knowledge System and Mental Health Applications Centre, Indian Institute of Technology Mandi, Mandi, HP-175075, India
First published on 12th November 2024
Abstract
Dead cell sorting is pivotal and plays a very significant role in homeostasis. Apoptosis and ferroptosis are the two major regulatory cell death processes. Apoptosis is a programmed cell death process, while ferroptosis is a regulatory cell death process. Monitoring the dead cells coming out from these processes is extremely important to stop various cellular dysfunctions. Here, we present a single NIR emissive probe that can observe both apoptotic and ferroptosis regulatory cell deaths. We were able to directly visualize the dead cells in both animal and plant cells upon a significant increase in the fluorescence intensity of the probe. During cell death, the increased cytoplasm viscosity restricted the rotor motion and helped in the fluorescence turn-on of the probe. Lysosomal viscosity was found to play a crucial role in the ferroptosis pathway. On the other hand, the probe was not only efficient in mapping the viscosity in various parts of live Caenorhabditis elegans (C. elegans) bodies but also able to differentiate between live and dead animals.
Introduction
Cell death is a key player in various cellular processes, including the regulation of tissue growth, embryogenesis, cell turnover, immune response, and numerous other biological activities. Among the various cell death processes, apoptosis and ferroptosis have shown remarkable efficacy and hold great potential for clinical applications within the domain of nanomedicine.1,2 Apoptosis is a programmed cell death process and occurs on demand by the physiological requirement to clean the waste material. On the other hand, ferroptosis is a regulatory cell death process that results from the iron-dependent accumulation of lipid peroxides connected with reactive oxygen species (ROS).3,4 It is known that the dead cell is an indicator of various diseases such as traumatic brain injury, heart attack, and autoimmune response. Further, the disruption of homeostasis by the excessive number of dead cells is a hallmark of cancer and several neurodegenerative disorders.5–8 As a result, it is of utmost importance to monitor the dead cells coming out from apoptosis and ferroptosis within the living body to improve personalized medicine.Among various techniques, fluorescence imaging is a wonderful and most reliable technique to monitor cell death.9–18 It helps to detect the level of tissue damage, observe disease progression, and evaluate the success of treatments, providing essential prognostic information and guiding the design of personalized treatment plans.19–22 However, the currently existing fluorescent probes for imaging dead cells mainly rely on visible region emitters that either have low photostability or are non-permeable, entering inside the dying cells through the disrupted plasma membrane.23–27 As a result, a substantial difficulty arises in setting up real-time, repeated, and quantitative experiments for a long duration. In addition, none of the available probes have the ability to detect both apoptosis and ferroptosis simultaneously.28,29 Consequently, there is a high demand for novel NIR imaging probes with enhanced photophysical properties that can enable to visualize the multi-pathway-induced cell death and help in monitoring the process for a long duration.
Intracellular viscosity is the basis for various cellular processes, and abnormal changes in the viscosity of cells are involved in multiple cellular dysfunctions.30–34 It is proposed that increased cytoplasmic viscosity is a significant morphological characteristic of apoptosis due to cell shrinkage (Scheme 1). Ferroptosis is a iron-mediated lipid peroxidation based cell death process and viscosity has been found to play significant roles in this process.22 Hence, it could be hypothesized that a viscosity-sensitive probe could be beneficial for simultaneously sorting dead cells originating from apoptosis and ferroptosis pathways. However, to date, to the best of our knowledge, there are no such viscosity-based probes available to monitor the dead cells simultaneously in both apoptosis and ferroptosis.35–38
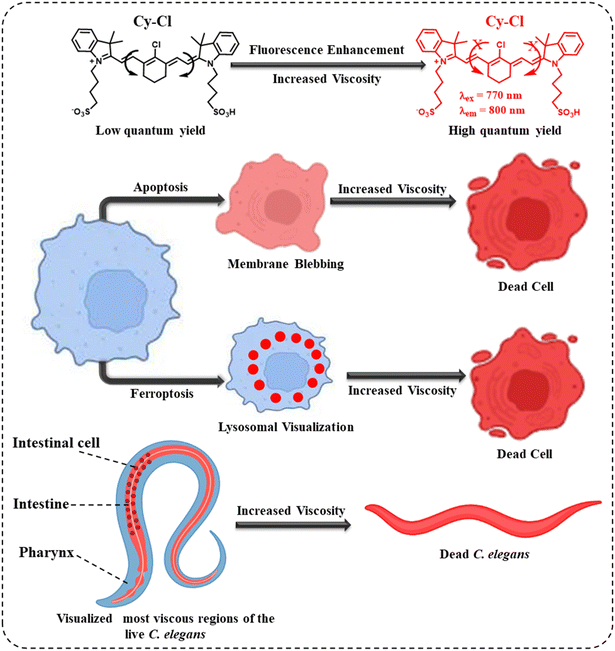 | ||
| Scheme 1 Schematic illustration of the viscosity response of the Cy–Cl probe in different cell death processes and in live and dead C. elegans. | ||
Here, we present a viscosity-modulated fluorescent turn-on NIR emissive molecular rotor that can detect and monitor cell death processes in both apoptosis and ferroptosis. The advantage of the probe is explicitly long-term visualization of dead cells in various cancerous and non-cancerous cells such as HeLa, HEK 293A, and Hep G2 cells. While dead cells were visualized based on the increased cytoplasmic viscosity in apoptosis, the probe was further able to monitor the active participation of lysosomes and their viscosity during ferroptosis. The probe was found to stain the lysosomes in the first 10 hours and then the whole cytoplasm of dead cells.
We further show the efficiency of the probe for the in vivo viscosity mapping and to differentiate the live and dead C. elegans, a nematode that inhabits highly viscous environments like muddy soil, intestines of slugs, and rotting fruits and vegetables. Being filter feeders by nature, the animal separates bacteria from the suspension of viscous slurry that it ingests via an organ called the pharyngeal pump. Hence, the viscosity of the food and its intake directly affect the overall health of C. elegans since a highly viscous suspension might restrict the filtration capacity of the pharynx.39 Not only the extrinsic viscosity but also the intrinsic viscosity of the food and that of the intestinal lumen and brush border affect food intake and the associated biological properties like digestibility or nutritional uptake of an animal. Highly viscous food can reduce the intestinal flow rate and nutrient absorption rate compared to food with lower viscosity.40–42 The probe was able to map the whole-body viscosity in C. elegans under different experimental conditions. Using the probe, we observed multiple biological characteristics, such as the areas of higher viscosity within the animal under normal conditions, increased intestinal viscosity after feeding, and changes in overall viscosity (Scheme 1).
Results and discussion
Synthesis of the viscosity–sensitive Cy–Cl probe
We targeted to utilize a cyanine-based, viscosity-sensitive probe to visualize the dead cells during apoptosis and ferroptosis. Cyanine dyes (also known as polymethine cyanine dyes) have extended pi-conjugation with increased rigidity of both polymethine terminal groups.43 Inspired by the structural feature of cyanine dyes, we synthesized a Cy–Cl organic probe and confirmed the structure using 1H-NMR, 13C-NMR, and mass spectrometry techniques. The details of the synthesis and characterization are provided in the ESI† (Fig. S1–S5). At first, we recorded the detailed optical properties of the probe. The measured absorption spectrum in water showed the maximum at 775 nm, whereas the fluorescence emission maximum appeared at 800 nm with an excitation wavelength of 775 nm (Fig. 1a). We also measured the fluorescence excitation spectrum, which was found to match perfectly with the absorption spectrum, suggesting that the emission originates from the purely monomeric state of the sample. Next, we evaluated the emission spectral changes of the probe upon the addition of glycerol to water. A huge enhancement in fluorescence intensity in water–glycerol viscous medium was observed (Fig. 1b). In addition, a 30 nm red shift from 800 nm to 830 nm was observed with the increase in viscosity, which might be due to the J-type aggregation of the probe in the viscous medium.44 The measured absorption spectra also support our hypothesis, as shown in Fig. S6 (ESI†). We also examined the fluorescence response of the probe across the pH range from 3 to 10 to assess any influence of pH on the fluorescence of the probe in different viscous media. The measured data showed no significant change in the fluorescence intensity within the pH range from 3 to 10. The data further showed a negligible effect of pH on the viscosity-based fluorescence intensity of the probe (Fig. S7, ESI†). The fluorescence lifetime of the probe was measured, and it was observed that upon increasing the viscosity of the medium, the average lifetime of the probe increased from 0.02 ns to 0.3 ns (Fig. 1c and Table S1, ESI†). The increased lifetime value suggested that the radiative transition rate is responsible for the observed increased fluorescence intensity as observed in Fig. 1b. The quantum yield (QY) of the probe was found to be 1.5% in water, and a ∼4 times increase in the QY was observed in glycerol (5.4%). We anticipate that this could happen due to rotatable single bonds and excited state C![[double bond, length as m-dash]](https://www.rsc.org/images/entities/char_e001.gif) C double bonds of the probe in low-viscosity medium, which can cause a non-planar probe structure and energy loss through non-radiative paths (Scheme 1). However, the constrained high viscosity medium made rotatable single bonds and excited state C
C double bonds of the probe in low-viscosity medium, which can cause a non-planar probe structure and energy loss through non-radiative paths (Scheme 1). However, the constrained high viscosity medium made rotatable single bonds and excited state C![[double bond, length as m-dash]](https://www.rsc.org/images/entities/char_e001.gif) C double bonds rigid, causing restricted intramolecular rotation (RIR) leading to fluorescence enhancement.45
C double bonds rigid, causing restricted intramolecular rotation (RIR) leading to fluorescence enhancement.45
Cellular internalization and dead cell sorting in apoptosis
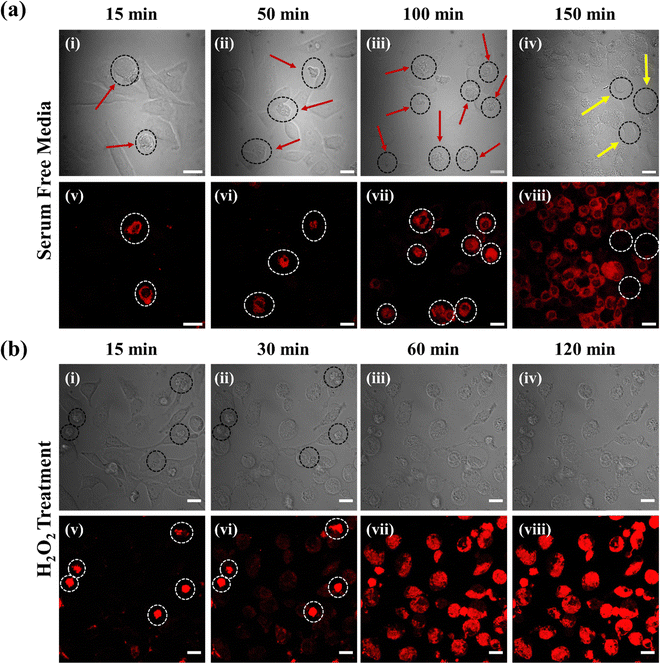
Following the synthesis and photophysical characterization, we were curious to see the cellular uptake and internalization of the probe inside HeLa cells. Due to the limitations in imaging in the NIR region upon excitation at the absorption maxima at 775 nm, we used the 639 nm excitation and the corresponding emission channel to capture the image. The solution phase emission spectrum of the probe by exciting at 639 nm suggested (Fig. S8, ESI†) that the probe could be used for bioimaging efficiently. In the cell internalization study, we made a very interesting observation upon incubating the probe (60 μM) in HeLa cells for an hour followed by confocal imaging. Surprisingly, we observed that some of the cells were stained with the probe, but some cells were not (Fig. S9, ESI†). This observation, along with the transmission light differential interference (TD) image of the cells, indicated that the probe was highly efficient in staining only the dead cells but not the live cells. The TD image of the live cells revealed very nice round shaped morphology, while the dead cells had shrinkage and deformed morphology. The probable reason is that the dead cells have a damaged surface that allows the probe to easily penetrate by passive diffusion and thereby increase the viscosity of the cytoplasm.46 Albeit, the Cy–Cl probe remains intact on the live cell surface and does not internalize inside the cell, thereby no fluorescence intensity was observed from the cell. We measured the fluorescence intensity of the probe in the presence of DNA, RNA, GSH, cysteine, homocysteine, and various metal ions normally present inside the cells. Fig. S10 (ESI†) shows negligible changes in the fluorescence intensity in their presence, thus suggesting that the increased viscosity is the main reason for the increase in fluorescence intensity in the dead cells. We further checked the cell viability of the probe in HeLa cells (Fig. S11, ESI†) at 6, 12, and 24 hours. The results indicate that the probe does not affect the cells much, and approximately 80% of cells remain viable after 24 hours. These data confirm that the probe by itself is not responsible for cell death.Next, a systematic dead cell sorting was performed in the serum-deprived medium (DMEM culture medium without FBS), which induces cell death over time. The number of dead cells was found to be increased, as shown in TD images (Fig. 2a(i)–(iv)) and the corresponding stained images (Fig. 2a(v)–(viii)). While in Fig. 2a(v), only a few dead cells are observed with enhanced fluorescence intensity, the number of dead cells is found to be increased in Fig. 2a(viii). The yellow arrow represents the cells that are not dead, as can be seen in the TD images (Fig. 2a(iv)) and also in the corresponding stained images (Fig. 2a(viii)) marked as white circle. Further, we carried out the dead cell sorting in an apoptosis-mediated process. It has been reported that excess hydrogen peroxide (H2O2) can inhibit the metabolism of living cells and induce apoptosis by the excessive production of ROS.28,47 Hence, we initiated a systematic early apoptotic cell death process by adding 120 mM concentration of H2O2. We captured the time-dependent imaging of HeLa cells for 120 minutes. Fig. 2b(v)–(viii) show an increase in the fluorescence intensity with an increase in the number of dead cells (Video S1, ESI†). The corresponding TD images are shown in Fig. 2b(i)–(iv). Initially, at 15 minutes, only a few dead cells were present (Fig. 2b(v)), but later at 120 minutes, a large number of dead cells were observed with their increased in fluorescence intensity (Fig. 2b(viii)).
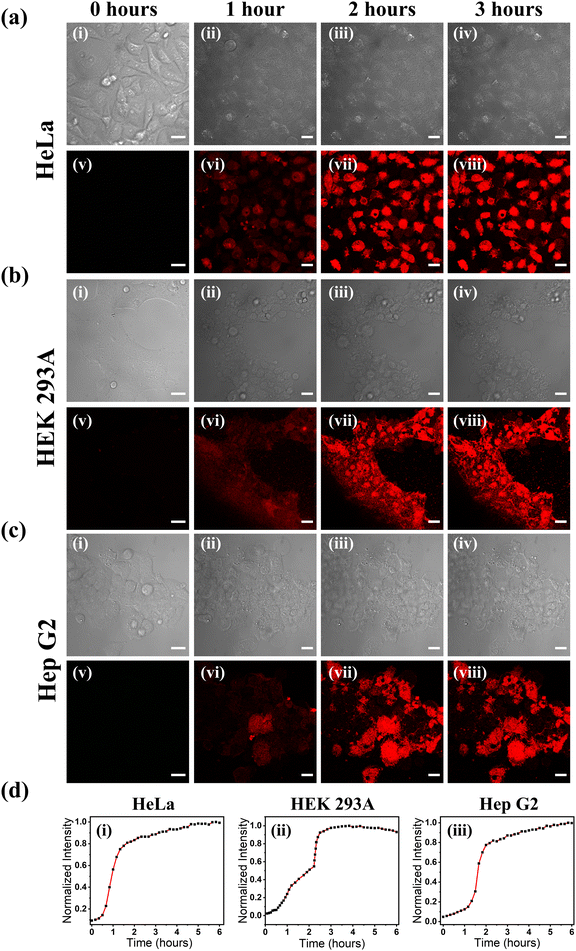
We conducted the dead cell imaging experiments in two other cells: a liver cancer cell Hep G2 and a normal cell HEK 293A. A systematic time-dependent dead cell imaging in a sequential manner was carried out by adding H2O2 for 6 hours in HeLa and HEK 293A cells, while long-term dead cell sorting was carried out with Hep G2 cell for 12 hours. We checked the ROS generation against the H2O2 reagent at a concentration that was used to induce apoptosis in HeLa, HEK 293A, and Hep G2 cells. The result shows enough ROS production, thus confirming the initiation of apoptosis (Fig. S12, ESI†). The time-dependent experiment in HeLa, HEK 293A, and Hep G2 cells (Fig. 3a–c, Fig. S13–S15 and Videos S2–S4, ESI†) showed a very sequential increase in the fluorescence intensity in the initial 2–3 hours, which got saturated after 3 hours to 6 hours of the measurement. Fig. 3a–c(i) and (v) represent the TD and the corresponding stained images without H2O2 addition. Fluorescence was not observed in any of the cell lines. However, as time progressed (Fig. 3a–c(vi)–(viii)), we observed an increase in the fluorescence intensity with an increase in the number of dead cells (Fig. 3d). From the above results, it could be concluded that the probe could be used to sort the dead cells efficiently for a longer duration irrespective of the cells used.48,49
Dead cell sorting in ferroptosis pathways
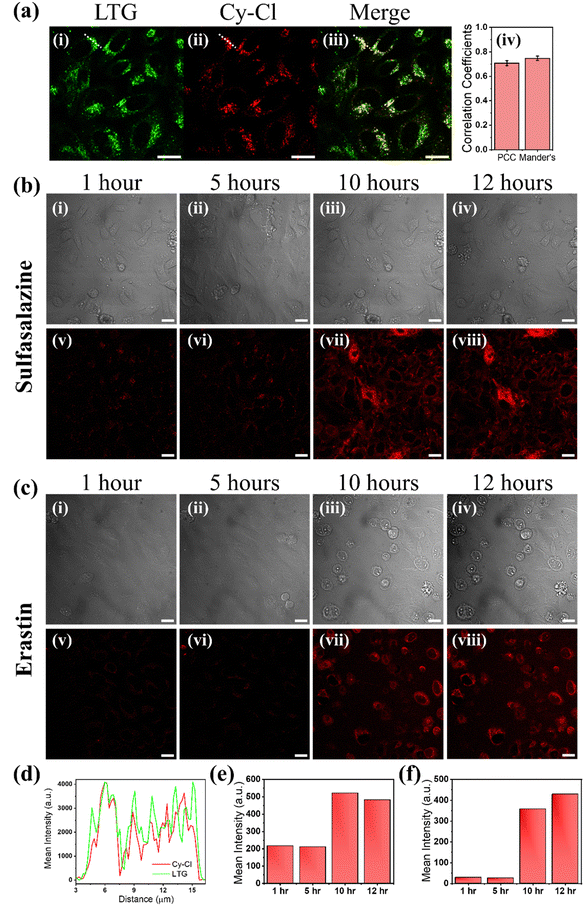
Most therapeutic interventions lead to cell death through more than one pathway, and most probes used to visualize cell death are specific to markers of single pathways. In this scenario, a molecular probe that can identify global cell death irrespective of the particular marker could be preferred. Hence, the probe was further utilized to visualize the ferroptosis-mediated cell death event. Ferroptosis is a comparatively new cell death process, which differs from apoptosis and necrosis and is described as an iron-dependent regulatory cell death process. It occurs through the lethal accumulation of ROS when the glutathione-dependent lipid peroxidation repair system contributes to cell death. Recent reports proposed that lysosome-mediated autophagy may substantially contribute to the ferroptosis-mediated cell death mechanism. However, the link between autophagy and ferroptosis is poorly understood, primarily since the role of the change in the viscosity of lysosomes during the ferroptosis process is not well established. Research studies further indicate that increased lysosomal viscosity is a characteristic feature of several diseases.34,50 Hence, we proposed that after the initiation of ferroptosis, the viscosity of lysosomes is increased, and the increased viscosity of lysosomes is also an indicator of their dysfunction due to the inactivation of degradative enzymes.34,51To understand the important role of lysosomal viscosity and, finally, dead cell sorting in the ferroptosis process, we first stained the HeLa cells with lysotracker green (LTG) and subsequently with the synthesized probe and then exposed them to sulfasalazine (SAS) at a concentration of 30 μM for 14 hours and then subjected to live-to-dead cell imaging by confocal microscopy. SAS is a sulfa drug derived from mesalazine (5-aminosalicylic acid [5-ASA]). It has been found to play an anticancer role in various cancers, including malignant gliomas, by activating ferroptosis by inhibiting SLC7A11.52 In our study, the live-to-dead cell imaging using confocal microscopy revealed that treatment significantly changes the viscosity of lysosomes in HeLa cells during ferroptosis. It was found that the probe was internalized in HeLa cells and colocalized with LTG (Fig. 4a(i) and (ii)), confirming the lysosomal staining initially. The merged image in Fig. 4a(iii) demonstrates the colocalization of the Cy–Cl probe with LTG, yielding a Pearson's correlation coefficient (PCC) and Mander's correlation coefficient value of 0.72 and 0.74 respectively shown by the bar plot in Fig. 4a(iv). The obtained PCC value aligns well with the value reported by He et al. and others in their reports.53–56 Additionally, this colocalization is evident in the line profile drawn along the white line of the confocal images (Fig. 4d). Fig. 4b(i)–(iv) display TD images, and Fig. 4c(v)–(viii) show the corresponding Cy–Cl probe-stained images. The obtained result suggests that the probe was found to stain the lysosomes for the first 10 hours of SAS incubation (Fig. 4b(v), (vi) and Video S5, ESI†). After 10 hours of SAS incubation, the probe intensity started increasing in the cytoplasm of HeLa cells (Fig. 4b(vii) and (viii)) due to the increase in the viscosity of the cytoplasm because of the initiation of the cell death process (Video S6, ESI†). The bar plot as presented in Fig. 4e at various times (1 hour, 5 hours, 10 hours, and 12 hours) further confirms the considerable increase in fluorescence intensity, while the corresponding dead cells are visible in the TD images (Fig. 4b(iii) and (iv)).
We also carried out the experiment with erastin, which functions as a classic inducer of ferroptosis by suppressing cystine/glutamate antiporters and finally leading to the inhibition of cellular cystine uptake and depletion of glutathione (GSH). This process ultimately results in the accumulation of lethal lipid ROS.57 As with SAS, we observed the same results during the erastin-induced ferroptosis. As described above, the probe first stained the lysosomes and then the cytoplasm of dead HeLa cells with increased fluorescence intensity (Fig. 4c(v)–(viii) and 4f). From this observation, we propose that during ferroptosis, lysosomal viscosity plays a crucial role and finally leads to cell death. Further, to check whether the viscosity is responsible for probe intensity enhancement in dead cells or pore formation on the dead cell's membrane is also responsible; we fixed the HeLa cells with 4% p-formaldehyde and then created pores with 0.1% Triton X-100 and allowed the probe to internalize inside the cells. In this case, the confocal fluorescence imaging showed no emission of probes (Fig. S16, ESI†). Hence, it proved that the increased cytoplasm viscosity was solely responsible for the increase in fluorescence intensity during cell death, making it a dead cell stainer.
Dead cell imaging in plant roots
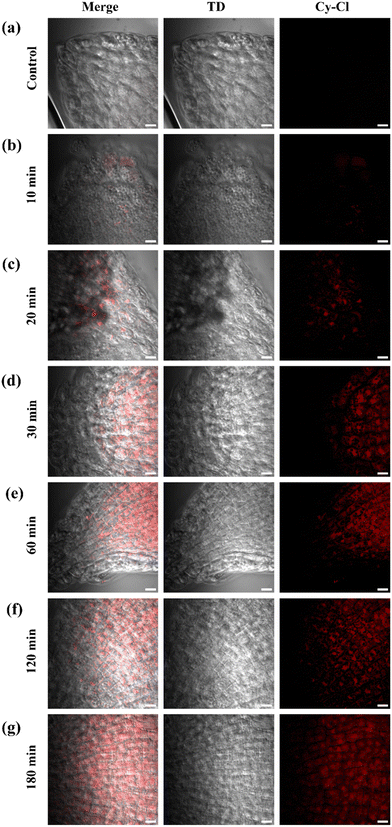
After successfully conducting dead cell sorting in mammalian cells, we were eager to explore the capability of the probe for dead cell sorting in plant cells. Therefore, roots of the tomato seedlings (Solanum lycopersicum) shown in Fig. S17 (ESI†) were used in this study. Under normal conditions, no cell death was observed in the roots (Fig. 5a). After 10 minutes of exposure to H2O2, an increase in cell death was detected, as shown in Fig. 5b. This observation was part of an experiment where the probe was used to stain dead plant cells under different conditions. However, the progression of cell death became evident with time, as shown in Fig. 5c–f, and after 180 minutes, most of the cells were dead (Fig. 5g). This increase in cell death over time is attributed to excessive production of ROS, leading to oxidative stress, which causes damage to plant cells and ultimately results in plant cell death.Cy–Cl internalization and confocal bioimaging visualized viscous region of C. elegans
Due to the importance of the need to understand viscosity as a parameter to study the biological condition of an organism in a live animal, we used the Cy–Cl probe to observe multiple biological events in C. elegans. We tried to answer the following questions: what are the areas of higher viscosity within the animal under normal conditions, how does the viscosity in the intestine change after feeding, and how do overall viscosity changes occur after the death of the animal. For the experiment, C. elegans was first grown in OP-50 laden bacterial plates, from which it was extracted and resuspended in M9 containing stainer Cy–Cl dye. Staining was done in the dark at 20 °C for 6 hours, after which C. elegans was washed to remove excess stain and then placed on agar pads for imaging. Different parts of the animal were observed one at a time, and then we tried to correlate them with their biological significance in maintaining the health of the animal.Within the C. elegans body, the probe showed emission from the collagen-rich external cuticle layer (Fig. 6a and b). This layer shields the animal from the external environmental factors (like toxins, chemical agents, and heat), aids in locomotion and sensing the environment.58 Emission was also seen from the grinder region of the pharyngeal pump, which comprises multiple layers of thick rigid cuticle,59 as shown in Fig. 6c and d. The grinder region is essential for the animal to rupture the bacteria that it feeds on. This is the part of C. elegans where mechanical digestion takes place. The movement of pharyngeal muscles rotates the teeth of the grinder region which causes the ingested bacteria to rupture and release their contents into the intestinal lumen for further digestion.60 The cuticle is made of electron-dense multiple pillar-like struts, which might interfere and create a steric barrier, increasing the viscosity of its immediate environment and causing the fluorescence emission of the probe.61 The other area from which emission was most prominent was of intracellular origin in the form of large globular structures within the intestinal cells (Fig. 6e and f). The other part of C. elegans from where emission of Cy–Cl was observed was the brush border of the intestine (Fig. 6g and h). The contrast of Fig. 6h has been improved to make the brush border clearly visible in C. elegans. The brush border is an essential component of C. elegans's anatomy since it increases the surface area of the intestinal epithelial membrane, aids in nutrient absorption and processing, and plays a role in host defense as well. The brush border is made of a highly dense and viscous layer of microvilli and glycocalyx,62 and the resulting change in viscosity might be the cause of emission from the region.
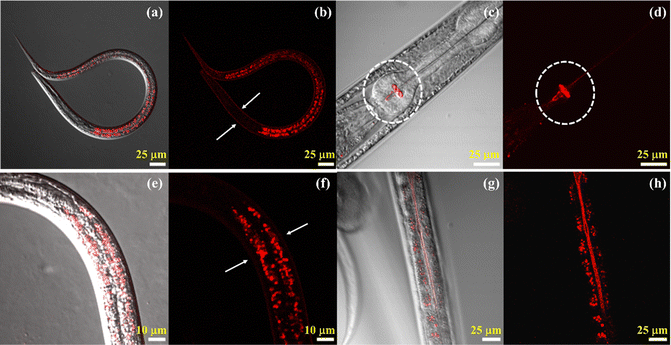 | ||
| Fig. 6 Imaging different parts of the viscous region in C. elegans using the Cy–Cl probe: (a) and (b) cuticle layer, (c) and (d) pharynx, (e) and (f) globular structure and (g) and (h) brush border. | ||
It has been reported that in higher animals, after food intake the quantity of microvilli and glycocalyx in the intestinal border wall increases.63 Based on this report, we decided to see if there is any change in emission properties from the intestinal brush border and lumen of C. elegans upon feeding. Stained animals were fed with E. coli OP-50 for 1 hour and then proceeded for imaging. We observed a drastic increase in fluorescence within the intestinal lumen of the worms after they were fed, as can be seen in Fig. 7a–d in the form of a bright red line running down the length of the intestine of C. elegans. This increase in intensity may be a byproduct of the increase in luminal viscosity that occurs after eating, which slows down bowel movements and allows nutrient absorption slowly and efficiently from the ingested food, a process well studied in higher animals, as explained above. Hence, from these data, we can put forth the idea that C. elegans can be used as a model system to study intestinal viscosity-related biological phenomena like nutrient absorption and bowel movements, and their overall effect on the health of the organism. We also found that the emission properties of the intestinal lumen remained unchanged concerning age, as can be seen when we compared L2 & L3 stage of C. elegans with the adult; not much change was seen from the results in Fig. 7e–h.
Finally, we also checked the dead cell imaging of C. elegans using the probe. During cell death in a living biological system, there is a local increase in viscosity which takes place due to increased crosslinking of nearby proteins and accumulation of lipids, resulting in aggregation and reduction in the diffusion of cellular components.64 A similar phenomenon is observed in C. elegans wherein we observed Cy–Cl dye-related emission from the whole body of the organism from dead specimens, compared to live animals which showed little to no emission (Fig. 7i and j). It should be important to note that we purposefully decided to decrease the laser power for this experiment because the intensity required for imaging the live specimens would give a supersaturated result for the dead specimen. From this, we can state that there is a huge increase in the viscosity within an animal upon its death, as seen by the increase in probe-related emission from the dead specimens (Fig. 7k and l). In summary, it could be highlighted that the Cy–Cl probe is highly efficient in getting a detailed picture of C. elegans viscosity and has the ability to differentiate dead and live C. elegans in a sample.
Conclusion
We have implemented a viscosity-based water-soluble NIR emitting Cy–Cl probe to accurately distinguish live and dead cells during apoptosis and ferroptosis in different animal cells (HeLa, HEK 293A, and Hep G2) and in plant cells. The probe exhibited good aqueous solubility and high photostability with less cytotoxicity. Moreover, the probe has desirable performance navigation of C. elegans, enabling the visualization of the most viscous region of the worm, viz. intestinal cells, explicitly targeting the brush border, grinder region of the pharyngeal pump, and external cuticle layer. Also, enables the visualization of the whole body of the dead worm based on the increased viscosity. We hope that the proposed probe can be successfully implemented to visualize the dead cells in live and dead cell populations for pathological investigations and biomedical applications.Author contributions
CKN designed and conceptualized experiments with the help of GS and FA. GS synthesized and purified the probe and performed all the photophysical and confirmatory characterization with the help of AS. FA performed all the cell culture-related experiments and confocal fixed and live cell imaging with the help of AS, RG, and PB. AS and BM analyzed the data and performed confocal imaging of C. elegans. SC performed plant cell study and analyzed the data. BM maintained C. elegans and prepared the worm sample for imaging. SS and KK performed the lifetime experiments and did the analysis. CKN wrote the manuscript with the help of FA, GS, AS, and BM. C. K. N. guided the complete project.Data availability
The data (instrumentation, synthetic procedures, structural characterization data, photophysical study, and confocal imaging) that support this article are available in the article itself and its ESI.†Conflicts of interest
The authors declare no competing interest.Acknowledgements
CKN acknowledge the Council of Scientific & Industrial Research (CSIR) (Project No.: IITM/CSIR/CKN/449) and SERB core research grant (CRG) (Project No.: CRG/2020/000268). The authors thank the Advanced Materials Research Centre (AMRC) and the BioX Centre of the Indian Institute of Technology Mandi (IIT Mandi) for providing the facilities and the sophisticated instruments. All the contributing authors thank the Ministry of Education (MoE), India, for the research scholarship. RG acknowledges the Prime Minister Research Fellowship (PMRF) of India.References
- Y. Xia, J. Zhang and G. Liu, Nano Today, 2023, 48, 101740 CrossRef CAS.
- S. Shen, Y. Shao and C. Li, Cell Death Discovery, 2023, 9, 284 CrossRef.
- W. Park, S. Wei, B. S. Kim, B. Kim, S. J. Bae, Y. C. Chae, D. Ryu and K. T. Ha, Exp. Mol. Med., 2023, 55, 1573–1594 CrossRef CAS PubMed.
- Y. Yu, Y. Yan, F. Niu, Y. Wang, X. Chen, G. Su, Y. Liu, X. Zhao, L. Qian, P. Liu and Y. Xiong, Cell Death Discovery, 2021, 7, 193 CrossRef CAS.
- O. Nadiv, M. Shinitzky, H. Manu, D. Hecht, C. T. Roberts, D. LeRoith and Y. Zick, Biochem. J., 1994, 298, 443–450 CrossRef CAS PubMed.
- K. Luby-Phelps, Int. Rev. Cytol., 1999, 192, 189–221 Search PubMed.
- Y. Akamatsu and K. A. Hanafy, Neurotherapeutics, 2020, 17, 446–456 CrossRef PubMed.
- J. Seo and M. Park, Cell. Mol. Life Sci., 2020, 77, 2659–2680 CrossRef CAS.
- B. Greve, R. Kelsch, K. Spaniol, H. T. Eich and M. Götte, Cytometry, Part A, 2012, 81A, 284–293 CrossRef.
- X. Wen, C. Zhang, Y. Tian, Y. Miao, S. Liu, J. J. Xu, D. Ye and J. He, JACS Au, 2024, 4, 2426–2450 CrossRef CAS PubMed.
- H. Y. Wang, X. W. Hua, H. R. Jia, C. Li, F. Lin, Z. Chen and F. G. Wu, ACS Biomater. Sci. Eng., 2016, 2, 987–997 CrossRef CAS.
- H. R. Jia, H. Y. Wang, Z. W. Yu, Z. Chen and F. G. Wu, Bioconjugate Chem., 2016, 27, 782–789 CrossRef CAS PubMed.
- Y. Guo, X. Zhang and F. G. Wu, J. Colloid Interface Sci., 2018, 530, 511–520 CrossRef CAS.
- H. R. Jia, Y. X. Zhu, K. F. Xu, G. Y. Pan, X. Liu, Y. Qiao and F. G. Wu, Chem. Sci., 2019, 10, 4062–4068 RSC.
- R. Yang, T. Zhu, J. Xu, Y. Zhao, Y. Kuang, M. Sun, Y. Chen, W. He, Z. Wang, T. Jiang, H. Zhang and M. Wei, Molecules, 2023, 28, 3455 CrossRef CAS PubMed.
- Q. Yang and X. T. Cui, MRS Bull., 2023, 48, 506–517 CrossRef.
- J. P. Robinson, R. Ostafe, S. N. Iyengar, B. Rajwa and R. Fischer, Cells, 2023, 12, 1875 CrossRef CAS.
- M. Lan, S. Zhao, S. Wu, X. Wei, Y. Fu, J. Wu, P. Wang and W. Zhang, Nano Res., 2019, 12, 2576–2583 CrossRef CAS.
- D. Zhang, Q. Jin, C. Jiang, M. Gao, Y. Ni and J. Zhang, Bioconjugate Chem., 2020, 31, 1025–1051 CrossRef CAS PubMed.
- A. A. Neves and K. M. Brindle, J. Nucl. Med., 2014, 55, 1–4 CrossRef CAS.
- A. Shekhar, P. Heeger, C. Reutelingsperger, E. Arbustini, N. Narula, L. Hofstra, J. J. Bax and J. Narula, JACC Cardiovasc. Imaging, 2018, 11, 476–493 CrossRef PubMed.
- A. A. Rybczynska, H. H. Boersma, S. de Jong, J. A. Gietema, W. Noordzij, R. A. J. O. Dierckx, P. H. Elsinga and A. van Waarde, Med. Res. Rev., 2018, 38, 1713–1768 CrossRef.
- T. Vanden Berghe, S. Grootjans, V. Goossens, Y. Dondelinger, D. V. Krysko, N. Takahashi and P. Vandenabeele, Methods, 2013, 61, 117–129 CrossRef CAS PubMed.
- A. J. Plaunt, K. M. Harmatys, W. R. Wolter, M. A. Suckow and B. D. Smith, Bioconjugate Chem., 2014, 25, 724–737 CrossRef CAS.
- D. Zhang, M. Gao, Q. Jin, Y. Ni, H. Li, C. Jiang and J. Zhang, Mol. Imaging Biol., 2022, 24, 612–629 CrossRef CAS PubMed.
- K. J. Clear, K. M. Harmatys, D. R. Rice, W. R. Wolter, M. A. Suckow, Y. Wang, M. Rusckowski and B. D. Smith, Bioconjugate Chem., 2016, 27, 363–375 CrossRef CAS.
- Y. Wang, R. Zhao, X. Zhu, H. Gao, C. Gong, X. Liu and H. Zhang, Anal. Chem., 2022, 94, 13413–13421 CrossRef CAS PubMed.
- S. Lu, Z. Dai, Y. Cui and D. M. Kong, Biosensors, 2020, 15, 223 Search PubMed.
- Y. Lu, B. Dong, W. Song, Y. Sun, A. H. Mehmood and W. Lin, Spectrochim. Acta, Part A, 2020, 240, 118588 CrossRef CAS.
- T. Liu, X. Liu, D. R. Spring, X. Qian, J. Cui and Z. Xu, Sci. Rep., 2014, 4, 1–7 CrossRef.
- S. Park, W. H. Jung, M. Pittman, J. Chen and Y. Chen, J. Biomech. Eng., 2020, 142, 1–11 Search PubMed.
- J. F. R. Kerr, C. M. Winterford and B. V. Harmon, Cancer, 1994, 73, 2013–2026 CrossRef CAS.
- U. Resch-Genger, M. Grabolle, S. Cavaliere-Jaricot, R. Nitschke and T. Nann, Nat. Methods, 2008, 5, 763–775 CrossRef CAS.
- J. Liu, W. Zhang, C. Zhou, M. Li, X. Wang, W. Zhang, Z. Liu, L. Wu, T. D. James, P. Li and B. Tang, J. Am. Chem. Soc., 2022, 144, 13586–13599 CrossRef CAS PubMed.
- S. J. Dixon, D. Patel, M. Welsch, R. Skouta, E. Lee, M. Hayano, A. G. Thomas, C. Gleason, N. Tatonetti, B. S. Slusher and B. R. Stockwell, eLife, 2014, 2014, 1–25 Search PubMed.
- B. A. Smith, S. Xiao, W. Wolter, J. Wheeler, M. A. Suckow and B. D. Smith, Apoptosis, 2011, 16, 722–731 CrossRef PubMed.
- H. Li, W. Shi, X. Li, Y. Hu, Y. Fang and H. Ma, J. Am. Chem. Soc., 2019, 141, 18301–18307 CrossRef CAS PubMed.
- L. Y. Xia, X. Zhang, M. Cao, Z. Chen and F. G. Wu, Biomacromolecules, 2017, 18, 3073–3081 CrossRef CAS PubMed.
- Y. Suzuki, K. Kikuchi, K. Numayama-Tsuruta and T. Ishikawa, J. Exp. Biol., 2020, 15, 223 Search PubMed.
- L. Marciani, P. A. Gowland, R. C. Spiller, P. Manoj, R. J. Moore, P. Young and A. J. Fillery-Travis, Am. J. Physiol.: Gastrointest. Liver Physiol., 2001, 280, 1227–1233 CrossRef PubMed.
- T. E. Moxon, P. Nimmegeers, D. Telen, P. J. Fryer, J. Van Impe and S. Bakalis, Chem. Eng. Sci., 2017, 171, 318–330 CrossRef CAS PubMed.
- Y. Suzuki, K. Kikuchi, K. Numayama-Tsuruta and T. Ishikawa, Sci. Rep., 2022, 12, 1–11 CrossRef.
- Y. F. Ou, T. B. Ren, L. Yuan and X. B. Zhang, Chem. Biomed. Imaging, 2023, 1, 220–233 CrossRef CAS.
- A. C. B. Rodrigues, D. Wetterling, U. Scherf and J. S. Seixas de Melo, Chem. - Eur. J., 2021, 27, 7826–7830 CrossRef CAS PubMed.
- Y. Zhang, Z. Li, W. Hu and Z. Liu, Anal. Chem., 2019, 91, 10302–10309 CrossRef CAS.
- X. W. Yu, X. Liu, Y. W. Jiang, Y. H. Li, G. Gao, Y. X. Zhu, F. Lin and F. G. Wu, Anal. Chem., 2022, 94, 4243–4251 CrossRef CAS.
- C. H. Jia, M. Li, J. Liu, L. Zhao, J. Lin, P. L. Lai, X. Zhou, Y. Zhang, Z. G. Chen, H. Y. Li, A. L. Liu, C. L. Yang, T. M. Gao, Y. Jiang and X. C. Bai, Cell Death Differ., 2013, 20, 248–258 CrossRef CAS PubMed.
- Y. X. Chuanhao Liu, Lin Zhou, Lijuan Xie, Ying Zheng and Huizi Man, Chin. Chem. Lett., 2016, 33, 1–23 CrossRef CAS.
- J. Liu, F. Meng, J. Lv, M. Yang, Y. Wu, J. Gao, J. Luo, X. Li, G. Wei, Z. Yuan and H. Li, Spectrochim. Acta, Part A, 2023, 295, 122602 CrossRef CAS.
- L. Chai, T. Liang, Q. An, W. Hu, Y. Wang, B. Wang, S. Su and C. Li, Anal. Chem., 2022, 94, 5797–5804 CrossRef CAS PubMed.
- X. Li, R. Zhao, Y. Wang and C. Huang, J. Mater. Chem. B, 2018, 6, 6592–6598 RSC.
- Y. Song, H. Zhang, X. Wang, X. Geng, Y. Sun, J. Liu and Z. Li, Anal. Chem., 2021, 93, 1786–1791 CrossRef CAS PubMed.
- K. Kaushik, A. Yadav, F. Anjum, P. Mani Mishra, S. Sharma, C. Rao and C. Kanti Nandi, ChemNanoMat, 2022, 8, e202200235 CrossRef CAS.
- W. E. Meador, S. A. Autry, R. N. Bessetti, J. N. Gayton, A. S. Flynt, N. I. Hammer and J. H. Delcamp, J. Org. Chem., 2020, 85, 4089–4095 CrossRef CAS PubMed.
- A. Koshkaryev, R. Thekkedath, C. Pagano, I. Meerovich and V. P. Torchilin, J. Drug Targeting, 2011, 19, 606–614 CrossRef CAS PubMed.
- L. He, C.-P. Tan, R.-R. Ye, Y.-Z. Zhao, Y.-H. Liu, Q. Zhao, L.-N. Ji and Z.-W. Mao, Angew. Chem., Int. Ed., 2014, 53, 12137–12141 CrossRef CAS.
- H. Sontheimer and R. J. Bridges, Expert Opin. Invest. Drugs, 2012, 21, 575–578 CrossRef CAS PubMed.
- C. A. Edwards, N. A. Blackburn, L. Craigen, P. Davison, J. Tomlin, K. Sugden, I. T. Johnson and N. W. Read, Am. J. Clin. Nutr., 1987, 46, 72–77 CrossRef CAS.
- M. Kamal, L. Tokmakjian, J. Knox, P. Mastrangelo, J. Ji, H. Cai, J. W. Wojciechowski, M. P. Hughes, K. Takács, X. Chu, J. Pei, V. Grolmusz, M. Kotulska, J. D. Forman-Kay and P. J. Roy, eLife, 2022, 11, 1–34 CrossRef.
- A. Bidaud-Meynard, F. Demouchy, O. Nicolle, A. Pacquelet, S. Kumar Suman, C. N. Plancke, F. B. Robin and G. Michaux, Development, 2024, 11, 151 Search PubMed.
- J. R. G. Adams, M. Pooranachithra, E. M. Jyo, S. L. Zheng, A. Goncharov, J. R. Crew, J. M. Kramer, Y. Jin, A. M. Ernst and A. D. Chisholm, Nat. Commun., 2023, 14, 7506 CrossRef CAS.
- A. P. Sparacio, N. F. Trojanowski, K. Snetselaar, M. D. Nelson and D. M. Raizen, PLoS One, 2020, 15, 1–24 CrossRef.
- T. Saito, K. Kikuchi and T. Ishikawa, Biochem. Biophys. Res. Commun., 2024, 706, 149762 CrossRef CAS PubMed.
- A. N. Makanya, J. N. Maina, T. M. Mayhew, S. A. Tschanz and P. H. Burri, J. Exp. Biol., 1997, 200, 2415–2423 CrossRef CAS.
Footnotes |
| † Electronic supplementary information (ESI) available. See DOI: https://doi.org/10.1039/d4tb01945h |
| ‡ Goraksha T. Sapkal and Farhan Anjum have first equal contribution to this work. |
| § Abdul Salam and Bodhidipra Mukherjee have second equal contribution to this work. |
| This journal is © The Royal Society of Chemistry 2025 |


