Laser induced disruption of bacterial spores on a microchip†
Oliver
Hofmann
a,
Kirk
Murray
b,
Alan-Shaun
Wilkinson
c,
Timothy
Cox
c and
Andreas
Manz
*d
aDepartment of Chemistry, Imperial College London, London, UK SW7 2AY
bDstl, Detection Department, Porton Down, Salisbury, Wiltshire, UK SP4 OJQ
cQinetiQ, Malvern Technology Centre, Malvern, Worcestershire, UK WR14 3PS
dISAS (Institute of Spectrochemistry and Applied Spectroscopy), 44139 Dortmund, Germany. E-mail: a.manz@isas-dortmund.de; Fax: +49 231 1392 300; Tel: +49 231 1392 103/102
First published on 23rd February 2005
Abstract
We report on the development of a laser based spore disruption method. Bacillus globigii spores were mixed with a laser light absorbing matrix and co-crystallized into 200-µm-wide and 20-µm-deep nanovials formed in a polydimethylsiloxane (PDMS) target plate. Surface tension effects were exploited to effect up to 125-fold spore enrichment. When the target zones were illuminated at atmospheric pressure with pulsed UV-laser light at fluences below 20 mJ cm−2 a change in spore morphology was observed within seconds. Post illumination PCR analysis suggests the release of endogenous DNA indicative of spore disruption. For laser fluences above 20 mJ cm−2, desorption of spores and fragments was also observed even without a matrix being employed. Desorbed material was collected in a PDMS flowcell attached to the target plate during laser illumination. This opens up a route towards the direct extraction of released DNA in an integrated spore disruption–PCR amplification microchip device.
Introduction
Recent events in the US have reiterated the need for rapid and accurate detection of bacterial spores such as Bacillus anthracis.1,2 Current detection techniques include a culture test based on spore germination3 as well as immunoassays4,5 and MALDI-MS6 aimed at the detection of protein biomarkers on the spore surface. Highest specificity and sensitivity are afforded by PCR based nucleic acid tests which require spore disruption to release DNA.7 Sonication devices have been developed in which spores are contained within a static chamber comprising a filter membrane.8,9 However, these batch mode disruption devices require a 90-min lysozyme spore pretreatment to break down the protective spore cortex. Recently a flow-through disruptor based on radially focused ultrasound has been reported, which disrupts non-pretreated spores within 62 s.10 However, DNA fragmentation induced by the applied megahertz ultrasound could severely limit the availability of intact endogenous DNA.Here we present an alternative ultrafast approach comprising a microchip for laser induced spore disruption and concurrent extraction of released endogenous DNA (Fig. 1). The spore sample is first mixed with an aqueous solution of laser light absorbing matrix and a drop is applied onto a microstructured nanovial on a target plate. Upon evaporation the drop remains pinned to the nanovial due to surface tension effects and spores/matrix co-crystallize into the vial. Drop volumes larger than the nanovial result in spore enrichment. A flowcell with a microstructured channel is then attached to the target plate. Illumination of the sample zone with pulsed UV laser light effects an explosive disintegration of the matrix and desorption.11 Concurrently disruption of the outer spore layers is induced, while endogenous DNA is protected from UV damage through unique small acid-soluble spore proteins (SASPs).12 Dipicolinic acid (DPA), a major constituent of the spore coat and core, is also reported to exert a strong photoprotective effect in air-dried spores.13 Interestingly, both DPA and SASPs have been detected in MALDI-MS studies of Bacillus spores, indicating the release of endogenous content during laser illumination.14,15
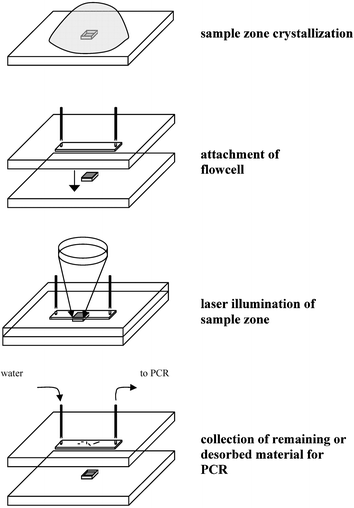 | ||
| Fig. 1 Schematic of laser induced spore disruption on a microchip. | ||
Here any released DNA is recovered for PCR amplification by either redissolving the remaining sample zone or by flushing the microchannel to recover deposited material. This integrated approach combines ultrafast spore disruption with enrichment and amplification steps for high sensitivity.
Experimental
Microchip fabrication
The nanovial target plate and flow cell were fabricated by polydimethylsiloxane (PDMS) molding from SU-8 masters. Negative tone SU-8 photoresist was first spun onto a glass support at 1500 or 3000 rpm yielding ∼20 and 10-µm-thick layers, respectively (Microchem Corp, Newton, MA). Soft-baking was performed on a hot plate at 95 °C for 3 min. Exposure of the SU-8 substrate was through a chromium mask fabricated in-house. In short, the nanovial and microchannel layouts were designed in AutoCAD and transferred onto a glass wafer pre-coated with chromium and positive photoresist (Nanofilm, Westlake Village, CA) using a direct writing laser system (DWL2.0, Heidelberg Instruments, Germany). Illuminated photoresist was subsequently removed with developing solution (Microposit, UK) and exposed chromium etched away with Lodyne etchant (Microchem Systems, UK), yielding the mask. Illumination of the SU-8 substrate through the mask was performed for 20 s with a 200 Watt UV lamp in a customized collimating lamp housing (Goulding&Partners, UK). This was followed by a post exposure bake for 15 min at 95 °C and development with propylene glycol monomethyl ether acetate (PGMEA). For PDMS molding a 10 ∶ 1 w/w-mixture of monomer and hardener (Sylgard 184, Dow Corning) was degassed under vacuum for 10 min, poured onto the SU-8 master and then cured for 1 h at 95 °C. After peeling off the polymerized PDMS, reservoir access holes were punched from the structured side with a gauge 22 syringe needle with rounded-off tip (BD, UK). Fused silica capillaries (150-µm-ID, 375-µm-OD, Composite Metal Services, UK) were inserted as reservoirs, supported with graphite ferules (Supletex M-2B, SWE, UK) and permanently fixed with cyanoacrylate primer and adhesive (707 and prism 406, Loctite). For assembly of the microchip, a PDMS plate comprising the flowcell microchannels was reversibly sealed to a nanovial target plate. The flowcell microchannels were 800-µm-wide, 10-µm-deep and 5-mm-long (volume 40 nL). The squared nanovials in the target plate were 200-µm-wide and 20-µm-deep (volume 0.8 nL).Sample preparation
Bacillus globigii spore suspensions were provided by DSTL (Porton Down, UK). To remove any extra-cellular DNA, a spore surface decontamination procedure was implemented.10 To this end, the spore stock suspension (2 × 10¹⁰ cfu mL−1) was centrifuged, the supernatant removed, and the spores re-suspended in 10 v/v-% hypochlorite solution (BDH, UK). After treatment for 10 min the suspension was centrifuged again, the supernatant removed, and the spores were washed six times with sterile water. Finally the spores were re-suspended in the starting volume of sterile water. This surface decontamination treatment was validated by performing PCR directly on the treated spores, yielding only a negligible signal. For laser illumination experiments, the treated stock spore suspension was diluted to 108 cfu mL−1 with water and mixed 1 ∶ 1 with 3-hydroxypicolinic acid (3-HPA) dissolved in acetonitrile–water (Lancaster Synthesis, UK). During optimization of the sample application method 10 µM fluorescein solution was used instead of spore suspensions. 0.1, 1 or 10 µL of the sample–matrix mixture were pipetted onto the nanovials on the target plate using gel loading pipette tips (PQP-150-130C, Fisher Scientific, UK). Upon solvent evaporation a solid deposit of analyte (spore)-doped matrix was obtained in the nanovial. For desorption experiments the PDMS-flowcell was attached to the nanovial plate prior to laser illumination.Laser illumination
For illumination of the spore samples in the target plate nanovials, a 6 mW nitrogen laser with pulsed output at 337 nm was employed (VSL-337 ND-S, Laser Science, Franklin, MA). A peak power of 75 kW and 4 ns pulse width yielded pulse energies of 300 µJ. Different optical set-ups were used to vary the effective laser fluence, which affects spore disruption and desorption. For optical set-up 1, a 200 µm-ID optical fiber was connected to the laser via a Hyrax fiber optic coupler (both Laser Science). In spore illumination experiments, the end of the optical fiber was typically positioned ∼1 mm above the target plate, resulting in an effective beam diameter on the spore target of ∼1 mm (Table 1). To increase the laser fluence on the target zones two additional optical configurations were implemented. For optical set-up 2, two identical plano-convex fused silica lenses with 30 mm focal length (014-0490, Laser 2000, UK) were used to re-focus the diverging output of the optical fiber. Beam diameters on the target plate were typically ∼0.5 mm. Optical set-up 3 was based on an open beam configuration. The laser beam was directed with a HeCd/N2 laser mirror (034-0280, Laser 2000) and focused onto the target zone with one of the plano-convex lenses. Beam diameters on the target plate were typically ∼0.2 mm. For operational safety, the optical set-ups were enclosed by a customized Perspex box and the target plate was positioned on a beam terminator (119-0785, Laser 2000).PCR detection
After laser illumination the remaining target material was re-dissolved in 1 µL of sterile water to perform PCR. The sample volume was added to 12.5 µL of 2x PCR master mix (DNAmp, BioGene, UK), 2.5 µL forward primer (ACT TCG AGG TGC GTG AAC G, Oswell, UK), 2.5 µL reverse primer (TGG AAT TTC GAT TTC TTC ACC TG) and 6.5 µL sterile water. Non-illuminated spore–matrix targets served as negative controls. 35 cycles were run on a PCR System 9700 (Gene Amp). Melting was achieved by heating at 95 °C for 10 s, extension at 60 °C for 10 s, and annealing at 74 °C for 20 s. The final step was an extension at 72 °C for 5 min. Sizing of the PCR mix after amplification was performed on a Bioanalyzer 2100 with DNA 500 microfluidic cartridge (Agilent).Results and discussion
Initial experiments were concerned with obtaining well defined, spore containing target zones in the PDMS nanovials. Borrowing techniques developed for MALDI-MS the spores were embedded into a laser light absorbing matrix. 3-HPA was chosen as a suitable matrix due to high UV absorption, low fragmentation effects on target DNA and good solubility in water.16 It should be noted that in contrast to MALDI-MS, ionization is not critical for laser induced spore disruption. For sample application, the dried droplet method by Karas and Hillenkamp17 was adapted for deposition into microstructured nanovials. Matrix content and solvent composition were optimized for target zone confinement, uniformity/density of deposit and evaporation time. Solutions containing 10 to 60 mg mL−1 3-HPA and 10 to 70 v/v-% acetonitrile were tested. Best results were obtained for 10 mg mL−1 3-HPA and 50 v/v-% acetonitrile. Evaporation times of ∼4 min yielded excellent target zone confinement and uniform, dense deposits. Premature crystallization was prevented by the low matrix content, whilst shorter evaporation times were induced by the volatile organic solvent present, resulting in smaller crystals and denser deposits. Higher percentages of organic solvent showed an adverse effect on the target zone confinement. Presumably, this was due to the lower surface tension induced by the presence of the organic solvent.For standard sample application, 0.1 µL of sample–matrix mix was evaporated into a 0.8 nL nanovial, thereby achieving a 125-fold enrichment. Subsequent experiments were aimed at improving this enrichment. First experiments with multiple droplet application into the same nanovial were unsuccessful. Complete re-dissolving of the previously deposited zones and progressive confinement problems were observed, presumably due to the increasing matrix content. In subsequent experiments the applied volume was increased from 0.1 to 1 µL and 10 µL, while the matrix concentration was lowered accordingly. For an applied volume of 1 µL good confinement was observed but evaporation times at room temperature were ∼15 min. Application of 10 µL resulted in poor confinement and only limited crystal formation. Presumably this was due to a reduced excess of matrix over sample (∼70-fold).
While the use of nanovials in MALDI-MS had been first suggested by Jespersen et al.,18a the sample application was based on a fast evaporation method and the applied volume was smaller than the employed silicon nanovials.18b Recently Ekstrom et al. have demonstrated effective enrichment by repeated application of up to 6![[thin space (1/6-em)]](https://www.rsc.org/images/entities/char_2009.gif) 000 droplets into the same nanovial, resulting in up to 67-fold enrichment.19,20 However, sophisticated positioning equipment and micro-dispensers were required. Here we used simple hydrophobic PDMS nanovials which assist in the confinement of the evaporating drop and allow for manual application of larger drop volumes. This is intrinsically similar to the method developed by Schuerenberg et al. which requires hydrophilic gold sample anchors on hydrophobic Teflon plates.21
000 droplets into the same nanovial, resulting in up to 67-fold enrichment.19,20 However, sophisticated positioning equipment and micro-dispensers were required. Here we used simple hydrophobic PDMS nanovials which assist in the confinement of the evaporating drop and allow for manual application of larger drop volumes. This is intrinsically similar to the method developed by Schuerenberg et al. which requires hydrophilic gold sample anchors on hydrophobic Teflon plates.21
For spore disruption, the optimized sample application conditions were applied to 0.1 µL of 108 cfu mL−1 pretreated Bacillus globigii spores. This resulted in ∼10000 spores in the nanovial. Dense, uniform deposits with 5 to 10-µm-long needle shaped matrix crystals and embedded spores were obtained. A tendency for spore cluster formation and increased deposit thickness at the edges was observed. For first disruption experiments at low and medium laser fluence (optical set-ups 1 and 2, Table 1), the spore/matrix zone on the target plate was illuminated directly without attachment of the PDMS flowcell. Illumination times of 1 h, 30 min, 10 min, 5 min, 1 min, 30 s, 10 s, 5 s and 1 s were used. After illumination, the consistency of the sample zone was severely altered under all illumination conditions employed, with now significantly denser deposits. This was attributed to the formation of crushed crystals.22 Independent of the illumination time, desorption was not observed under these conditions. Presumably this was because the effective laser fluence at the target zone was below the desorption threshold (typically ∼10 mJ cm−2, see ref 6). To check for possible disruption of the remaining spores, the target zones were re-dissolved in 1 µL sterile water and PCR was performed. The observed product peak indicates the release of DNA even after just 1 s of laser illumination (Fig. 2). Spores that had not been illuminated served as a negative control and yielded no significant product peak. Furthermore, electron micrographs of the spore target zone after illumination showed a change in spore morphology indicating disruption of the spores.
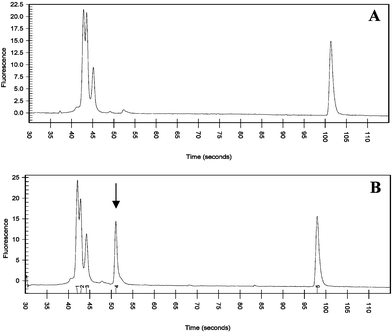 | ||
| Fig. 2 PCR results for 108 cfu mL−1B. globigii spores after laser illumination. (A) no laser illumination (negative control) (B) ∼1 s laser illumination at 40 µJ cm−2. Peaks 1–5 correspond to lower sizing marker (15 bp), forward primer (19 bp), reverse primer (23 bp), B. globigii product (78 bp) and higher sizing marker (600 bp), respectively. | ||
In order for spore desorption to be induced, a laser fluence of ∼170 mJ cm−2 was used (Table 1). This is significantly above the commonly reported threshold for desorption and plume ejection. Under these conditions desorption was observed with or without attached PDMS flowcell, with a direct correlation between illumination time and amount of desorbed material. Some damage to the upper surface of the PDMS flowcell was observed under prolonged illumination. Interestingly, desorption was also observed when the MALDI matrix was omitted from the target zone. This finding is consistent with results reported in the literature.23 We attribute this effect to DPA which accounts for ∼10% of total spore dry weight.13 DPA is a close homologue to 3-HPA and could thus serve as an internal UV light absorbing matrix. When the PDMS flowcell was attached to the target plate, a uniform zone of deposited material could be observed in the opposing microchannel segment after laser illumination. Electron micrographs revealed deformed and apparently deflated spores, indicative of near complete disruption (Fig. 3). Interestingly, the morphology resembled that of disrupted spores after sonication.9,10 Here the observed spore disruption and concurrent desorption of endogenous content could provide a route towards the direct extraction of released DNA in the flowcell, e.g.via a vertical air–liquid layer interface.
 | ||
| Fig. 3 SEM images of spores before and after laser illumination at 170 mJ cm−2. (A) 108 cfu mL−1B. globigii spores embedded in 10 mg mL−1 3-HPA matrix. (B) B. globigii spores desorbed from nanovial and deposited into flowcell microchannel after 2 min laser illumination at 30 Hz. For (B) no MALDI matrix was employed to facilitate interpretation of deposited fragments. | ||
Conclusion
A novel laser based disruption technique for bacterial spores was developed. Spores were mixed with MALDI matrix and co-crystallized into microstructured nanovials on a PDMS target plate. Surface tension effects have been exploited, enabling up to 125-fold spore enrichment. Illumination of target zones at atmospheric pressure with laser fluences below 20 mJ cm−2 resulted in a significant change in spore morphology within a few seconds. PCR analysis of illuminated spores suggests the release of endogenous DNA, which is indicative of spore disruption. For a laser fluence above 20 mJ cm−2 desorption of spores was also observed even without the presence of a MALDI matrix. The developed method affords ultra-fast spore disruption and addresses sensitivity requirements through on chip spore enrichment and DNA amplification steps. Further advances in laser diode technology permitting, this method could be used in portable high sensitivity spore detection devices.Acknowledgements
This research was supported by the Materials Domain of the UK MoD Corporate Research Program.Notes and references
- M. Enserink, Science, 2001, 294, 1266–1267 CrossRef CAS.
- C. M. Harris, Anal. Chem., 2002, 74, 127A–133A .★Excellent overview on detection technologies for anthrax spores.
- K. Sekiguchi, K. Akeo, H. Yamamoto, F. K. Khasanov, J. C. Alonso and A. Kuroda, J. Bacteriol., 1995, 177, 5582–5589.
- J. B. Delehanty and F. S. Ligler, Anal. Chem., 2002, 74, 5681–5687 CrossRef CAS.
- D. N. Stratis-Collum, G. D. Griffin, J. Mobley, A. A. Vass and T. Vo-Dinh, Anal. Chem., 2003, 75, 275–280 CrossRef CAS.
- Y. Hathout, P. A. Demirev, Y. P. Ho, J. L. Bundy, V. Ryzhov, L. Sapp, J. Stutler, J. Jackman and C. Fenselau, Appl. Environ. Microbiol., 1999, 65, 4313–4319 CAS.
- P. Belgrader, W. Benett, D. Hadley, J. Richards, P. Stratton, R. Mariella and F. Milanovich, Science, 1999, 284, 449–450 CrossRef CAS .★First use of minisonicator to disrupt Bacillus spores for PCR analysis. Batch process for lysozyme pretreated spores.
- P. Belgrader, D. Hansford, G. T. A. Kovacs, K. Venkateswaran, R. Mariella, F. Milanovich, S. Nasarabadi, M. Okuzumi, F. Pourahmadi and M. A. Northrup, Anal. Chem., 1999, 71, 4232–4236 CrossRef CAS.
- M. T. Taylor, P. Belgrader, B. J. Furman, F. Pourahmadi, G. T. A. Kovacs and M. A. Northrup, Anal. Chem., 2001, 73, 492–496 CrossRef CAS.
- D. P. Chandler, J. Brown, C. J. Bruckner-Lea, L. Olson, G. J. Posakony, J. R. Stults, N. B. Valentine and L. J. Bond, Anal. Chem., 2001, 73, 3784–3789 CrossRef CAS.
- A. A. Puretzky, D. B. Geohegan, G. B. Hurst, M. V. Buchanan and B. S. Luk'yanchuk, Phys. Rev. Lett., 1999, 83, 444–447 CrossRef CAS.
- W. L. Nicholson, N. Munakata, G. Horneck, H. J. Melosh and P. Setlow, Microbiol. Mol. Biol. Rev., 2000, 64, 548–572 CrossRef CAS.
- T. A. Slieman and W. L. Nicholson, Appl. Environ. Microbiol., 2001, 67, 1274–1279 CrossRef CAS.
- P. T. Steele, H. J. Tobias, D. P. Fergenson, M. E. Pitesky, J. M. Horn, G. A. Czerwieniec, S. C. Russell, C. B. Lebrilla, E. E. Gard and M. Frank, Anal. Chem., 2003, 75, 5480–5487 CrossRef CAS.
- V. Ryzhov, Y. Hathout and C. Fenselau, Appl. Environ. Microbiol., 2000, 66, 3828–3834 CrossRef CAS.
- F. Kirpekar, S. Berkenkamp and F. Hillenkamp, Anal. Chem., 1999, 71, 2334–2339 CrossRef CAS.
- M. Karas and F. Hillenkamp, Anal. Chem., 1988, 60, 2299–2301 CrossRef CAS.
- (a) S. Jespersen, W. M. A. Niessen, U. R. Tjaden, J. v. d. Greef, E. Litborn, U. Lindberg and J. Roeraade, Rapid Commun. Mass Spectrom., 1994, 8, 581–584 CAS; (b) D. P. Little, T. J. Cornish, M. J. O'Donnell, A. Braun, R. J. Cotter and H. Koester, Anal. Chem., 1997, 69, 4540–4546 CrossRef CAS.
- S. Ekstrom, P. Onnerfjord, J. Nilsson, M. Bengtsson, T. Laurell and G. Marko-Varga, Anal. Chem., 2000, 72, 286–293 CrossRef CAS.
- S. Ekstrom, D. Ericsson, P. Onnerfjord, M. Bengtsson, J. Nilsson, G. Marko-Varga and T. Laurell, Anal. Chem., 2001, 73, 214–219 CrossRef CAS.
- M. Schuerenberg, C. Luebbert, H. Eickhoff, M. Kalkum, H. Lehrach and E. Nordhoff, Anal. Chem., 2000, 72, 3436–3442 CrossRef CAS.
- R. Zenobi and R. Knochenmuss, Mass Spectrom. Rev., 1998, 17, 337–366 CrossRef CAS.
- D. P. Fergenson, M. E. Pitesky, H. J. Tobias, P. T. Steele, G. A. Czerwieniec, S. C. Russell, C. B. Lebrilla, J. M. Horn, K. R. Coffee, A. Srivastava, S. P. Pillai, M. T. P. Shih, H. L. Hall, A. J. Ramponi, J. T. Chang, R. G. Langlois, P. L. Estacio, R. T. Hadley, M. Frank and E. E. Gard, Anal. Chem., 2004, 76, 373–378 CrossRef CAS .★Reagentless technique for the detection of airborne Bacillus spores. Mass spectral signature is used to distinguish between Bacillus species.
Footnote |
| † © Contents include material subject to Crown Copyright 2004 Dstl. |
| This journal is © The Royal Society of Chemistry 2005 |