Research Highlights
First published on 27th November 2006
Gene expression in single yeast cells
Living organisms are subject to ageing sooner or later. For many organisms it has been shown that the ageing process is correlated with the expression pattern of numerous genes. These previous studies have typically focussed on tissues or large cell populations, hence the results reflect the average gene expression pattern of lots of cells. However, there is evidence that gene expression varies for individual cells derived from the same cloned population. Furthermore, gene expression can alter within one cell over time.James Ryley and Olivia M. Pereira-Smith from the University of Texas Health Science Center at San Antonio (USA) have measured the expression of fluorescently-tagged genes in yeast cells that are known to affect yeast life span.1 In order to determine the variability of the gene expression within individual cells, and within time, they developed a miniaturized flow cell which physically traps individual cells in µm-sized structures (Fig. 1, left). The device (PDMS, casted from a silicon master) consists of several trap arrays. Among different tested trap designs, the trap with three square posts (Fig. 1, right) turned out to be most efficient in loading and egress of daughter cells, which is necessary to ensure reliable fluorescence reading in each trap. The expression of two genes is determined, one of which is induced by a heat shock. Since the expressed proteins are tagged to the green fluorescent protein and the yellow fluorescent protein, respectively, the gene expression is directly linked to the fluorescence intensity of the cell, and thus, it could be simply determined in a standard fluorescence miscroscope. The expression levels of the two observed proteins are found to vary substantially from cell to cell. This heterogeneity remains to be correlated with life span, but occurs at levels that could have biological consequences. The authors anticipate that the simultaneous expression analysis of many genes becomes feasible with the microdevice. A library of yeast, in which GFP has been fused to thousands of different genes is available, and may allow the discovery of new correlations between gene expression and phenotype that have been impossible to investigate so far with classical techniques.
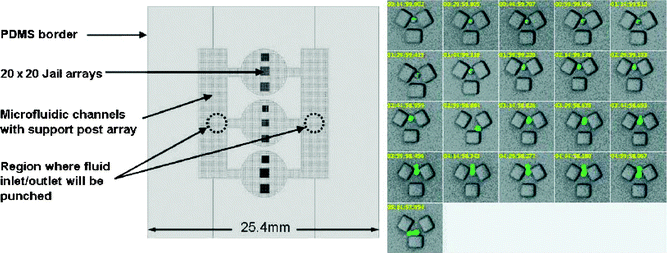 | ||
| Fig. 1 Left: Sketch of the device for single yeast cell analysis. Several arrays of physical traps (’jails’) are fabricated. Right: The series of images (each frame is taken 15 min apart) show a yeast cell that is captured between the three square posts. After a heat shock, expression of a specific gene (HSP104-GFP) is observed, which is visualized by tagging the protein of interest with the green fluorescence protein. This particular yeast cell grew a bud after heat shock had ceased. (Reproduced from ref. 1. Copyright 2006 John Wiley & Sons Limited. Reproduced with permission.) | ||
Electronic tongue using surface acoustic waves
Human sensory tests are frequently performed in the food and beverage industries to evaluate taste. The result, however, relies on the individual flavour and subjective judgement of each person. An electronic sensor would give a more objective and thus trustworthy determination of the taste. Leonte et al. present the use of small shear horizontal surface acoustic wave (SH-SAW) sensors for determination of different tastants.2 Such SH-SAW sensors are typically employed to detect gaseous species, and are adopted in this work for liquid sensing. The sensing principle of the devices is based on the shear horizontal acoustic wave–liquid interaction that results in perturbations of the propagation characteristics of the wave. These perturbations are translated to the electrical domain and can be monitored via signal attenuation, phase or frequency shifts. Thus, the determination of the taste samples depends on physical interaction mechanisms rather than chemical ones. Two types of SH-SAW devices are tested, a dual delay time configuration and a dual-port resonator configuration. Various liquid samples representing the four basic tastes of saltiness (sodium chloride), sweetness (sucrose), sourness (acetic acid) and bitterness (quinine sulfate), as well as the fifth taste called umami (glutamic acid) and metallic taste (iron sulfate) can be differentiated (Fig. 2). Although the devices are unlikely to be able to detect traces of tastants within a complex mixture without the implementation of any analyte-specific coating, the authors believe that SH-SAW sensors could be a low-cost screening device of certain bioliquids for commercial applications.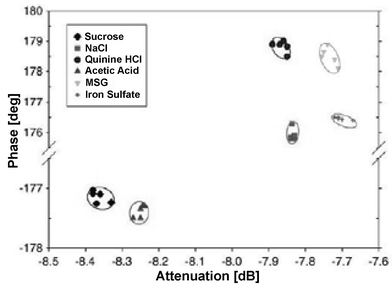 | ||
| Fig. 2 Detection of different tastants in a surface acoustic wave microsensor. The taste samples represent not only the four basic tastes of saltiness, sweetness, sourness, and bitterness, but also the fifth taste called umami, and metallic taste. (Reproduced from ref. 2. Copyright 2006, with permission from Elsevier.) | ||
Quasi-3D plasmonic crystals for label-free biosensing and 1D imaging
Surface plasmon resonance (SPR) spectroscopy is a popular technique to study intermolecular binding reactions at surfaces by monitoring the change of refractive index near a metal surface. Since the optical setup for SPR is difficult to integrate in low-cost, portable microdevices, alternatives have been developed for SPR-type sensing in a microdevice. In a recent work, John A. Rogers and co-workers present a class of quasi-3D plasmonic crystal that consists of multilayered, regular arrays of subwavelength metal nanostructures, and enable full multiwavelength spectroscopic detection of molecular binding events with high sensitivities and without the need of fluorescent labels.3The quasi-3D plasmonic crystals formed by a soft nanoimprint technique consist of large arrays of cylindrical wells fabricated in films of a photocurable polyurethane (Fig. 3). Gold films with a thickness of ∼50 nm are deposited onto the raised and recessed regions. In this way the plasmonic crystal is created that consists of arrays of nanoscale holes in gold films with a second, physically separate level of isolated gold disks at the bottom of the embossed wells. Theoretical modelling quantitatively accounts for the observed unique optical properties of these architectures and illustrates the complex electromagnetic field distribution around the multilevel nanostructured features in these systems. Calibration measurements are performed by passing solutions of increasing concentration of polyethylene glycol (changing refractive index) through a fluid flow cell containing a plasmonic crystal, and the changes in transmission for several wavelengths are recorded. It is found that the calculation of the integrated multispectral response improves the signal-to-noise ratio by a factor of 3–10 times compared to the signal-to-noise ratio observed at the most sensitive single wavelength. The functionality of the device in a quantitative bioassay is shown for the conjugation of biotin–avidin, which is a well-studied ligand–receptor system. The surface is subsequently exposed to biotinylated bovine serum albumin (BSA), avidin, and again biotinylated BSA, with alternating washing steps, to form a biotin–avidin–biotin conjugate. The binding events result in an increase of the integrated multispectral response of the plasmonic crystal, corresponding to an effective protein conjugate thickness of about 8 nm. The noise of the integrated response determines the resolution of the system, which is 0.02 nm. In a second example, the authors demonstrate the capability of the microdevice for analytical imaging of large area multiplexed bioassays (Fig. 4). A plasmonic crystal is patterned with five lines of non-specifically adsorbed fibrinogen utilising a microfluidic device with five microchannels (Fig. 4). The spectral image shows five stripes with expected geometries, each corresponding to a region of the crystal patterned with fibrinogen. The lateral resolution is about 20 µm, which is comparable to current flat film SPR imaging systems.
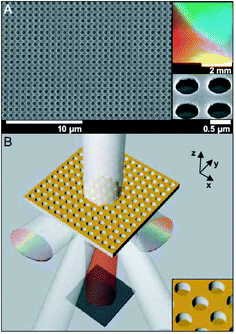 | ||
| Fig. 3 Quantitative multispectral biosensing using quasi-3D plasmonic crystals. (A) A scanning electron micrograph of a crystal that consists of arrays of nanoscale holes fabricated in a photocurable polyurethane and coated with gold. (B) Schematic illustration of the functioning of the device. The intensity of the undiffracted transmitted light is monitored across the UV, visible, and near-infrared regions of the spectrum. (Reproduced from ref. 3. Copyright 2006 National Academy of Sciences, USA.). | ||
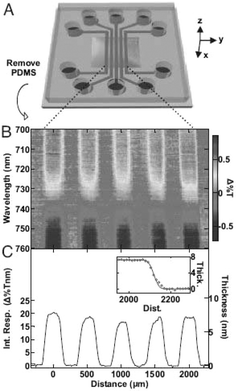 | ||
| Fig. 4 Label-free imaging of fibrinogen that is absorbed onto the surface of a plasmonic crystal. (A) The pattern of fibrinogen is formed using a microfluidic device with five parallel channels. (B) Spectroscopic difference image and (C) integrated response and corresponding thickness illustrating binding events in the geometry of the microfluidic channels. (Reproduced from ref. 3. Copyright 2006 National Academy of Sciences, USA.) | ||
Bubbles form a tunable diffraction grating
Optical components are typically fabricated from rigid materials such as glass, quarz, polymers or metals. Specific applications, however, may require tunable optics that can be constructed utilising liquid materials. The dynamic control over optical properties in such adaptive optical components is provided by the adjustment of the geometry of the active components, and the property of the materials such as refractive index or absorbance. In a recent work, Hashimoto et al. describe the generation and use of a dynamic fluid–gas diffraction grating.4 Gas bubbles are formed in a microfluidic device to create a flowing, regular lattice. A sketch of the device is shown in Fig. 5. When the gas and the liquid phases meet at a junction, gaseous droplets of homogeneous size are formed. The channel widens after the junction so that the monodisperse bubbles are packed into a quasi-two-dimensional sheet. The size of the droplets (varied from 12 to 51 µm) is controlled by the pressure of the gas and the flow rate of the liquids. A critical issue is the uniformity and stability of the droplets. To create an optimal and defect-free diffraction grating, the formation of a dense organisation of the bubbles should be perfectly reproducible in the channel. A stable, hexagonal packing of bubbles with minimum defects is achieved for large volume fractions of the bubbles, i.e. when the bubbles fill the entire plane of the channel with the liquid confined to the curved spaces between the bubbles. Bubbles with smaller diameter (of 12 µm) are packed more reliably in narrow channels that are fabricated in parallel to form a large lattice. The authors present the diffraction pattern of visible light and furthermore, the real-time switching of the diffraction grating is demonstrated by changing the pressure of the gas every 15 s. The tunable, two-dimensional diffraction grating contributes to the series of microfluid-based optical components developed earlier such as lenses, waveguides and light sources, and may be used to form fully fluidic based optical systems.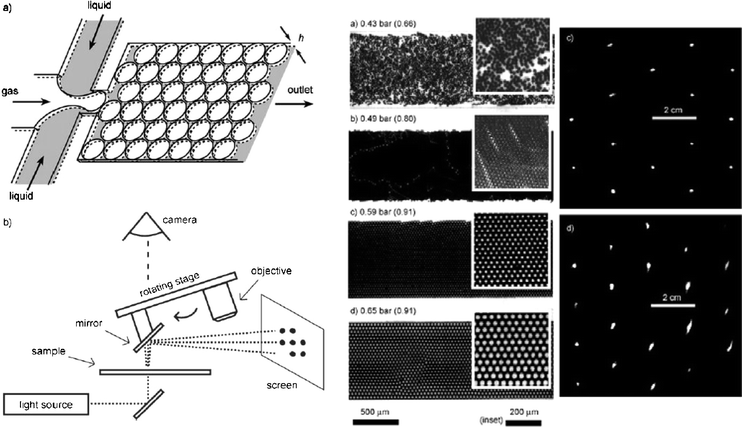 | ||
| Fig. 5 Diffraction grating formed by a flowing lattice of bubbles. Left: Scheme of the microfluidic device to generate gaseous bubbles. An incident laser beam is diffracted and produces a specific pattern on the screen. Right: Images of packed bubbles in a 1 mm wide and 16 µm high channel for different gas pressure, and resulting diffraction patterns for images (c) and (d) (Adapted with permission from ref. 4. Copyright 2006, Wiley-VCH.). | ||
Petra S. Dittrich
ISAS, Dortmund, Germany
dittrich@ansci.de
References
- J. Ryley and O. M. Pereira-Smith, Microfluidics device for single cell gene expression analysis in Saccharomyces cerevisiae, Yeast, 2006, 23, 1065–1073 CrossRef.
- I. I. Leonte, G. Sehra, M. Cole, P. Hesketh and J. W. Gardner, Taste sensors utilizing high-frequency SH-SAW devices, Sens. Actuators, B, 2006, 118, 349–355 CrossRef.
- M. E. Stewart, N. H. Mack, V. Malyarchuk, J. A. N. T. Soares, T.-W. Lee, S. K. Gray, R. G. Nuzzo and J. A. Rogers, Quantitative multispectral biosensing and 1D imaging using quasi-3D plasmonic crystals, Proc. Natl. Acad. Sci. U. S. A., 2006, 103, 17143–17148 CrossRef.
- M. Hashimoto, B. Mayers, P. Garstecki and G. M. Whitesides, Flowing Lattices of Bubbles as Tunable, Self-Assembled Diffraction Gratings, Small, 2006, 2, 1292–1298 CrossRef.
| This journal is © The Royal Society of Chemistry 2007 |
