Ag nanowires enhanced upconversion emission of NaYF4:Yb,Er nanocrystalsvia a direct assembly method†
Wei
Feng
,
Ling-Dong
Sun
* and
Chun-Hua
Yan
*
Beijing National Laboratory for Molecular Science, State Key Laboratory of Rare Earth Materials Chemistry and Applications, PKU-HKU Joint Lab on Rare Earth Materials and Bioinorganic Chemistry, Peking University, Beijing, 100871, China. E-mail: yan@pku.edu.cn; sun@pku.edu.cn; Fax: +86 10 6275 4179; Tel: +86 10 6275 4179
First published on 11th June 2009
Abstract
Enhanced upconversion emission of NaYF4:Yb,Er nanocrystals with Ag nanowires was observed; the enhancement factor of red emission is larger than that of green emission, and it can be further increased with Ag islands composed of larger Ag particles.
Rare-earth doped upconversion (UC) emission materials can convert infrared radiation into visible light via a multi-photon absorption process, which leads to potential applications in lasers, infrared quantum counters, next-generation lighting, and three-dimensional displays.1 Recently, several methods have been developed to obtain nanosized UC materials,2–6 which provide a new type of alternatives for biolabels.7–10 Compared to the well-developed tags such as organic dyes and quantum dots, the application of UC nanomaterials will lead to less photodamage to living organisms, weak background fluorescence, and deep detection range. Unfortunately, these UC nanomaterials usually have low emission efficiency because of their structure defects and large surface area with a variety of quenchers. Meanwhile, the small absorption cross-section of excitation light also limits the efficiency. Therefore, how to enhance the UC emission is one of the most important issues towards the application of these nanomaterials.
Since its discovery in 1969,11 surface enhanced fluorescence of emitters on rough noble metal surfaces has been widely investigated and used in bioassay systems.12–14 Commonly, Ag and Au are chosen as noble metals with respect to their well studied surface plasmonic resonance behavior15 and interaction with organic dyes.16 The mechanism of the enhancement is investigated and postulated in terms of two prominent aspects related to the noble metals. One is the increase of the incident electromagnetic field which arises from the coupling with the surface plasmon of noble metals. The other is the increase of the radiative decay rate of luminophores due to the resonance of the emission with the surface plasmon of noble metals, and this also leads an improvement of quantum efficiency.12 Recently, rare earth complexes,17quantum dots,18,19 and other inorganic luminescent materials20 have been investigated for the luminescence enhancement by Ag or Au. However, there is no report on the surface enhanced luminescence of UC nanomaterials by noble metals.
In this paper, we present the assembly of Ag nanowires and NaYF4:Yb,Er nanocrystals on substrates to obtain a surface enhanced upconversion emission configuration of NaYF4:Yb,Er nanocrystals with the interaction of Ag nanowires; Ag and Au nanoparticles and Ag islands were also investigated for comparison.
NaYF4:Yb,Er nanocrystals were synthesized from the thermal decomposition of rare-earth/sodium fluorides in a high boiling point solvent composed of oleic acid, oleylamine and 1-octadecene as reported.2 Hexagonal phase β-NaYF4:Yb,Er nanocrystals with relatively small size (ca. 30 nm) and high luminescence intensity were selected for further studies. The particle size and uniformity were confirmed by a TEM image (Fig. 1(a)). The UC emission spectrum (excited at 980 nm) of these nanocrystals in hexane solution (Fig. 1(b)) shows green and red emissions located around 522, 543 and 659 nm, which arises from the 4f configuration transitions of Er3+ from 2H11/2, 4S3/2 and 4F9/2 to the ground state 4I15/2, respectively. Ag nanowires were synthesized by the polyol method developed by Xia et al.21 8 nm Ag and 10 nm Au nanoparticles are also prepared for reference studies, and the synthesis protocol is similar to the report22 with the reduction of AgNO3 or HAuCl4 in oleylamie and 1-octadecene, respectively (see ESI†). TEM images and extinction spectra of these nanocrystals were taken to check the size and surface plasmon band (Fig. 2), which are consistent with the reports.21,22 Compared with Ag nanoparticles, a broad extinction band was observed for Ag nanowires, and the inhomogeneous aspect ratios, which is the key point to determine the position and width of the surface plasmon band, should be responsible for this.
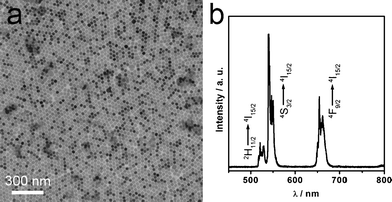 | ||
| Fig. 1 TEM image (a) and UC emission spectrum (b) of 30 nm NaYF4:Yb,Er nanocrystals. | ||
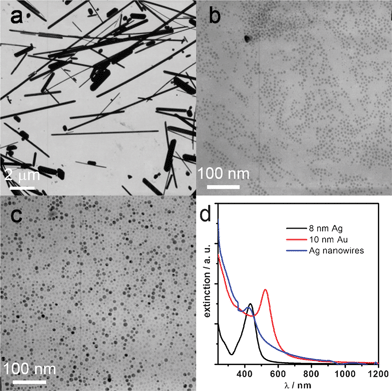 | ||
| Fig. 2 TEM images of Ag nanowires (a), 8 nm Ag nanocrystals (b), 10 nm Au nanocrystals (c), and their extinction spectra (d). | ||
We used a solvent evaporation method to assemble NaYF4:Yb,Er nanocrystals and Ag nanowires layer-by-layer. A drop of NaYF4:Yb,Er hexane colloid solution was deposited on a silicon substrate to cover the whole plate by a capillary tube to form a dense layer of NaYF4:Yb,Er nanocrystals. After drying it in under ambient condition to fully evaporate hexane, a drop of Ag nanowire solution was deposited to cover part of the NaYF4:Yb,Er nanocrystal layer. Similarly, Ag or Au nanocrystals can be positioned at various points of the same silicon plate to form a composite assembly, which makes it easier for comparing among different areas when considering the influence of various metal nanocrystals.
The UC spectra (obtained with a modified Raman spectrometer, see ESI†) at different areas with the same acquisition parameters indicate the luminescence enhancement with Ag nanowires (Fig. 3). Intensities of both green emission located at ca. 550 nm and red emission at ca. 650 nm are increased obviously compared to the reference of the pure NaYF4:Yb,Er nanocrystals assembly. The enhancement factor is calculated to be ca. 2.3 and 3.7 for green and red emission, respectively, according to the ratio of the integrated intensity.
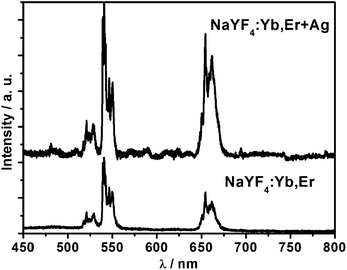 | ||
| Fig. 3 UC spectra of NaYF4:Yb,Er nanocrystals and Ag–NaYF4:Yb,Er composites on silicon substrate with the excitation of a 980 nm diode laser. | ||
In order to exclude the luminescence enhancement induced by the aggregation of nanocrystals, spectral mapping mode was performed with the advantage of spectral detection in a large area. The green emission between 535 and 555 nm is selected as the detection region, and the spectral mapping profile (see ESI,† Fig. S1) indicates a homogenous UC emission from the pure NaYF4:Yb,Er nanocrystal assembly.
This spectral mapping mode was also used to investigate the site dependent UC emission of the metal–NaYF4:Yb,Er composite. For an area of 100 × 70 μm, the optical microscope image clearly shows the position of Ag nanowires (Fig. 4(a)). The corresponding mapping profile of green emission (Fig. 4(b)) shows obvious enhancement which is consistent well with the location of Ag nanowires. Two typical sites, near (A) and far (B) from the Ag nanowires, Fig. 4(a) and (b) were endowed with a similar spectral characteristic in width and wavelength but different intensity (Fig. 4(c) and (d)). An increased green emission is prominent in site A. The similar spectral mapping image corresponding to the red emission at 645–675 nm (ESI,† Fig. S2) shows the same tendency, and the luminescence enhancement is also well-correlated with the position of Ag nanowires. The above results clearly show the UC enhancement both in green and red, and it is reasonable to ascribe the enhancement to the interactions between NaYF4:Yb,Er nanocrystals and Ag nanowires. It should also be noted that the UC emissions are extremely intense at the areas rich of Ag nanowires where is proved to have a stronger local electric field.15
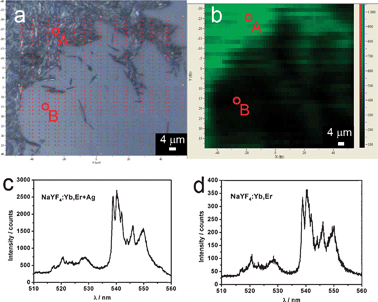 | ||
| Fig. 4 Optical microscopy image (a), corresponding mapping profile from green emission (b), and the corresponding emission spectra at points A (with Ag nanowires, c) and B (without Ag nanowires, d). | ||
This metal surface enhanced luminescence can be directly observed by a fluorescence microscope (ESI†). A similar Ag–NaYF4:Yb,Er layered assembly is formed on a transparent glass plate instead of a silicon wafer here so as to obtain optical and luminescent images. Under the excitation of 980 nm (ESI,† Fig. S3b), the area with a relatively strong green emission has a wirelike contour, which corresponds well with the location and shape of Ag nanowires observed in the optical image (ESI,† Fig. S3a). This directly confirms that Ag nanowires enhanced the UC emission of NaYF4:Yb,Er nanocrystals.
Scanning electron microscope (SEM) images are used to characterize the assembly structure and spatial relationship between NaYF4:Yb,Er nanocrystals and Ag nanowires. 30 nm NaYF4:Yb,Er nanocrystals form a homogenously dense layer on the substrate without Ag nanowires (Fig. 5(a)). With the addition of Ag nanowires, the NaYF4:Yb,Er nanocrystals remain as a dense contact layer surrounded by Ag nanowires (Fig. 5(b)) without clumps. As the luminescence enhancement is proved to be sensitive to the distance between emitters and the metal surface,18,23 the enhancement here should arise from an average effect with various distances between the NaYF4:Yb,Er nanocrystals and Ag nanowires.
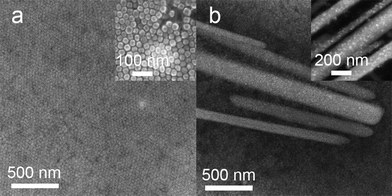 | ||
| Fig. 5 SEM images of NaYF4:Yb,Er assembly (a), Ag–NaYF4:Yb,Er–nanowires composite assembly (b), and the corresponding high magnification images (insets of a and b). | ||
Investigations on metal surface enhanced luminescence of nanocrystals indicate that it is correlated with the spectra overlap between the absorption or emission band of the luminophores and the surface plasmon band of metals.19 In our research, the absorption peaks of Ag nanowires, 8 nm Ag nanoparticles, and 10 nm Au nanoparticles are located at 420, 433 and 522 nm, respectively (Fig. 2d). These values are different from the absorption or the green or red emissions of NaYF4:Yb,Er nanocrystals. 8 nm Ag and 10 nm Au nanoparticles do not show an obvious enhancement effect here (†ESI, Fig. S4 and S5), and this is quite different from the case of sub-micron Ag nanowires described above. Thus there should be other reasons besides spectra overlap in consideration of the UC emission enhancement phenomena.
Lakowicz et al. also reported that larger metal particles induced stronger enhancement due to their larger scattering efficiency.24 Based on the extremely strong UC emission of NaYF4:Yb,Er nanocrystals near Ag islands (commercial Ag gel, ESI,† Fig. S6) with enhancement factors of 8.8 and 26 for green and red emissions, respectively, it is also reasonable to ascribe an effective luminescence enhancement from sub-micron Ag nanowires and islands to the size induced different scattering efficiency.
In summary, we report here the enhanced UC emission from NaYF4:Yb,Er nanocrystals with Ag nanowires. The detailed structure of the assembly was investigated to confirm the location relationship between Ag and NaYF4:Yb,Er nanocrystals, and enhancement due to nanocrystal aggregation could be eliminated. Various noble metal nanocrystals (Ag and Au) with different size and absorption were also investigated to study the influence of spectra overlap. Only Ag nanowires and islands with bigger size exhibit obvious enhancement. These phenomena proved that the UC emission can be enhanced by noble metals such as Ag, which promise potential application of metal–NaYF4:Yb,Er composites in bioassays. The mechanism responsible for the UC emission enhancement, especially the enhanced red emission from the Ag–NaYF4:Yb,Er composite is still under study.
This work was supported by NSFC (20671005, 20821091 and 20731160001) and MOST of China (2006CB601104).
Notes and references
- F. Auzel, Chem. Rev., 2004, 104, 139 CrossRef CAS.
- H. X. Mai, Y. W. Zhang, R. Si, Z. G. Yan, L. D. Sun, L. P. You and C. H. Yan, J. Am. Chem. Soc., 2006, 128, 6426 CrossRef CAS.
- J. C. Boyer, F. Vetrone, L. A. Cuccia and J. A. Capobianco, J. Am. Chem. Soc., 2006, 128, 7444 CrossRef CAS.
- G. S. Yi and G. M. Chow, Adv. Funct. Mater., 2006, 16, 2324 CrossRef CAS.
- Y. Wei, F. Q. Lu, X. R. Zhang and D. P. Chen, Chem. Mater., 2006, 18, 5733 CrossRef CAS.
- L. Y. Wang and Y. D. Li, Chem. Mater., 2007, 19, 727 CrossRef CAS.
- G. S. Yi, H. C. Lu, S. Y. Zhao, G. Yue, W. J. Yang, D. P. Chen and L. H. Guo, Nano Lett., 2004, 4, 2191 CrossRef CAS.
- R. A. Jalil and Y. Zhang, Biomaterials, 2008, 29, 4122 CrossRef.
- Z. Q. Li, Y. Zhang and S. Jiang, Adv. Mater., 2008, 20, 4765 CrossRef CAS.
- Z. G. Chen, H. L. Chen, H. Hu, M. X. Yu, F. Y. Li, Q. Zhang, Z. G. Zhou, T. Yi and C. H. Huang, J. Am. Chem. Soc., 2008, 130, 3023 CrossRef CAS.
- K. H. Drexhage, B. Am. Phys. Soc., 1969, 14, 873 Search PubMed.
- C. D. Geddes and J. R. Lakowicz, J. Fluoresc., 2002, 12, 121 CrossRef.
- K. A. Willets and R. P. Van Duyne, Annu. Rev. Phys. Chem., 2007, 58, 267 CrossRef CAS.
- K. Aslan, M. Wu, J. R. Lakowicz and C. D. Geddes, J. Fluoresc., 2007, 17, 127 CrossRef CAS.
- J. Zhao, A. O. Pinchuk, J. M. Mcmahon, S. Z. Li, L. K. Alisman, A. L. Atkinson and G. C. Schatz, Acc. Chem. Res., 2008, 41, 1710 CrossRef CAS.
- F. Xie, M. S. Baker and E. M. Goldys, Chem. Mater., 2008, 20, 1788 CrossRef CAS.
- Y. H. Wang, X. R. Zhou, T. Wang and J. Zhou, Mater. Lett., 2008, 62, 3582 CrossRef.
- O. Kulakovich, N. Strekal, A. Yaroshevich, S. Maskevich, S. Gaponenko, I. Nabiev, U. Woggon and M. Artemyev, Nano Lett., 2002, 2, 1449 CrossRef CAS.
- Y. Chen, K. Munechika, I. J. L. Plante, A. M. Munro, S. E. Skrabalak, Y. Xia and D. S. Ginger, Appl. Phys. Lett., 2008, 93.
- H. Mertens and A. Polman, Appl. Phys. Lett., 2006, 89.
- Y. G. Sun, B. Gates, B. Mayers and Y. N. Xia, Nano Lett., 2002, 2, 165 CrossRef CAS.
- C. M. Shen, C. Hui, T. Z. Yang, C. W. Xiao, J. F. Tian, L. H. Bao, S. T. Chen, H. Ding and H. J. Gao, Chem. Mater., 2008, 20, 6939 CrossRef CAS.
- A. Wokaun, H. P. Lutz, A. P. King, U. P. Wild and R. R. Ernst, J. Chem. Phys., 1983, 79, 509 CrossRef CAS.
- J. R. Lakowicz, Anal. Biochem., 2005, 337, 171 CrossRef CAS.
Footnote |
| † Electronic supplementary information (ESI) available: Experimental and instrumental details, further SEM images, and other upconversion spectra mapping profiles. See DOI: 10.1039/b909164e |
| This journal is © The Royal Society of Chemistry 2009 |
