A self-assembling self-repairing microbial photoelectrochemical solar cell
Sumit
Malik
a,
Emily
Drott
b,
Philip
Grisdela
a,
Joy
Lee
a,
Clarice
Lee
a,
Daniel A.
Lowy
c,
Samuel
Gray
d and
Leonard M.
Tender
*d
aThomas Jefferson High School for Science and Technology, Alexandria, VA 22312, USA
bPurdue University, West Lafayette, IN 47907, USA
cNova Research, Inc., Alexandria, VA 22308, USA
dCenter for Bio/Molecular Science and Engineering, Naval Research Laboratory, Washington, DC 20375, USA. E-mail: Tender@nrl.navy.mil
First published on 6th January 2009
Abstract
Biologically-based approaches to large-scale solar power generation promise low cost durable technologies that will exhibit the self-repairing capabilities of photosynthetic organisms1–3 (Basic Research Needs for Solar Energy Utilization, U.S. Department of Energy, Washington DC, 2005; J. Barber and B. Andersson, Trends Biochem. Sci., 1992, 17, 61; A. Huijser et al., J. Phys. Chem. C, 2007, 111, 11726). Most proposed approaches however utilize photosynthetic proteins extracted from organisms4–6 (S. A. Trammell et al., J. Phys. Chem. C, 2007, 111, 17122; R. Das et al., Nano Lett., 2004, 4, 1079; E. Greenbaum, Science, 1985, 230, 1375) and forgo the self-repair capabilities of organisms resulting in short-lived power generation. Beginning with two non-descript graphite electrodes and marine sediment and seawater, we report here a proof-of-concept demonstration of a self-assembling and self-repairing microbial photoelectrochemical solar cell that generates electricity from sunlight7 (S. A. Licht, Nature, 1987, 330, 148). Time records of voltage and current generated by this solar cell reveal a circadian rhythm consistent with a photosynthetic nature. This result supports the interpretation that the electrode reactions are catalyzed by self-maintaining biofilms spontaneously formed on each electrode surface, and that the electrode reactants are photosynthetically regenerated from the electrode products by a self-maintaining spontaneously formed photosynthetic consortium. Our finding suggests a strait-forward approach toward durable biologically-based solar power generation.
Broader contextBiologically-based approaches to large-scale solar power generation promise low cost durable technologies that will exhibit the self-repairing capabilities of photosynthetic organisms. Most proposed approaches however utilize photosynthetic proteins extracted from organisms and forgo the self-repair capabilities of organisms resulting in short-lived power generation. Described here is proof of a concept in which the reactants of a microbial fuel cell (glucose and oxygen) are internally regenerated by a photosynthetic microbial consortium whose reactants (carbon dioxide and water) are the products of the microbial fuel cell. This interdependency results in long-term electricity generation from sunlight (many thousands of hours of operation to date without diminished power output) without replenishment of the microbial fuel cell reactants. Furthermore, in this specific proof of concept, the ability of different microbes within a mixture to proliferate within different environmental niches is highlighted as a strategy to self-assemble such devices. While the solar power to electrical power conversion efficiency is extremely low in its present form, ample opportunities exist to increase its efficiency and to accumulate glucose and oxygen generated during the day enabling power generation at night. |
Introduction
The high initial cost and limited operational lifetime of silicon based photovoltaic devices are key obstacles to wider utilization of large-scale solar power generation.1,8 Natural photosynthetic systems self-repair; a property that makes them highly durable (e.g., trees and algae blooms), but which has not yet been achieved outside live organisms. Here we test the hypothesis that incorporating photosynthetic organisms with the recently demonstrated self-assembling and self-maintaining benthic microbial fuel cell (BMFC)9–14 will enable durable land-based photoelectrochemical solar cells by using sunlight to regenerate the electrode reactants from the electrode products. The BMFC (schematically depicted in Fig. 1 ignoring box labeled “5”) generates electrical power in marine environments for persistent operation of low-power consuming oceanographic sensors.14 It is comprised of a non-corrosive anode (e.g., graphite) embedded in anoxic marine sediment connected by an external circuit to a non-corrosive cathode (e.g., graphite), positioned in overlying oxygenated water. A spontaneously formed biofilm on the anode surface (1) catalyzes oxidation of acetate in sediment porewater, generating carbon dioxide and protons.15,16 Acquired electrons flow through the external electrical circuit to the cathode, where a second spontaneously formed biofilm (2) catalyses reduction of oxygen and its reaction with protons to form water.17–19 Fermentative microbes in the sediment (3) generate acetate from sedimentary glucose, which is typically derived from settlement of phytoplankton or vegetative detritus form overlying water. Aerobic microorganisms at the benthic interface (4) preferentially deplete oxygen entering sediment from overlying water; isolating the electrode reactants while allowing proton transport thereby enabling electron flow through the external circuit. The net BMFC reaction, the oxidation of glucose with oxygen, is thermodynamically favorable, and this manifests as voltage and current across the external circuit, which depends upon location, meteorological conditions, size of the BMFC, and resistance of the external circuit.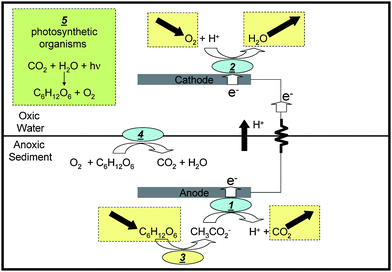 | ||
| Fig. 1 Schematic depiction of simplified mechanism of power generation by the BMFC (without box labeled “5” corresponding to photosynthesis) and for the microbial photoelectrochemical solar cell reported here (with box labeled “5”). 1: biofilm catalyzed anode reaction; 2: biofilm catalyzed cathode reaction; 3: fermentative reaction, 4: microbial oxygen barrier. | ||
A key feature of the BMFC is longevity, which is attributed to the constant replenishment of glucose and oxygen by environmental processes,13 and to the continuous rejuvenation of the electrode microbial catalysts,19 their ability to exchange electrons with electrodes without externally added exogenous electron-transfer mediators,20 and, in the case of the anode, their complete oxidation of acetate so not to accumulate deleterious by-products.21 Because of its longevity (numerous prototypes having been operated in the field for more than 2 years without exhibiting depletion in power),14 BMFCs are being developed for powering marine deployed scientific instruments far longer than possible with batteries.14
Here, by removing the BMFC form the seafloor, configuring it in a sealed transparent container, and placing it in direct sunlight, we show that photosynthetic organisms (e.g., cyanobacteria),presumably present initially at relatively low abundance, proliferate in the overlying water. These organisms appear to catalyze regeneration of the anode products (Fig. 1, box labeled “5”), thereby closing the carbon/nutrient cycle and enabling persistent solar-power generation without requiring additional biomass or oxygen.
Methods
Cells (still operational at time of publication) were configured from ca. 4 L volume (10 cm height, 22 cm maximum length × 22 cm maximum width) sealable transparent polycarbonate food storage containers (Premier 4-cup, Rubbermaid) filled with marine sediment to a height of ca. 2.5 cm from the container bottom. The sediment was overlaid with seawater to a total height of ca. 9 cm from the container bottom leaving a ca. 1 cm head space.10 Each cell contains a 10.2 cm-long × 10.2 cm-wide × 0.32 cm-thick graphite plate anode (sanded and rinsed with distilled water, grade GS-10, Graphite Engineering, Inc.)11,13 embedded in the sediment at the height of 1.3 cm from the container bottom. The anode is aligned parallel with the sediment surface and centered with respect to the container footprint. Each cell also contains a graphite plate cathode that is identical to the anode with the exception of five evenly-spaced 1.3 cm diameter holes. The cathode is positioned parallel to the anode at a height of ca. 8 cm in the overlying seawater and centered with respect to container footprint. Sealed electrical connections to each electrode were fashioned as previously described.11,13 Insulated electrical leads were passed through snug fitting holes in the lid that were sealed with epoxy. Four types of microbial photoelectrochemical solar cells are reported here. Cells 1 and 2 contain sediment and seawater collected from a shallow boat basin carved into a salt marsh at the Rutgers University Marine Field Station, near Tuckerton, NJ, USA).10,11 This site is characterized by silty sediment and a shallow 1 m average depth. These cells were sealed with lids to exclude external oxygen, and prohibit evaporation. Cell 3 is identical to cells 1 and 2, except that it contains sandy-silt sediment, collected from a depth of 15 m in Monterey Bay, CA, USA. The seawater used in cell 3 was collected from the water surface at the same site. Cell 4 is identical to cells 1 and 2, except that it is open to the environment (no lid), and distilled water was added periodically to compensate evaporation.10 In June 2008, the cells were positioned in a row on the interior windowsill of a south facing window in the office of the corresponding author in Washington, DC, USA, where they remain operating at this time. Each cell contains a thermalcouple, positioned in the overlying water (sealed type T, Omega Engineering), and passed through a snug fitting hole in its lid (no lid in the case of cell 3) that was sealed with epoxy. An 8-channel thermalcouple data acquisition module (TC-08, Omega Engineering) connected to a laptop computer, operating with provided software (Omega Engineering), continuously records temperature (0.1 °C resolution) in each cell every 250 s. A datalogging light meter (Model 850008, Sper Scientific LTD), positioned among the cells and connected to a laptop computer operating a custom software application (Labview, National Instruments), continuously records sunlight intensity (tungsten setting, 1 lx resolution) every 250 s. A ten point boxcar average was used in depiction of sunlight intensity time records shown in figures to reduce scatter in plots due to passing cloud cover. At night, a background light intensity of ca. 2 lx results from stray artificial light. An 8-channel potentiostat (Model 1470E, Solartron Analytical), connected to a laptop computer operating commercial software (Multistat, Scribner Assoc.), simultaneously records every 250 s the open circuit voltage (voltage difference between the cathode and anode when no current is flowing) of each cell or current during discharge when the cell voltage (voltage difference between cathode and anode) is fixed at a set value. Both measurements are performed in the 2-electrode configuration, with the anode operating as the working electrode, and the cathode serving as the counter and reference electrodes combined). This configuration results in negative voltages that are corrected for in the figures. It is important to note that during cell discharge, the potentiostat acts as a passive load and not an active power generating external circuit, as long as voltage and current as depicted have the same sign. After ca. 1 month of experimentation, cell 1 was retrofitted with a Ag/AgCl, 3 M KCl reference electrode (Bioanalytical Systems) inserted through a snug fitting hole in the lid that was sealed with epoxy. The tip of the reference electrode is positioned in the overlying seawater, and the glass shaft wrapped with duct tape to exclude sunlight owing to concerns of its possible light sensitivity. In the case of cell 1, three channels of the potentiostat are used to simultaneously record the anode and cathode potentials vs. the Ag/AgCl reference electrode, as well as the cell open circuit voltage. Assuming a 3.0 L volume of overlying seawater initially saturated in oxygen (8.2 mg L−1 at 25 °C and sea level),22 the time required to consume all oxygen originally present in a cell generating an average of 0.3 mA of continuous current is: (2.9 L) × (8.2 mg O2/L) × (1 mole O2/32 g) × (4 mole e−/mole O2) × (96487 C/1 mole e−)/[(0.3 mA) × (3600 s)/h)] = 266 h. Assuming a 1 L volume of wet sediment with ca. 6% organic matter content by dry weight,10 the time required to consume all the initial glucose, present in the cells containing sediment from Tuckerton, NJ, USA (assuming all organic matter in cell is labile), while generating an average of 0.3 mA continuous current is: (1.0 L) × (1.5 kg wet sediment/L) × (0.15 kg dry sediment/1.0 kg wet sediment) × (0.060 g glucose/g dry sediment) (1 mole glucose/180 g) × (24 mole e−/mole glucose) × (96487 C/1 mole e−)/[(0.3 mA) × (3.15 × 10⁷ s)/year)] = 22 years (Fig. 2).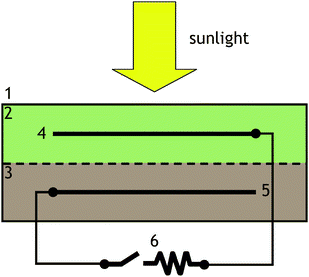 | ||
| Fig. 2 Cross section schematic depiction of the experimental setup. 1: transparent container; 2: overlying seawater; 3: marine sediment; 4: graphite cathode; 5: graphite plate anode; 6: external electrical circuit. Details provided in Methods section. | ||
Results
Within 1 week of assembly and exposure to sunlight, a proliferation of green-pigmented organisms was observed in the overlying water of cells 1, 2, and 3. Fig. 3A–E depicts a typical 72 h time record of sunlight intensity and the open circuit voltages (OCVs) of cells 1–3 after the proliferation occurred. The dotted vertical lines indicate when sunlight intensity greater than 5 lx is first and last detected at sunrise and sunset during a given day. Fig. 3B–D indicates that he OCVs of cells 1–3 exhibit a circadian rhythm.23,24 While they exhibit the same periodicity, the OCVs of cells 1–3 vary differently over time, which we attribute to the yet to be determined differences among these cells. The OCV of cell 4 (Fig. 3E) varies over a much smaller range, indicating that closing a cell with a lid significantly enhances the effect. (The rise in OCV of cell 4 during the first ca. 20 h is attributed to the initial development of the OVC after assembling the cell,10 and the abrupt change at ca. 67 h, resulted from inadvertently bumping the cell.)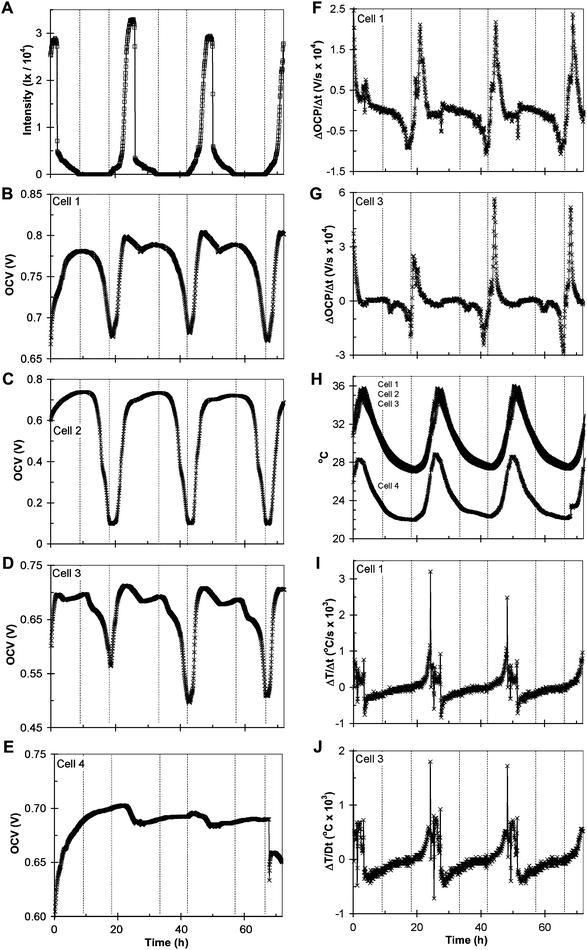 | ||
| Fig. 3 Typical 72 h record of sunlight intensity (A); open circuit voltage (OCV) of cell 1 (B); OCV of cell 2 (C); OCV of cell 3 (D); OCV of cell 4 (E); derivative of OCP with time for cell 1 (F); derivative of OCP with time for cell 3 (G); internal temperature of cells 1, 2, 3, and 4 (H); derivative of temperature with time for cell 1 (I), derivative of temperature with time for cell 3 (J). Dotted lines indicate when sunlight is first detected in the morning and last detected in the evening on a given day. | ||
Fig. 3F–G depicts the derivative of OCVvs. time (ΔOCP/Δt) recorded over the same period as above for cells 1 and 3, indicating that OCV periodicity is synchronous with sunlight periodicity. The OCVs of both cells exhibit an abrupt positive change when sunlight is first detected on a given day that abates before maximum sunlight intensity occurs, and a negative change that begins when sunlight is last detected that accelerates until sunlight is detected again the following day (ignoring small variations in timing among the cells and light monitor attributed to their arrangement with respect to shadowing by the windowsill edge).
Fig. 3H depicts the time record of internal temperature for cells 1–4 monitored over the same time period as above. Fig. 3H indicates that temperature also exhibits periodicity, that differences in OCV among cells 1, 2, and 3 do not result from differences among their temperatures, and that a closed cell operates at higher temperature than an open cell (cell 4).
Fig. 3I–J depicts the first derivative of internal temperature vs. time (ΔT/Δt) for cells 1 and 3 recorded over the same period as above. Fig. 3I–J indicates that temperature periodicity is also synchronous with sunlight periodicity. The greatest rate of heating occurs at the maximum sunlight intensity, followed immediately by cooling through the night, until sunlight is first detected the following day, at which time heating begins again after a lag in time.
Fig. 4A–D depicts a subsequent 120 h time record of sunlight intensity, OCV, and the anode open circuit potential (OCPA) and the cathode open circuit potential (OCPC) vs. the Ag/AgCl reference electrode, recorded simultaneously for cell 1. Fig. 4A–D indicates that the OCV periodicity is predominantly exhibited by the cathode, but the anode also exhibits a non-negligible contribution. The ca. 0.030 V fluctuation in OCPA can not be attributed to influence of the ca. 10 °C fluctuation in the external temperature of cell 1 (not depicted) on the potential of the reference electrode, which is expected to fluctuate by only 0.007 V, in the opposite direction.25
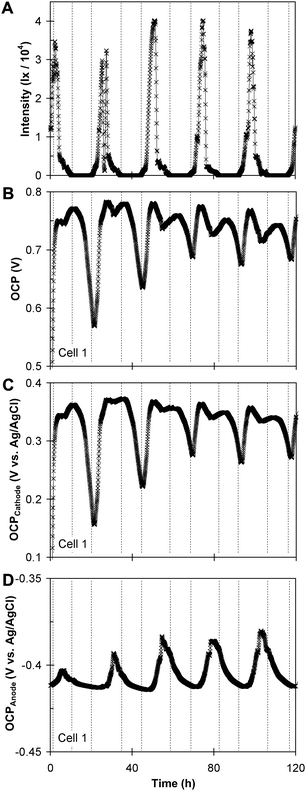 | ||
| Fig. 4 A subsequent 120 h time record of sunlight intensity (A), OCV of cell 1 (B); the open circuit cathode potential vs. time (C); and the open circuit anode potential vs. time (D). | ||
Fig. 5A–D depicts a subsequent 336 h time record of sunlight intensity and current generated by cell 3, when the cell voltage was maintained at 0.15 V. During time period 1 (ca. 23 h long), both cell 1 and the light meter were covered with blackout cloth to exclude sunlight ca. 1 h before sunset, and uncovered ca. 1.5 h before sunset the following day. During time period 2 (ca. 47 h long) cell 3 was covered ca 1.5 h before sunset and uncovered ca. 1.5 h before sunset 2 days later, while the light meter remained uncovered. Fig. 5C and D are higher resolution depictions of the current vs. sunlight intensity and current vs. temperature (temperature time record is incomplete) centered over time period 1. Fig. 5C indicates that covering cell 3 for ca. 24 h significantly suppressed the expected rise in current. When cell 3 was uncovered just before sunset, the current immediately rose even though the sunlight intensity was relatively low. Fig. 5D indicates that when cell 3 was covered, the current responded to rising temperature. On the day prior to covering cell 3, the sunlight intensity rose to 30![[thin space (1/6-em)]](https://www.rsc.org/images/entities/char_2009.gif) 300 lx (time = 91.3 h), the cell temperature rose by 7.2 °C, and the cell current rose by 0.207 mA. While covered, the cell temperature rose by 4.5 °C and the cell current rose by 0.130 mA. Covering cell 3 for 48 h (Fig. 5B) however further suppressed the rise in current (which fell below 0 A, indicating that cell 1 could no longer sustain an open circuit voltage of 0.15 V, but which immediately began to rise, when uncovered at the very end of the time record.
300 lx (time = 91.3 h), the cell temperature rose by 7.2 °C, and the cell current rose by 0.207 mA. While covered, the cell temperature rose by 4.5 °C and the cell current rose by 0.130 mA. Covering cell 3 for 48 h (Fig. 5B) however further suppressed the rise in current (which fell below 0 A, indicating that cell 1 could no longer sustain an open circuit voltage of 0.15 V, but which immediately began to rise, when uncovered at the very end of the time record.
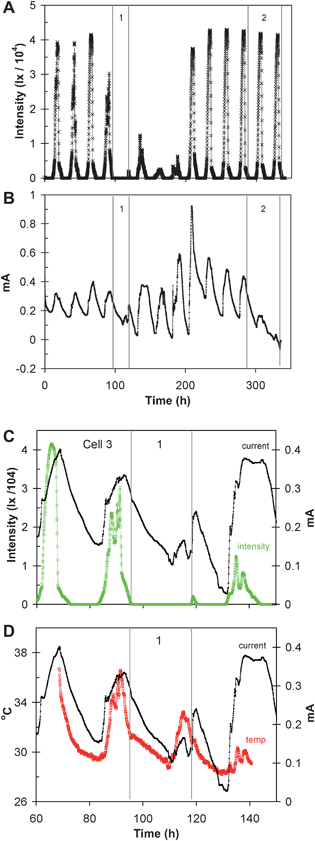 | ||
| Fig. 5 A subsequent 336 h time record of sunlight intensity (A); current generated by cell 3 while voltage was maintained at 0.15 V (B); higher resolution depiction of cell current and light intensity recorded between 60 and 150 h (C); higher resolution depiction of cell current and cell temperature recorded between 60 and 150 h (D). Over time period 1, cell 1 and the light meter were covered to block out light. During time period 2, only cell 1 was covered. | ||
Fig. 6A–C depicts a subsequent 168 h time record of sunlight intensity, internal temperature, and current generated by cells 2 and 3 when the cell voltage of each cell each was maintained at 0.15 V. In order to better document the light intensity and temperature dependencies of current, cell 3 was covered with blackout cloth during the indicated time period (ca. 43 h long) after sunset and uncovered ca. 1 h before sunset two days later while cell 2 remained uncovered through the entire time period. As described above (Fig. 5A–5D), by covering cell 3 for nearly two days, current was significantly suppressed. Current generated by cell 3 responded immediately when uncovered before sunset and fully recovered (appears to be enhanced) on the following day. On the day prior to covering cell 3, the sunlight intensity rose to 46![[thin space (1/6-em)]](https://www.rsc.org/images/entities/char_2009.gif) 800 lx (time = 44.3 h), the temperature of cells 2, and 3 rose by 11.9 °C, the current of cell 2 rose by 1.040 mA, and the current of cell 3 rose by 0.361 mA. While cell 3 was covered, the sunlight intensity rose on the first day to 39
800 lx (time = 44.3 h), the temperature of cells 2, and 3 rose by 11.9 °C, the current of cell 2 rose by 1.040 mA, and the current of cell 3 rose by 0.361 mA. While cell 3 was covered, the sunlight intensity rose on the first day to 39![[thin space (1/6-em)]](https://www.rsc.org/images/entities/char_2009.gif) 600 lx, the temperature of cell 2 rose by 8.0 °C, the temperature of cell 3 rose by 5.2 °C, the current of cell 2 rose by 0.680 mA, and the current of cell 3 rose by 0.087 mA. The ratio of change in current generated by cell 3 vs. cell 2 on the day prior to covering cell 3 is 0.347 (0.361 mA/1.040 mA). The same ratio when only cell 3 was covered is 0.128 (0.087 mA/0.680 mA). Comparing these ratios suggests, to a 1st approximation, 37% of the change in current by cell 3 (0.128/0.347) when covered results from the 5.2 °C temperature change ignoring the smaller change in temperature of cell 3 compared to cell 2.
600 lx, the temperature of cell 2 rose by 8.0 °C, the temperature of cell 3 rose by 5.2 °C, the current of cell 2 rose by 0.680 mA, and the current of cell 3 rose by 0.087 mA. The ratio of change in current generated by cell 3 vs. cell 2 on the day prior to covering cell 3 is 0.347 (0.361 mA/1.040 mA). The same ratio when only cell 3 was covered is 0.128 (0.087 mA/0.680 mA). Comparing these ratios suggests, to a 1st approximation, 37% of the change in current by cell 3 (0.128/0.347) when covered results from the 5.2 °C temperature change ignoring the smaller change in temperature of cell 3 compared to cell 2.
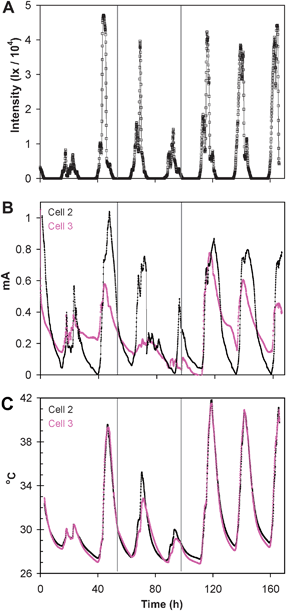 | ||
| Fig. 6 A subsequent 168 h time record of sunlight intensity (A); current generated by cells 2 and 3, while the voltage of each was maintained at 0.15 V (B); temperature of cells 2 and 3 (C). In the time frame between the vertical lines cell 3 was covered to block out light. | ||
Discussion
The figures in this article document a photoelectrochemical cell with current dependent on sunlight driven photosynthesis and heating. Drawing on the mechanism of power production by the BMFC10–13 we propose the following simplified mechanism of power generation for the photoelectrochemical solar cell depicted in Fig. 1. By removing the BMFC from the marine environment and placing it in direct sunlight, as described here, it is our hypothesis that photosynthetic microorganisms present in the original seawater samples in relatively low abundance (harvested from shallow coastal environments) become enriched when the cell is sealed due to the accumulation of carbon dioxide and depletion of oxygen in the overlying water.26–28 They use sunlight to convert the electrode products to glucose and oxygen, which can be re-utilized in the electrode reactions. In this way they may eliminate the need for constant flux of new glucose and oxygen, enabling persistent power generation from sunlight only. These conclusions are based on the known concept of the interdependency of distinct microbial consortia that self-localize in environmental niches within ecosystems as first put forth by Winogradsky in the 1890s,26–28 and exhibited by BMFCs. They are also based on the well studied processes of carbon and nutrient cycling across sediment–water interfaces that occur in marine environments.29–32 It is interesting to note that the average power density of cell 3 when not covered (Fig. 5A), 0.017 W m−2 of anode geometric surface, is identical to that of BMFCs utilizing sediment and seawater from the same site (Tuckerton NJ, USA). Since current density of BMFCs is limited by the flux of acetate to the anode surface (due to slow mass transport and conversion from glucose)14 these same processes may be limiting power generation by these solar cells. We interpret the sunlight-dependency of the open circuit voltage and the closed circuit current (and thus power) as most likely tracking changes in oxygen concentration at the cathode (Fig. 4A–C)33,34 driven by variations in the rates of carbon dioxide generation and oxygen consumption in the cell and the temperature-dependency of current as possibly resulting from the acceleration of fuel mass transport to the anode. A portion of the photosynthetically produced glucose must be consumed by sediment surface dwelling aerobic microorganisms (yielding a portion of the photosynthetically utilized carbon dioxide and water) in order to isolate the anode from oxygen, maintain a non-zero open cell voltage, and enable persistent electron flow through the external circuit. It is fluctuations in these processes that are exhibited as fluctuations in the open circuit voltages, as depicted in Fig. 3B–D, since, at open circuit, there are no contributions from the electrode reactions. Furthermore, while photosynthetic organisms can respire (i.e., generate carbon dioxide and water from glucose and oxygen), the ability to persistently generate current (at least 5040 h at this time for cell 3 without indication of depletion) indicates that the photosynthetic organisms are generating more oxygen then they are consuming; the balance of oxygen being consumed at the cathode. It is important to note that we cannot determine if glucose consumed in current generation depicted in Fig. 5B–D and in Fig. 6B and C originates exclusively from glucose present in the initial sediment inoculums. In the case of oxygen, a simple calculation (Methods section) reveals that an average of 0.3 mA of current (Fig. 5B) of current would deplete all the oxygen in a cell in ca. 266 h if it were not photosynthetically replenished. In contrast, it would take ca. 22 years to consume all of the organic matter originally present in the sediment (assuming all of it being labile glucose which provides a significant unknown in the calculation). Nonetheless, invoking the concepts described in ref. 29–35, photosynthetically generated glucose is expected to be available for the sediment fermentative microorganisms, as substantiated by its availability to the sediment surface dwelling aerobes.Conclusion
The solar cell reported here is intended as a proof-of-concept that electricity generation from sunlight can be entirely driven by microorganisms. By no means are the cells described here optimal with respect to maximum power generation vs. size and sunlight intensity. In the case of cell 3 for example, estimating an average peak power generation of 0.4 mA and an average solar peak radiation of 310 W (July, horizontal south facing plate, Washington DC, US)35 provides an estimate of a solar energy to electrical energy conversion efficiency of 0.00013% vs. ca. 10% for commercial silicon photovoltaics1 indicating that significant improvements are needed. Such improvements may include: (1) replacing sediment with aqueous media to increase the rate of mass transport at the anode; (2) use of metabolically engineered cyanobacteria that excrete glucose in high yield36 and glucose-metabolizing, electrode-reducing microorganisms to catalyze the anode oxidation of glucose37 thereby eliminating the need for fermentative organisms; (3) electrochemically adapting the anode and cathode microbial catalysts to generate current densities greater than 1 W m−2 of electrode geometric surface area;38 (4) optimization of the cell design to enable the most effective anode and cathode geometric surface areas within a given cell footprint by using vertical electrode arrays; (5) scaling the cell volume in order to accumulate excess glucose and oxygen generated during sunlight for electricity generation at night; and (6) maximizing mass transport due to diffusion and convection from radiant heating. With respect to diffusion, for example, current density expected for a cathode surrounded by a hypothetical 1 cm wide oxygen depletion zone (assuming no other limitations) can be estimated as ca. 20 A m−2 from Fick's law of diffusion:39| i = nFAD(ΔC/Δx) |
![[thin space (1/6-em)]](https://www.rsc.org/images/entities/char_2009.gif) 487 C), A is the anode geometric surface area (10
487 C), A is the anode geometric surface area (10![[thin space (1/6-em)]](https://www.rsc.org/images/entities/char_2009.gif) 000 cm2), D is the diffusion coefficient of oxygen in water (ca. 1 × 10⁻⁵ cm2 s−1 at 25 °C),40C is oxygen solubility in water (ca. 0.5 M at 25 °C),41 and x is the example depletion layer thickness (1 cm). The analogous calculation for an anode yields ca. 740 A m−2 where n = 24, D is the diffusion coefficient of glucose in water (ca. 6.6 × 10⁻⁶ cm2 s−1 at 25 °C),42 and C is the solubility of glucose in water (4.8 M at 25 °C).42 Previously published results demonstrated the ability to utilize photosynthetic microorganisms for increasing the efficiency of conversion of biomass to hydrogen for electrode oxidation in fuel cells.43,44 The photoelectrochemical solar cell reported here is distinct in that it most likely utilizes closed carbon and nutrient cycles not requiring continuous input of biomass for power generation.
000 cm2), D is the diffusion coefficient of oxygen in water (ca. 1 × 10⁻⁵ cm2 s−1 at 25 °C),40C is oxygen solubility in water (ca. 0.5 M at 25 °C),41 and x is the example depletion layer thickness (1 cm). The analogous calculation for an anode yields ca. 740 A m−2 where n = 24, D is the diffusion coefficient of glucose in water (ca. 6.6 × 10⁻⁶ cm2 s−1 at 25 °C),42 and C is the solubility of glucose in water (4.8 M at 25 °C).42 Previously published results demonstrated the ability to utilize photosynthetic microorganisms for increasing the efficiency of conversion of biomass to hydrogen for electrode oxidation in fuel cells.43,44 The photoelectrochemical solar cell reported here is distinct in that it most likely utilizes closed carbon and nutrient cycles not requiring continuous input of biomass for power generation.
Acknowledgements
This work was funded by the Office of Naval Research, Grant N00014-07-WX20515, and was performed in part by high school students (Malik, Grisdela, Lee, and Lee) participating in the Office of Naval Research Science and Engineering Apprenticeship Program at the Naval Research Laboratory and an college undergraduate (Drott) participating in the Office of Naval Research Naval Research Enterprise Intern Program. This article is dedicated to Dr Joel Schnur, founder of the Center for Bio/Molecular Science and Engineering at the Naval Research Laboratory on the occasion of his retirement after more than 40 years of public service.References
-
Basic Research Needs for Solar Energy Utilization, U.S. Department of Energy, Washington, DC, 2005 (http://www.er.doe.gov/bes/reports/abstracts.html%23SEU) Search PubMed
.
- J. Barber and B. Andersson, Trends Biochem. Sci., 1992, 17, 61 CrossRef CAS
.
- A. Huijser et al., J. Phys. Chem. C, 2007, 111, 11726 CrossRef
.
- S. A. Trammell et al., J. Phys. Chem. C, 2007, 111, 17122 CrossRef
.
- R. Das et al., Nano Lett., 2004, 4, 1079 CrossRef CAS
.
- E. Greenbaum, Science, 1985, 230, 1375 CAS
.
- S. A. Licht, Nature, 1987, 330, 148 CrossRef CAS
.
- N. S. Lewis, Science, 2007, 315, 798 CrossRef CAS
.
-
R. Alberte
et al., US Pat., 6,913,854, 2005
.
- C. E. Reimers et al., Environ. Sci. Technol., 2001, 35, 192 CrossRef CAS
.
- L. M. Tender et al., Nat. Biotechnol., 2002, 20, 821 CAS
.
- D. A. Lowy et al., Biosens. Bioelectron., 2006, 21, 2058 CrossRef CAS
.
- D. A. Lowy and L. M. Tender, J. Power Sources, 2008, 185, 70 CrossRef CAS
.
- L. M. Tender et al., J. Power Sources, 2008, 179, 571 CrossRef CAS
.
- D. R. Bond et al., Science, 2002, 295, 483 CrossRef CAS
.
- D. E. Holmes et al., Microbial. Ecol., 2004, 48, 178–190 Search PubMed
.
- O. Hasvold, J. Power Sources, 2004, 136, 232 CrossRef CAS
.
- W. S. D. Wilcock and P. C. Kauffman, J. Power Sources, 1997, 66, 71–775 CrossRef CAS
.
- C. E. Reimers et al., Geobiology, 2006, 4, 123–136 CrossRef CAS
.
- D. R. Lovley, Biotechnology, 2006, 17, 327 Search PubMed
.
- D. R. Lovley, Scientist, 2006, 7, 46 Search PubMed
.
- R. Weiss, Deep-Sea Res., 1970, 17, 721 CAS
.
- T. L. Hennessey and C. B. Field, Plant Physiol., 1991, 96, 831 CrossRef CAS
.
- A. A. R. Webb, New Phytol., 2003, 160, 281 Search PubMed
.
-
For Ag/AgCl reference electrode, E0(V) vs. the standard hydrogen electrode (SHE) = 0.23695 − 4.8564 × 10⁻⁴t − 3.4205 × 10⁻⁶t2 − 5.869 × 10⁻⁹t3 for 0 < t < 95 °C. A. J. Bard, R. Parson and J. Jordan, Standard Potentials in Aqueous Solution, Marcel Dekker, Inc., 1985 Search PubMed
.
- G. A. Zavarzin, Microbiol., 2006, 75, 501 CrossRef CAS
.
- D. C. Anderson and R. V. Hairston, Am. Biol. Teacher, 1999, 61, 453 Search PubMed
.
- L. T. Ackert, J. Hist. Biol., 2007, 40, 109 Search PubMed
.
- R. G. Wetzel, Death, Detritus, and Energy-Flow in Aquatic Ecosystems., Freshwater Biol., 1995, 33, 83 CrossRef
.
- C. J. Mann, Biogeochemistry, 1995, 31, 99 CAS
.
- M. F. Coveney and R. G. Wetzel, Limnol. Oceanogr., 1995, 40, 1187
.
-
Biogeochemistry of Gulf of Mexico Estuaries, ed. T. S. Biabchi, J. R. Penncok and R. R. Twilley, John Wiley & Sons, Inc., New York, 1999 Search PubMed
.
- G. C. McLeod, F. Bobblis, Jr. and C. S. Yentsch, Limnol. Oceanogr., 1965, 10(1), 146–149
.
- W. S. D. Wilcock and P. C. Kauffman, J. Power Sources, 1997, 66(1), 77–75 CrossRef
.
- http://rredc.nrel.gov/solar/old_data/nsrdb/redbook/atlas/ .
- D. R. Nobles and R. M. Brown, Cellulose, 2008, 15(5), 691–701 CrossRef CAS
.
- S. K. Chaudhuri and D. R. Lovley, Nat. Biotechnol., 2003, 21(10), 1229–1232 CrossRef
.
- K. P. Nevin, H. Richter, S. F. Covalla, J. P. Johnson, T. L. Woodard, A. Orloff, H. Jia, M. Zhang and D. R. Lovley, Environ. Microbiol., 2008, 10(10), 2505–2514 CrossRef CAS
.
-
A. J. Bard and L. R. Faulkner, Electrochemical Methods Fundamentals and Applications, 2nd Edition, Wiley and Sons, 2001 Search PubMed
.
- J. Lu-Kwang and C. S. Ho, Biotechnol. Bioeng., 2004, 27(10), 1495–1499
.
- C. N. Murray and J. P. Riley, Deep-Sea Res., 1969, 16(3), 311–320 CAS
.
- G. R. Ziegler, A. L. Benado and S. S. H. Rizvi, J. Food Sci., 2006, 53(2), 501–502
.
- M. Rosenbaum, U. Schröder and F. Scholz, Appl. Microbiol. Biotechnol., 2005, 68, 753 CrossRef CAS
.
- M. Rosenbaum, U. Schröder and F. Scholz, Environ. Sci. Technol., 2005, 39, 6328 CrossRef CAS
.
| This journal is © The Royal Society of Chemistry 2009 |
