Application of XANES spectroscopy in understanding the metabolism of selenium in isolated rainbow trout hepatocytes: insights into selenium toxicity
Sougat
Misra
a,
Derek
Peak
b and
Som
Niyogi
*a
aDepartment of Biology, University of Saskatchewan, 112 Science Place, Saskatoon, Canada S7N 5E2. E-mail: sougat.misra@usask.ca; som.niyogi@usask.ca; Fax: + 1 (306) 966 4461; Tel: + 1 (306) 966 4453
bDepartment of Soil Science, University of Saskatchewan, Saskatoon, Canada S7N 5A8. E-mail: derek.peak@usask.ca
First published on 20th September 2010
Abstract
Selenium (Se) is an essential element, but causes toxic effects in fish at a slightly elevated level beyond the threshold. However, the degree of Se toxicity differs depending on the chemical forms of Se (e.g., organic vs. inorganic) to which fish are exposed to. The mechanisms of Se metabolism and toxicity in fish, particularly at cellular level, are poorly understood. The present study was designed to examine the metabolic fate of different seleno-compounds, both inorganic and organic, in isolated hepatocytes of rainbow trout (Oncorhynchus mykiss) in primary culture using XANES spectroscopy. In cells exposed to 100 μM of selenate and selenite for 6–24 h, elemental Se was found to be the primary metabolite. Whereas, selenocystine appeared to be the major metabolite in cells exposed to 100 μM seleno-L-methionine for 6–24 h. Interestingly, we recorded L-methionine-γ-lyase activity in S9 fraction of cell lysate—an enzyme that directly catalyzes selenomethionine into methylselenol. We also found concurrent reduction of glutathione (GSH) concentration following reaction of seleno-L-methionine with cellular S9 fraction. Moreover, we observed a rapid increase in cellular reactive oxygen species (ROS) generation with increasing seleno-L-methionine exposure dose (100–1000 μM). These findings indicated the rapid cellular metabolism of seleno-L-methionine into methylselenol at higher exposure dose (≥100 μM), and the occurrence of GSH mediated redox cycling of methylselenol—a process that is known to produce reactive oxygen species (ROS). Overall, our results suggest that inorganic and organic selenium are metabolized through different metabolic pathways in rainbow trout hepatocytes. The findings of our study have important implications for understanding the chemical species-specific differences in Se toxicity to fish.
Introduction
Selenium (Se) is a vital constituent of many protein molecules with diverse physiological functions. Fish have 32–34 seleno-proteins relative to 23–25 in terrestrial vertebrates,1 and the physiological functions of some of these seleno-proteins are yet to be characterized. Se is known to be toxic to fish at a marginally elevated level beyond the threshold concentration required for normal physiological functioning. In the aquatic environment, seleno-compounds are present either as inorganic (e.g., selenite, selenate) or organic (e.g., selenomethionine, selenocysteine) forms. However, the degree of Se toxicity to aquatic animals differs within and among the organic and inorganic species. For example, selenite (SeO32−) is known to be much more toxic to fish compared to selenate (SeO42−) and seleno-DL-methionine.2 The diversity of Se speciation in the aquatic environment, along with its essentiality and chemical species-specific toxicity in biota, makes it a unique element of study from a toxicological perspective. In mammalian systems, the differences in toxicity among different seleno-compounds have been attributed to the differences in their metabolism, resulting in the direct and/or metabolites-mediated generation of reactive oxygen species (ROS), and thereby causing oxidative stress.3 This phenomenon though has yet to be investigated in piscine systems despite the fact that metabolic processes are largely conserved between mammals and fish.To date, the metabolism of Se in fish is poorly understood. Although the metabolism of seleno-amino acids in zebrafish (Danio rario) has been described in KEGG (Kyoto Enclycopedia of Genes and Genomes) metabolic pathway database, the functional characterization of such genome based pathway at the metabolite level has not been conducted. In mammalian systems, it has been suggested that the metabolism of selenite in the presence of glutathione (GSH) leads to the generation of superoxide anion (O2˙−), which is the primary cause of selenite cytotoxicity.4 Seko et al.5 explained this probable reaction mechanism with the intermediate metabolites of selenite (Fig. 1). In accordance to these findings, we have also demonstrated a dose dependent increase in the ROS production and subsequent loss of cellular thiol status in cultured rainbow trout (Oncorhynchus mykiss) hepatocytes exposed to selenite.6 In contrast, the metabolism of selenomethionine appears to be much more complex with many more intermediates than that of selenite. Based on the KEGG pathway resources, a schematic diagram of selenomethionine metabolism in zebrafish is presented in Fig. 2a. In this pathway, selenomethionine is metabolized into methylselenol (CH3SeH) via trans-sulfuration pathway. One of the intermediary metabolites of selenomethionine is selenocysteine, which is an important constituent of seleno-proteins. This pathway is thought to be prevalent under the normal nutritional regime. Whereas, at toxic level of selenomethionine, the existence of an enzyme-mediated cellular detoxification pathway has been proposed in mammalian systems, where the enzyme, L-methionine-γ-lyase, metabolizes selenomethionine into CH3SeH, α-ketobutyrate and ammonia.7 In addition, the GSH-mediated redox cycling of CH3SeH has been suggested to produce O2˙− (Fig. 2b, based on Chaudiere et al., 1992). However, the presence of L-methionine-γ-lyase—activity has yet to be confirmed in fish.
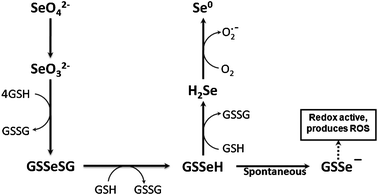 | ||
| Fig. 1 Schematic pathway of superoxide anion (O2˙−) production from the reaction of selenite (SeO32−) with glutathione (GSH) (Modified from Yan and Spallholz, 1993). This reaction mechanism with probable intermediates was proposed by Seko et al.5 However, it was Painter 25 who proposed first that excess GSH reacts with selenite resulting into formation of elemental Se. GSH reacts with selenite to produce Selenotrisulfide (GSSeSG). Selenotrisulfide is very labile and is reduced to redox reactive selenopersulfide (GSSe−) molecule either by the action of glutathione reductase in the presence of NADPH or in the presence of excess GSH. The conversion of hydrogen selenide (H2Se) into elemental selenium produces O2˙−, leading to selenite induced oxidative stress. | ||
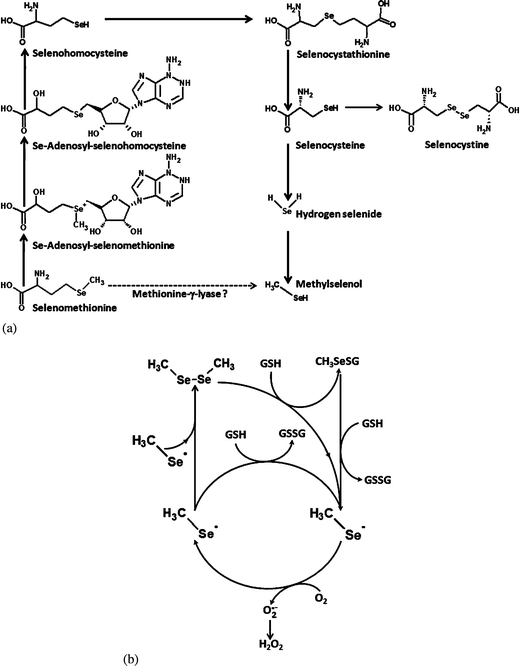 | ||
| Fig. 2 Selenomethionine metabolism in zebrafish (Danio rerio) as described in the orthology-based KEGG metabolic pathway (Fig. 2a). The enzymes of the trans-sulfuration pathway (conversion of selenomethionine into CH3Se via selenocysteine) are present in zebrafish. However, there is no evidence of direct catalysis of selenomethionine into CH3SeH. Note that redox cycling of CH3SeH (CH3Se˙ and/or CH3Se− form) in the presence of GSH (Fig. 2b) is the only known pathway of O2˙− generation during selenomethionine metabolism.26 | ||
One of the major challenges in unravelling the metabolic pathway of Se is the lack of sensitive analytical techniques capable of detecting the intermediate metabolites in biological samples. Most of the current techniques are limited by extensive sample pre-treatment, which can potentially change the oxidation state of metabolites, especially the inorganic intermediates. In this regard, the use of synchrotron-based intense X-ray absorption near edge structure (XANES) spectroscopy can be particularly useful in sensitive intracellular elemental speciation analysis. From the perspective of toxicological research, XANES spectroscopy is a much less explored yet quite promising state-of-the-art tool for investigating metabolic fingerprint of toxic metals/metalloids in complex biological matrices without any major sample pre-treatment steps or artifacts.8 Using this technique, a few recent studies have documented Se speciation in biological samples,9,10 although this approach has rarely been applied to in vitro studies. Since Se contamination in the aquatic environment is a complex and emerging issue, investigating the metabolic fate of this element is critical for understanding its toxicity in aquatic organisms. Keeping this in mind, we investigated the metabolism of selenate, selenite and L-selenomethionine in isolated rainbow trout hepatocytes in primary culture using XANES spectroscopy and biochemical analysis. We chose the cultured hepatocytes as a model experimental system for this study because liver is the primary site of Se metabolism in fish. It is also important to note here that selenate and selenite are the primary inorganic forms of Se in the aquatic ecosystems,2 whereas selenomethionine is known to be the most predominant organic selenium species found in the natural prey species of fish.11
Experimental
Chemicals
High purity Se standards [elemental selenium (≥99%), sodium selenite (98%), sodium selenate (98%), seleno-L-methionine (≥98%), Se-(Methyl)-selenocysteine hydrochloride (≥95%), selenocystine (≥98%), methylseleninic acid (95%) and dimethyl selenide (99%)] were obtained from Sigma-Aldrich, Mississauga, Canada. Sodium selenide was purchased from Alfa Aeser, USA. CM-H2DCFDA was purchased from Invitrogen, Burlington, Canada. All other chemicals, unless otherwise mentioned, were purchased from Sigma-Aldrich, St Louis, USA.Animal
Rainbow trout (O. mykiss) weighing 200–300 g were obtained from Lucky Lake Fish Farm, Saskatchewan. Fish were maintained in 1000 l flow-through aquaria receiving dechlorinated Saskatoon City water at a rate of 2 l/min under constant aeration. A photoperiod of 16 h light: 8 h dark and a water temperature of 15 ± 1 °C were maintained throughout the experimental period. The fish were fed once daily with Martin's commercial diet (Martin Mills Inc., Elmira, Canada) at a ration of 2% of body weight. All fish were acclimated for at least 2 weeks prior to their use in the experiments. The experimental protocol was in accordance with the Canadian Council for Animal Care Guidelines and was approved by the animal research ethics board at the University of Saskatchewan.Hepatocytes isolation and culture
Trout hepatocytes were isolated using a two-step collagenase perfusion as outlined elsewhere with minor modifications.6 The fish were euthanized with an overdose of MS-222 (0.5 g/L) in dechlorinated water. The hepatic portal vein was cannulated with PE-50 tubing and perfused with ice-cold modified Hank's Media (in mM: NaCl 136.9, KCl 5.4, MgSO4.7H2O 0.8, Na2HPO4.7H2O 0.33, KH2PO4 0.44, HEPES 5.0, Na-HEPES 5.0, pH 7.63). When the liver was completely blanched, the perfusion line was switched to the medium containing 0.2 mg/ml collagenase in Hank's Media, and the perfusion was continued until the liver was fully digested. The digested liver was carefully scraped with a razor blade on a Petri plate, and the dissociated cells were filtered through 260 and 73 μM mesh size strainers, respectively. The cells were then washed 3 times in Hanks’ Media at 700 rpm at 12 °C. This was followed by a single washing with the same media containing BSA (1%) and CaCl2 (1.5 mM). The cells were then incubated for 30 min in L-15 media (pH 7.63) containing antimicrobial and antimicotic solution (Invitrogen, Burlington, Canada) at 15 °C. The settled down cells were collected by aspirating out the media on the top and resuspended in 20 ml of L-15 media. Cell viability was determined by the trypan blue exclusion test, and the suspensions showing more than 90% cell viability were used for experiments. The cells were plated in 6-well Primaria plates (BD Falcon, Mississauga, Canada) at a density of 0.3 × 10⁶ cells/cm2 and incubated at 15 °C for at least 24 h to form monolayer prior to their use in the experiment.Sample preparation for XANES spectroscopy
Aqueous organic and inorganic Se standards were prepared inside an anaerobic chamber in a N2 atmosphere. Standards were prepared using 18 MΩ H2O (Barnstead NanoPure) that had been boiled for 15 min with continuous N2 sparging prior to transfer into the anaerobic chamber. All aqueous standards were initially 10–12 mM, but were diluted with 20% glycerol prior to their placement into liquid sample holders to eliminate diffraction in the samples. Sample holders were then frozen in liquid N2 and stored in a −80 °C prior to synchrotron analysis. Hepatocytes were exposed separately to 100 μM of selenite, selenate and seleno-L-methionine for 6 and 24 h at 15 °C in an attempt to understand whether there are any temporal variations in the metabolite profile. This dose was selected based on our preliminary investigation that exhibited no major changes in cell viability following 24 h exposure to 100 μM concentration of each compound, except selenite which caused approximately 20% decrease in cell viability relative to control (data not shown). Moreover, our previous study has shown that rainbow trout hepatocytes exposed to 100 μM sodium selenite for 24 h exhibited significant induction of oxidative stress parameters (e.g., superoxide dismutase, glutathione peroxidase and catalase activity, and reduced glutathione level) relative to the control,6 thereby suggesting metabolically active state of the cells at the dose used in this study. After the exposure to different seleno-compounds, the media was removed and cells were harvested using non-enzymatic cell dissociation solution. The detached cells were washed 3 times at 700 rpm at 4 °C to enhance the removal of any adsorbed parent compounds. The washed cells were freeze-dried in liquid N2 and the sample was introduced into the specific sample holder. Equal thickness of the prepared samples was approximated. The sample holder was then wrapped with Kapton tape and stored at −80 °C prior to analysis. No glycerol was added to cell samples due to concerns about detection limits.Se XANES data collection
Se K-Edge XANES were obtained at the Canadian Light Source (CLS) in Saskatoon, SK, Canada at the hard X-ray for Microanalysis (HXMA) beamline. For all samples, data were collected at 2.9 GeV in fluorescence mode using either a single channel Vortex detector for the aqueous standards or a 30 element Ge detector (Canberra, Meriden, USA) for the hepatocytes samples. To minimize beam-catalyzed changes in Se, all data were collected at 40 Kelvin using a liquid He cryostat. The beamline was calibrated to the Se K-Edge by setting the first derivative of an elemental Se standard to 12![[thin space (1/6-em)]](https://www.rsc.org/images/entities/char_2009.gif) 658 eV. This elemental Se reference remained behind the sample chamber for all data collection so that calibration could be continuously monitored and corrected if necessary. Data were collected from −100 to + 50 eV relative to the Se K-Edge using 0.2 eV steps, and multiple scans were averaged to obtain suitable signal to noise ratio for further analysis.
658 eV. This elemental Se reference remained behind the sample chamber for all data collection so that calibration could be continuously monitored and corrected if necessary. Data were collected from −100 to + 50 eV relative to the Se K-Edge using 0.2 eV steps, and multiple scans were averaged to obtain suitable signal to noise ratio for further analysis.
Se XANES data analysis
Data deduction and analysis were performed using WINXAS 3.1 software. Scans were averaged with energy adjustments performed automatically via the internal reference channel, background corrected by subtracting a linear baseline from 12.56 to 12.63 keV, and normalized to an edge step of 1.0 over a range of 12.62 to 12.7 keV. Linear Combination XANES fits were performed on normalized spectra over the 12.56 to 12.70 keV region using 2 passes, the first with both% contribution and E0 values allowed to vary, and a second run where E0 shift was fixed to zero.Measurement of L-methionine-γ-lyase activity
L-methionine-γ-lyase catalyzes selenomethionine into methylselenol, α-ketobutyrate and ammonia. The enzyme activity was measured in UV transparent 96-well plate (Greiner BioOne, Mississauga, Canada) using the surrogate substrate seleno-L-methionine, and by measuring the corresponding α-ketobutyrate generation.7 The assay cocktail contained 20 mM potassium phosphate buffer (pH-8.0), 10 mM seleno-L-methionine and 0.01 mM pyridoxal-5′-phosphate. The reaction was started by adding 50 μl of S9 fraction of hepatocytes lysate homogenized in 10 mM potassium phosphate buffer (pH-7.4) into the assay cocktail. After 15 min of incubation at 15 °C, the reaction was stopped using TCA to a final concentration of 10%. For each measurement, a corresponding blank (TCA was added first, followed by substrate at the end) was used to account for the endogenous α-ketobutyrate. The TCA treated sample was centrifuged at 20![[thin space (1/6-em)]](https://www.rsc.org/images/entities/char_2009.gif) 000 g for 20 min and the supernatant was used for α-ketobutyrate measurement.12 Since 3-methylbenzthiazolinone-2-hydrazone (MBTH) derivatives of different keto-acids fall within a narrow range of absorption maxima, the absorption maxima of MBTH derivate of pure α-ketobutyrate was determined under the experimental condition and found to be 316 nm. This wavelength was employed for the subsequent measurements in samples, which were carried out using the generated standard curve (R2 value: 0.998). The Bradford protein assay kit was employed to measure protein content in samples using bovine serum albumin (BSA) as the standard.13
000 g for 20 min and the supernatant was used for α-ketobutyrate measurement.12 Since 3-methylbenzthiazolinone-2-hydrazone (MBTH) derivatives of different keto-acids fall within a narrow range of absorption maxima, the absorption maxima of MBTH derivate of pure α-ketobutyrate was determined under the experimental condition and found to be 316 nm. This wavelength was employed for the subsequent measurements in samples, which were carried out using the generated standard curve (R2 value: 0.998). The Bradford protein assay kit was employed to measure protein content in samples using bovine serum albumin (BSA) as the standard.13
GSH measurement
Since GSH is implicated in redox cycling of CH3SeH (a metabolite of selenomethionine) in mammalian systems, we postulated that a similar mechanism might be involved in fish hepatocytes, which would influence the GSH concentration in the S9 fraction of hepatocytes lysate following incubation with seleno-L-methionine, as described above. GSH was measured following the method described by Hissin and Hilf.14 The protein precipitated S9 fraction of hepatocytes lysate was used for GSH measurement, adapted herein with 96-well black microplate (Eppendorf, Mississauga, Canada). We were able to detect GSH levels as low as 1 μg/ml using the adopted assay. Since high concentration of seleno-L-methionine was used as substrate for the L-methionine-γ-lyase activity measurement, possible interference of seleno-L-methionine on the GSH measurement was evaluated. However, we did not record any differences between seleno-L-methionine-spiked and non-spiked samples.Intracellular ROS measurement
It has been shown previously that CH3SeH is able to produce ROS in cell-free system.15 We therefore hypothesized that if selenomethionine can be enzymatically catalyzed into CH3SeH, we might observe an increase in intracellular ROS generation in trout hepatocytes following seleno-L-methionine exposure. Instead of measuring ROS in the cell lysate upon reaction with seleno-L-methionine, live cell imaging of ROS was performed. Intracellular ROS generation was measured using the fluorescent dye, CM-H2DCFDA. These experiments were conducted only with hepatocytes culture showing > 90% viability and within 24–36 h of isolation. Hepatocytes were cultured in poly-D-lysine coated glass bottom (Refractive Index −1.5) 2 × 9 μ-well chamber (Ibidi, München, Germany). Briefly, cells were loaded with 10 μM CM-H2DCFDA dissolved in dimethylformamide (DFO, final concentration <1% in L-15 media) at 15 °C for 30 min. ROS generation following seleno-L-methionine exposures [0 (control), 100 and 1000 μM] was measured using Carl Zeiss LSM 410 confocal microscope with a 40X, 0.9 numerical aperture oil immersion objective. Changes in the intracellular ROS were measured at room temperature (∼21 °C) for 30 min (5 min interval) using the 488 nm excitation Argon laser beam and emission was collected using 505–530 nm band pass filter. Cells were not exposed to any UV-light sources prior to image acquisition since we detected immediate burst of ROS generation in the UV-exposed cells. All other confocal and laser parameters were kept identical across the different treatments.Results and discussion
Fig. 3 shows Se K-Edge XANES spectra of several relevant aqueous selenium standard compounds as well as an elemental selenium solid standard. The main peak is due to the 1s → 4p transition and is systematically shifted to higher energies as Se changes from reduced to oxidized species. However, there are differences in the shape and position of this peak within the organo-selenium standards that are the result of differences in chemical bonding environment of Se rather than oxidation. This has been reported previously16,17 and it is known that Se XANES is sensitive to changes from aqueous to powder sample environment for organo-selenium compounds. Differences in spectral peak positions and line shapes have been shown to be significant enough to allow for the quantitative analysis of Se speciation in similar experimental systems.11 Our XANES spectra in Fig. 3 appear consistent with those of similar aqueous compounds available in the literature,11,16,17 and there is no evidence of any sample oxidation that could affect the use of these standards in quantitative analysis.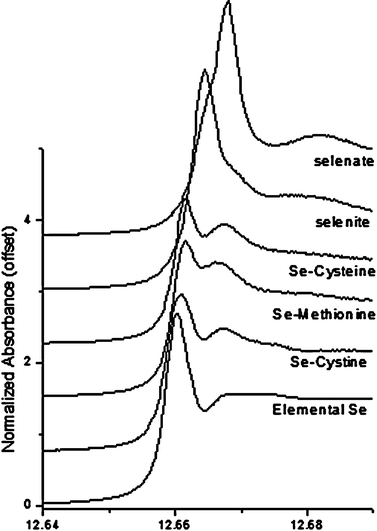 | ||
| Fig. 3 Se K-Edge XANES spectra of various inorganic and organic selenium reference compounds. | ||
Fig. 4 shows Se K-Edge XANES spectra of rainbow trout hepatocytes exposed to selenite and selenate for 6 h along with two of the standards (selenate and elemental Se). It is obvious from the shift to lower energies that both selenate and selenite were rapidly reduced by the hepatocytes. It is also evident from the shape of the 6 h sample spectra that the elemental Se is the predominant metabolite of selenite and selenate. The 24 h sample spectra were essentially identical to the 6 h sample spectra (data not shown). Since hydrogen selenide is known to be an important intermediate metabolite of Se metabolism (see Fig. 1 and 2a), an attempt was made to fit the sample spectra with sodium selenide (in solution) which was used as a surrogate standard for hydrogen selenide since the latter is not commercially available. However, the data from hepatocytes exposed to selenite and selenate did not provide a good fit with sodium selenide, probably because of the fact that hydrogen selenide was not present in sufficiently high enough concentration in our samples. Our observation is in good agreement with the proposed pathway described by Seko et al.5 (see Fig. 1). In this pathway, selenite is reduced to elemental selenium in the presence of excess GSH. Hepatocytes are known to have relatively higher GSH levels compared to various other cell types—a condition that likely facilitated the conversion of most of the intracellular selenite and selenate into elemental Se by 6 h. We believe that this rapid conversion of selenite and selenate into elemental Se is important in understanding the differences in cytotoxicity between selenite and selenate. We observed greater cytotoxicity of selenite over selenate when hepatocytes were exposed to equimolar (100 μM) concentration of each compound for 24 h (data not shown). This occurs possibly due to the relatively faster hepatocellular uptake of selenite over selenate, otherwise we would have observed similar or greater cytotoxicity of selenate compared to selenite, given that both compounds are metabolized by the same cellular pathway (see Fig. 1). Overall, our findings are in agreement with the results of Sarret et al.,18 who also reported 100% conversion of selenite into elemental Se within 48 h of exposure to metal resistant bacteria, Ralstonia metallidurans.
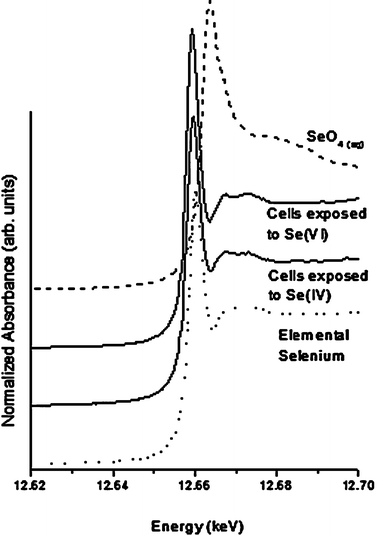 | ||
| Fig. 4 Se K-Edge XANES spectra for rainbow trout hepatocytes exposed to 100 μM of sodium selenite and sodium selenate for 6 h. | ||
Fig. 5a shows the differences in the spectra obtained from trout hepatocytes cultures exposed to seleno-L-methionine for 6 and 24 h. In contrast to the hepatocytes exposed to inorganic Se, there is clear time dependent change in the position of the main (dotted line) peak which shifted to the lower energy after 24 h. This can readily be explained, as detailed in Fig. 5b and c, by fitting the sample spectra as a mixture of selenomethionine and selenocystine. At 6 h, the sample appears to be a mixture of selenomethionine (63%) and selenocystine (37%), whereas the data at 24 h is described well with the combination of selenocystine (80%) and selenomethionine (20%). It is important to note that the potential contribution of selenomethionine due to entrained growth media is expected to be less than 5% of the observed signal, and therefore selenomethionine spectra recorded in our study was not an artifact of the sample preparation. Higher concentration of intracellular selenomethionine at 6 h observed in our study is in agreement with the observation of Beilsten and Whanger,19 who reported 90% of intracellular 75Se remained as selenomethionine in Chang liver cells. It should also be noted that fits were attempted with combinations of selenocysteine, selenocystine, selenomethionine, sodium selenide and elemental selenium, and in all cases the simple 2 component model in Fig. 5b and c produced the best fit. A similar fit of the 24 h sample spectra can be obtained with either selenomethionine or selenocysteine as the minor component, however neither standard successfully reproduces the higher energy portion of the sample data very well. This could be due to two possibilities: either there are other components for which we don't have standards that more successfully reproduces the 12.68–12.7 keV region, or there are multiple co-occurring species of similar Se coordination but none of them are high enough in concentration to substantially improve the fit. It is known that a large variety of organic selenium compounds exist as metabolic intermediates of the form R–Se–S–R; it is plausible that these would be modeled successfully near the Se Edge with selenocystine but less successfully at higher energies. Selenocysteine is one of the major intermediate in the trans-sulfuration pathway of selenomethionine metabolism. However, we found selenocystine as the major metabolite after 24 h exposure in our study. It is not possible to determine from our experiment whether this selenocystine is free or protein-incorporated. Under normal physiological condition, the reducing state of the intracellular environment might favour the presence of selenocysteine. However, selenocysteine is reported to be very unstable and readily oxidized into the corresponding diselenide, selenocystine.20 Our concurrent experiment shows that 100 μM seleno-L-methionine exposure dose induced ROS generation in trout hepatocytes (Fig. 6). Therefore, we suggest that increased ROS concentration have likely contributed to the oxidation of free selenocysteine to selenocystine.
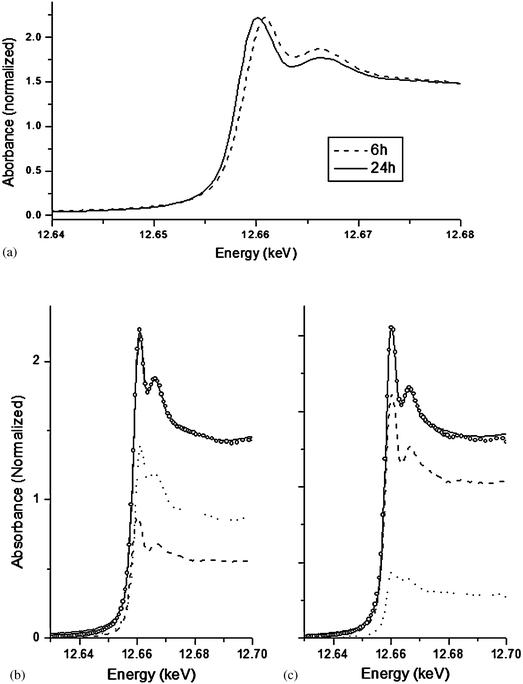 | ||
| Fig. 5 Differences in the Se K-edge XANES spectral profiles of rainbow trout hepatocytes exposed to 100 μM of seleno-L-methionine for 6 h and 24 h (5a). A shift in the main peak towards lower energy is indicative of reduction of Se over time. The figure exhibits linear combination fitting results for 6 h (5b) and 24 h (5c) seleno-L-methionine samples. In both Fig. 5b and c the dotted line represents seleno-L-methionine standard, dashed line represents selenocystine standard, open circle represents experimental data, and solid line represents fit results. | ||
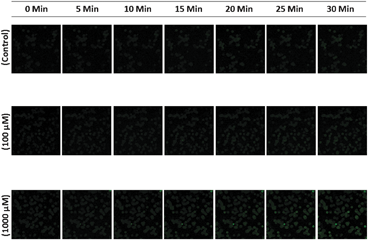 | ||
| Fig. 6 Time dependent changes in ROS generation in rainbow trout hepatocytes exposed to 0 (control), 100 and 1000 μM of seleno-L-methionine for a period of 30 min. | ||
As outlined previously, two different pathways of selenomethionine metabolism in vertebrates have been proposed to date. Under normal nutritional regime, selenomethionine is metabolized into selenocysteine via trans-sulfuration pathway. However, rapid transformation of selenomethionine into methylselenol by L-methionine-γ-lyase enzyme has been observed in mouse7 and bacteria21 at a higher or potentially toxic level. There is no direct evidence supporting the presence of L-methionine-γ-lyase enzyme in piscine systems. According to KEGG metabolic pathway, there is also no orthologue of L-methionine-γ-lyase gene in zebrafish. Palace et al.22 suggested the presence of L-methionine-γ-lyase–like enzyme activity in rainbow trout embryo based on the ability of embryo extract to produce O2˙− in the presence of GSH, which was implicated to the redox cycling of CH3SeH. In the present study, we recorded the activity of this enzyme, which is found to be much higher (3.52 ± 0.96 nmol/min/mg protein, mean ±SD, n = 12) than that reported in mouse liver (0.35 ± 0.29 nmol/min/mg protein). However, our data is quite comparable to the activity (2.8 ± 0.29 nmol/min/mg protein) reported in the crude extract of bacteria, Brevibacteruim linen. Since there is no prior evidence of the presence of such an enzyme in fish, we describe it to be L-methionine-γ-lyase—like activity. Interestingly, we were not able to detect CH3SeH in our sample through XANES spectroscopy. The plausible explanations for the above observation are either the CH3SeH level in our samples was below the detection limit of our analysis or spontaneous oxidation of methylselenol resulted into the formation of volatile dimethyl-diselenol.23 It is important to note here that CH3SeH, the L-methionine-γ-lyase catalyzed product of selenomethionine, may be present as CH3Se radical and/or CH3Se− anion depending on the homolytic or heterolytic cleavage. The redox cycling between both forms in the presence of excess intracellular GSH will lead to O2˙− generation (Fig. 2b). However, the spontaneous generation of dimethyl-diselenol from CH3Se˙ will be more favourable if the GSH level is depleted. In either case, it is likely that CH3SeH is one of the important metabolites of selenomethionine in trout hepatocytes.
Since we detected the L-methionine-γ-lyase-like activity in trout hepatocytes, the role of cellular GSH in the redox cycling of CH3SeH was also investigated. We postulated that if GSH mediated redox cycling of CH3SeH occurred in our experimental system, the GSH content would decrease in the assay mixture used to measure L-methionine-γ-lyase-like activity. Interestingly, we recorded a significant (p ≤ 0.05) decrease in the GSH content of the assay mixture after 15 min of reaction time (Fig. 7). Our observation further corroborates previous observation that GSH is involved in the redox cycling of selenomethionine metabolites.15 Based on the proposed pathway of redox cycling of CH3SeH (see Fig. 2b), the conversion of CH3Se− into CH3Se˙ leads to the generation of O2˙− (see Fig. 2b). Since O2 is the substrate for this reaction, we evaluated ROS production in the trout hepatocytes instead of the cell lysate to ensure that this mechanism persists under intracellular O2 tension. Our results demonstrate that ROS generation in hepatocytes increased moderately following 30 min exposure to 100 μM seleno-L-methionine compared to that in control, however this effect was more rapid and pronounced at 1000 μM exposure dose (Fig. 6). These observations provide an important insight into the role of L-methionine-γ-lyase—like activity in the metabolism of selenomethionine and subsequent ROS generation. In the trans-sulfuration pathway, selenomethionine can be converted into CH3SeH via selenocysteine, a process that requires multiple steps. This process is suggested to be mediated by selenocysteine-γ-lyase, which has a high Km value (0.83 mM) for seleno-L-cysteine.24 Therefore, it is likely that only a small quantity of selenocysteine can be metabolized by this pathway when substrate concentration is low-as might have been the case with 100 μM seleno-L-methionine exposure dose. Based on our XANES spectroscopy and ROS data, it can be suggested that the generation of CH3SeH via trans-sulfuration pathway was limited since selenocystine was the predominant metabolite instead of selenocysteine. Thus, low selenocysteine concentration was probably the rate-limiting step for CH3SeH generation in trans-sulfuration pathway. Taken together, these observations indicate a slow process of CH3SeH generation by trans-sulfuration pathway even at high or toxic concentration of selenomethionine. Moreover, if the trans-sulfuration pathway would have been the only pathway of selenomethionine metabolism in trout hepatocytes, we would not have observed such a rapid increase of ROS generation and reduction of GSH content. Thus, the present study provides an indirect evidence of the critical role of L-methionine-γ-lyase—like activity in selenomethionine metabolism in trout hepatocytes.
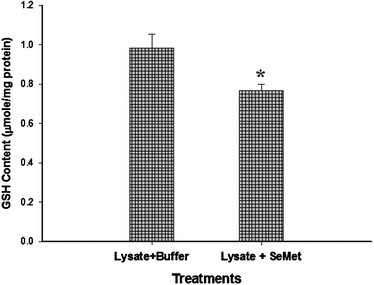 | ||
| Fig. 7 Reduction in the GSH content following the reaction of seleno-L-methionine with the S9 fraction of rainbow trout hepatocytes. Bar with asterisk shows significant decrease in the GSH content of reaction mixture (Mann-Whitney rank sum test, p ≤ 0.05, n = 10). | ||
Conclusion
Our study suggests that inorganic and organic selenium are metabolized via different metabolic pathways in rainbow trout hepatocytes. We have shown that elemental Se is the major metabolite of selenate and selenite. In contrast, it appears that there are probably two different pathways of selenomethionine metabolism. In trans-sulfuration pathway, selenocystine is the dominant metabolite of selenomethionine, whereas selenomethionine is directly metabolized into CH3SeH by L-methionine-γ-lyase mediated catalysis in the other pathway. The latter process likely becomes more prominent during exposure to a higher dose since we observed increasing ROS generation, which results from GSH dependent redox cycling of CH3SeH, with increasing selenomethionine exposure dose. The present study also demonstrates the usefulness of XANES spectroscopy in analyzing speciation of Se at cellular level, which can be very helpful in understanding the mechanistic aspects of Se cytotoxicity.Acknowledgements
This paper is dedicated to Prof. Klaus Schwarz for his significant contribution in the field of selenium biology. This work was supported by a Discovery Grant to S.N. from the National Science and Engineering Research Council (NSERC) of Canada. We thank Drs Ning Chen and Chang-Yong Kim of HXMA for beamline support throughout the XANES experiments. The research described in this paper was performed at the Canadian Light Source, which is supported by NSERC, NRC (National Research Council, Canada), CIHR (Canadian Institutes of Health Research), and the University of Saskatchewan. We also acknowledge Saskatchewan Structural Science Centre (SSSC) for allowing us to use the confocal microscope.References
- A. Lobanov, D. Hatfield and V. Gladyshev, GenomeBiology, 2008, 9, R62 CrossRef.
- S. J. Hamilton and K. J. Buhl, Arch. Environ. Contam. Toxicol., 1990, 19, 366–373 CrossRef CAS.
- J. E. Spallholz, Free Radical Biol. Med., 1994, 17, 45–64 CrossRef CAS.
- L. Yan and J. E. Spallholz, Biochem. Pharmacol., 1992, 45, 429–437.
- Y. Seko, Y. Saito, J. Kitahara and N. Imura, in Selenium in Biology and Medicine, ed. A. Wendel, Springer-Verlag, Berlin, 1989, pp. 70–73 Search PubMed.
- S. Misra and S. Niyogi, Toxicol. in Vitro, 2009, 23, 1249–1258 CrossRef CAS.
- T. Okuno, T. Kubota, T. Kuroda, H. Ueno and K. Nakamuro, Toxicol. Appl. Pharmacol., 2001, 176, 18–23 CrossRef CAS.
- K. K. Gunter, L. M. Miller, M. Aschner, R. Eliseev, D. Depuis, C. E. Gavin and T. E. Gunter, NeuroToxicology, 2002, 23, 127–146 CrossRef CAS.
- I. J. Pickering, R. C. Prince, D. E. Salt and G. N. George, Proc. Natl. Acad. Sci. U. S. A., 2000, 97, 10717 CrossRef CAS.
- D. B. Vickerman, J. T. Trumble, G. N. George, I. J. Pickering and H. Nichol, Environ. Sci. Technol., 2004, 38, 3581–3586 CrossRef CAS.
- R. Andrahennadi, M. Wayland and I. J. Pickering, Environ. Sci. Technol., 2007, 41, 7683–7687 CrossRef CAS.
- K. Soda, Anal. Biochem., 1968, 25, 228–235 CrossRef CAS.
- M. M. Bradford, Anal. Biochem., 1976, 72, 248–254 CrossRef CAS.
- P. J. Hissin and R. Hilf, Anal. Biochem., 1976, 74, 214–226 CrossRef CAS.
- J. E. Spallholz, B. J. Shriver and T. W. Reid, Nutr. Cancer, 2001, 40, 34–41 Search PubMed.
- A. L. Ryser, D. G. Strawn, M. A. Marcus, S. Fakra, J. L. Johnson-Maynard and G. Moller, Environ. Sci. Technol., 2006, 40, 462–467 CrossRef CAS.
- I. J. Pickering, G. E. Brown and T. K. Tokunaga, Environ. Sci. Technol., 1995, 29, 2456–2459 CrossRef CAS.
- G. Sarret, L. Avoscan, M. Carriere, R. Collins, N. Geoffroy, F. Carrot, J. Coves and B. Gouget, Appl. Environ. Microbiol., 2005, 71, 2331 CrossRef CAS.
- M. A. Beilstein and P. D. Whanger, J. Inorg. Biochem., 1987, 29, 137–152 CrossRef CAS.
- J. Beld, K. J. Woycechowsky and D. Hilvert, Biochemistry, 2007, 46, 5382–5390 CrossRef CAS.
- H. Inoue, K. Inagaki, M. Sugimoto, N. Esaki, K. Soda and H. Tanaka, J Biochem., 1995, 117, 1120–1125 CAS.
- V. P. Palace, J. E. Spallholz, J. Holm, K. Wautier, R. E. Evans and C. L. Baron, Ecotoxicol. Environ. Saf., 2004, 58, 17–21 CrossRef CAS.
- C. Gabel-Jensen, K. Lunoe and B. Gammelgaard, Metallomics, 2010, 2, 167–173 RSC.
- N. Esaki, T. Nakamura, H. Tanaka and K. Soda, J. Biol. Chem., 1982, 257, 4386–4391 CAS.
- E. P. Painter, Chem. Rev., 1941, 28, 179–213 CrossRef CAS.
- J. Chaudiere, O. Courtin and J. Leclaire, Arch. Biochem. Biophys., 1992, 296, 328 CrossRef CAS.
| This journal is © The Royal Society of Chemistry 2010 |
