DOI:
10.1039/B9NR00239A
(Paper)
Nanoscale, 2010,
2, 573-581
Tunable properties of PtxFe1−x electrocatalysts and their catalytic activity towards the oxygen reduction reaction
Received (in Hong Kong, China)
25th August 2009
, Accepted 16th November 2009
First published on
26th January 2010
Introduction
Proton exchange membrane fuel cells (PEMFCs) have received great attention as promising power sources especially for electric vehicles and portable devices.1–3 It is well known that the overall cell voltage of a PEMFC is limited by the slow reaction kinetics of the oxygen reduction reaction (ORR) on Pt catalysts. Under typical PEMFC operating conditions, ORR kinetic limitations causes significant cathodic overpotential losses, amounting to 0.3–0.4 V.4,5 The development of new materials with catalytic properties to perform oxygen reduction with significant reduction in cathodic overpotentials is presently a challenging task of great technological importance. Several bimetallic systems have been extensively investigated in order to improve the ORR efficiency. Due to the structural changes caused by the alloying of the second metal, some Pt-based bimetallic systems are reported to perform well in the ORR. For instance, alloying Pt with transition metals such as, Co,6,7 Ni,8–10 Fe,11 Mn,11 Cr12–14 and V15 is highlighted as a promising approach towards improving ORR electrocatalysis in acidic solutions. A number of explanations have been given for the observed improvement in activity by the addition of a less noble metal to Pt. These include the lower oxidation state of the Pt which can suppress Pt oxide formation, a shortening of Pt–Pt interatomic distances by alloying and therefore a more favorable adsorption of O2 (geometric effect),12 an increased number of 5d orbital vacancies (electronic effect), and formation of a thin Pt-skin on the surface of the alloy due to the leaching out of the base metal from the Pt alloy under acidic conditions16 which has unusual electronic properties. It has been demonstrated that the activity of ORR electrocatalysts is strongly dependent on various factors such as particle size and particle size distribution,12,17,18 morphology of the catalyst,19 catalyst composition and, in particular, its surface composition, oxidation state of Pt and second metal atom,7 and surface structure of the catalyst.16 Several efforts have been made to improve the dispersion and stability of Pt nanoparticles,20–23 creating a near-surface region with a Pt-skin structure in Pt-alloys via acid treatment,24,25 and a core–shell structure.26–28 In the past few years, bimetallic Pt–Fe nanoparticles have gained much interest as ORR catalysts and in most of the cases they exhibit enhanced activities compared to Pt-only catalysts17,29,30 Chen et al. have shown that by optimizing the amount of Fe in Pt–Fe/C nanocatalysts superior ORR activity can be obtained when compared to the Pt-only catalysts.31 The relation between the Fe content and the ORR activity on the surface of synthesized Pt–Fe/C catalysts with various Pt-to-Fe compositions was established and it was claimed that too much or too little Fe content will lower the ORR activity on the basis of surface d-band vacancies. It has been demonstrated that Pt–Fe/C nanoparticles have the higher H2O2 decomposition activities in the presence of the redox couple of the transition metal leaching out from the catalyst especially in acidic solutions.32 Toda et al. examined ORR activities on sputtered alloyed catalysts (Pt–X/C, X = Fe, Ni, Co) and presented an enhanced mechanism for ORR on the basis of the observed d-band vacancies of a Pt layer.16 It is proposed that the electrons are transferred from the 2π orbital of the O2 to an empty 5d2z orbital of the surface Pt atom. Simultaneously, electrons from the partially filled 5dxz or 5dyz orbitals of the Pt are back-donated to 2π* orbital of O2. Thus, a modification of surface d-band vacancies is speculated to facilitate electron donation from O2 to surface Pt atoms thereby enhancing the dioxygen adsorption on to the Pt surface and weakening the O–O bond to facilitate enhanced ORR activity. Recent self-consistent periodic density functional theoretical calculations have shown that the presence of Fe atoms facilitates the dissociation of O2 on the Pt (111) surface.33 Although significant experimental and theoretical research efforts have emphasized the influence of surface chemistry and electronic structure of Pt alloy single crystal surfaces, exploitation of such information to practical nanoparticle-based catalysts requires vigorous characterization techniques. It is known that composition homogeneity and atomic distribution and alloying extent of participating elements in individual bimetallic nanoparticles are also important factors which need to be considered in obtaining good electrocatalytic activity. Furthermore, precise correlation between the effect of catalyst composition and nanoparticle structure to the efficiency of ORR is essential to develop inexpensive, stable and catalytically active materials for the ORR. Although the commonly available X-ray powder diffraction (XRD) technique is capable of predicting the atomic arrangement preferably in single crystals or polycrystals with sufficient long-range order, it cannot provide the structural parameters required to understand the atomic distribution in bimetallic nanoparticles. Hence, conclusions about alloy structure related to nanoparticles where short-range order exists are incomplete from XRD results.34 The electron microscopy techniques like TEM and high-resolution TEM provide only a qualitative understanding of the structure of bimetallic NPs.35–38 For example, TEM emphasizes the intensity contrast in understanding the structure of a bimetallic nanoparticle. On the other hand, the HRTEM method enables one to distinguish core–shell structures on the basis of observing different lattice spacings. Regarding the bimetallic cluster, both anomalous wide-angle X-ray scattering39–41 (AWAXS) and X-ray absorption spectroscopy (XAS) techniques can provide information on the morphology of the considered species, as well as the distribution of the two metals inside the species. XAS appears to be a suitable technique to solve the three-dimensional structure of both mono- and bimetallic nanoparticles.42 XAS studies can be divided into two parts; one is the study of the XANES (X-ray absorption near-edge structure) region (conventionally from below the edge up to ca. 30–50 eV) which provides critical information about the oxidation state and fractional d electron density, and the electronic environment of the absorbing atoms. The other is the study of the EXAFS (extended X-ray absorption fine structure) region (above the edge ca. 30–1000 eV) which can provide details about the number, type and distance of the backscattering atom surrounding the central absorbing atom and allow investigation of the short-range ordering and provide geometric information.
In this study, we synthesized bimetallic PtxFe1−x nanoparticles with various Pt-to-Fe atomic ratios utilizing a chemical reduction method. The correlations among unfilled d states, the alloying extent of Pt and Fe, and the catalyst compositions of the corresponding ORR activities are discussed. To explore the d-band vacancies and alloying extent of Pt–Fe nanoparticles, the XAS technique has been employed. Cyclic voltammetry and rotating-disk voltammetry measurements were performed to determine the ORR activity of the catalysts. Further, DFT computational calculations were utilized to estimate the amount of charge transfer involved in the PtxFe1−x system with various Pt-to-Fe atomic ratios. The combined XAS and DFT computation results indicate that the Pt1Fe1/C catalyst possess higher alloying of Pt and Fe with fewer unfilled d states and owns a higher electron transfer from Fe to Pt. As a result, the Pt1Fe1/C catalyst exhibits the maximum surface-specific activity towards the ORR when compared to the Pt1Fe3/C and Pt3Fe1/C catalysts.
Experimental section
Preparation of carbon-supported PtFe nanoparticles
Reagent grade chemicals were purchased from ACROS and were used as-received without further purification. 30 wt% PtxFe1−x/C nanoparticles stabilized by oleylamine and oleic acid with various Pt-to-Fe atomic ratios of 3![[thin space (1/6-em)]](https://www.rsc.org/images/entities/char_2009.gif) :
:![[thin space (1/6-em)]](https://www.rsc.org/images/entities/char_2009.gif) 1, 1
1, 1![[thin space (1/6-em)]](https://www.rsc.org/images/entities/char_2009.gif) :
:![[thin space (1/6-em)]](https://www.rsc.org/images/entities/char_2009.gif) 1 and 1
1 and 1![[thin space (1/6-em)]](https://www.rsc.org/images/entities/char_2009.gif) :
:![[thin space (1/6-em)]](https://www.rsc.org/images/entities/char_2009.gif) 3 were synthesized by a chemical reduction method. In a typical process, an appropriate amount of Pt(acac)2, 1,2-hexadecanediol (0.75 mmol) and 10 mL of dioctyl ether were added to a three-necked reaction flask. The solution temperature was raised to 100 °C and maintained for about 15 min. While vigorously stirring the reaction mixture, oleylamine (0.25 mmol), oleic acid (0.25 mmol), and an appropriate amount of Fe(CO)5 were injected by a syringe into the solution. Before the addition, the mixture of oleylamine, oleic acid, and Fe(CO)5 was heated to the boiling point of dioctyl ether, i.e. to 300 °C. After the addition, the whole reaction mixture was refluxed for 30 min. Later, the reaction mixture was cooled down to room temperature. The product was then precipitated out by washing with a mixture of 20 mL of ethanol, followed by centrifugation and drying. Finally, 80 mg of carbon black (Vulcan-XC72R) was mixed with 20 mg of PtxFe1−x. The carbon-supported PtxFe1−x/C nanoparticles were thermally treated at 300 °C for 1 h in a 10% H2 atmosphere.
3 were synthesized by a chemical reduction method. In a typical process, an appropriate amount of Pt(acac)2, 1,2-hexadecanediol (0.75 mmol) and 10 mL of dioctyl ether were added to a three-necked reaction flask. The solution temperature was raised to 100 °C and maintained for about 15 min. While vigorously stirring the reaction mixture, oleylamine (0.25 mmol), oleic acid (0.25 mmol), and an appropriate amount of Fe(CO)5 were injected by a syringe into the solution. Before the addition, the mixture of oleylamine, oleic acid, and Fe(CO)5 was heated to the boiling point of dioctyl ether, i.e. to 300 °C. After the addition, the whole reaction mixture was refluxed for 30 min. Later, the reaction mixture was cooled down to room temperature. The product was then precipitated out by washing with a mixture of 20 mL of ethanol, followed by centrifugation and drying. Finally, 80 mg of carbon black (Vulcan-XC72R) was mixed with 20 mg of PtxFe1−x. The carbon-supported PtxFe1−x/C nanoparticles were thermally treated at 300 °C for 1 h in a 10% H2 atmosphere.
XAS measurements
X-Ray absorption spectra were recorded at the beam line 17C, National synchrotron Radiation Research center, Taiwan. The electron storage ring was operated at 1.5 GeV with a current of 300 mA. A Si(111) double crystal monochromator was employed for the energy selection with a resolution ΔE/E better than 2 × 10⁻⁴ at both the Pt LIII-edge (11564 eV) and the Fe K-edge (7112 eV). All the experiments on bimetallic nanoparticles were conducted on a home-made cell made with stainless steel for XAS powder study. Prior to the XAS measurements, samples were reduced with 10% H2 for 1 h at 300 °C in order to remove the any oxidized species remaining on the surface from catalyst preparation. The total amount of the sample was adjusted to reach the optimum absorption thickness (Δμx = 1.0, where Δμ is the absorption edge, x is the thickness of the sample) so that proper edge-jump step could be achieved during the XAS measurements. All of the spectra were recorded at the room temperature in transmission mode. Higher harmonics were eliminated by detuning the double crystal Si(111) monochromator. Three gas-filled ionization chambers were used in series to measure the intensities of the incident beam (I0), the beam transmitted by the sample (It), and the beam subsequently transmitted by the reference foil (Ir). The third ion chamber was used in conjunction with the reference sample, which was a Pt foil for the Pt LIII-edge measurements and an Fe foil for the Fe K-edge measurements. The control of parameters for EXAFS measurements, data collection modes, and calculation of errors were all done as per the guidelines set by the international XAFS society standards and Criteria Committee.43
EXAFS data analysis
The XAS experimental data were treated by utilizing the standard procedures. The EXAFS function, χ, was obtained by subtracting the post-edge background from the overall absorption and then normalized with respect to the edge-jump step, The normalized χ(E) was transformed from energy space to k-space, where k is the photoelectron wave vector. The χ(k) data were multiplied by k2 to compensate for the damping of EXAFS oscillations in the high k-region. Subsequently, k2-weighted χ(k) data in k-space ranging from 3.51 to 11.4 Å−1 for the Pt LIII-edge and from 3.52 to 10.41 Å−1 for the Fe K-edge were Fourier transformed (FT) in to r-space to separate the EXAFS contribution from the different coordination shells. A non-linear least-squares algorithm was applied to the curve fitting of an EXAFS contribution in the r-space between 1.8 and 3.2 Å for both Pt and Fe depending on the bond to be fitted. The Pt–Fe reference file was determined by a theoretical calculation. Reference phase and amplitude for the Pt–Pt absorber-scatter pairs were obtained from a Pt foil. For the Fe–Fe and Fe–O absorber-scatter pairs, the phase and amplitude were obtained from the reference Fe foil and FeO, respectively. All the computer programs were implemented in the UWXAFS 3.0 package,44 with the backscattering amplitude and the phase shift for the specific atom pairs being theoretically calculated by using the Feff7 code.45 From these analyses, structural parameters such as coordination numbers (N), bond distance(R), Debye–Waller factor (Δσ2j) and inner potential shift (ΔE0) have been calculated. The amplitude reduction factor S2o, values for Pt and Fe were obtained by analyzing the Pt and Fe foil reference samples, respectively and by fixing the coordination number in the FEFFIT input file, The S2o values were found to be 0.95 and 0.72 for Pt and Fe, respectively.
HRTEM measurements
The particle size of the as-prepared PtxFe1−x nanoparticles with various Pt-to-Fe atomic ratios was evaluated by high-resolution transmission electron microscopy (HRTEM) using an FEI-TEM-2000 microscope that was operated at an accelerating voltage of 3800 kV. Specimens were prepared by ultrasonic dispersion in toluene, and by dropping the suspension on a copper grid followed by drying in the oven.
Electrode preparation and electrochemical measurements
Analytical grade Millipore water (18 MΩ) and sulfuric acid (ACROS) were used in this study. All the experiments were carried out at ambient temperature of 25 ± 1 °C, unless stated otherwise. A conventional three-electrode electrochemical cell was used for the CV measurements, with a high surface area Pt electrode, and the saturated calomel electrode (SCE) as a counter and reference electrodes, respectively powered by a Solartron 1480 Potentiostat/Galvanostat. However, all potentials in this paper are quoted with respect to the reversible hydrogen electrode. The working electrode was made of the carbon-supported Pt and/or Pt–Fe catalyst immobilized on a glassy carbon electrode (GCE) surface (0.1964 cm2). The procedure for electrode fabrication involves, first, preparation of a clear suspension by sonicating a known amount of Pt–Fe/C catalyst powder dispersed in 0.5% Nafion, second, placing an aliquot of this suspension (7 μl containing 6.2 μg Pt mL−1 of the catalyst) on the GCE disc, and third air-drying for about 5 min at room temperature and then at 80 °C to yield a uniform thin film of the catalyst. 0.5 M sulfuric acid was used as a supporting electrolyte for all the experiments.
DFT computation
In the DFT calculations, the projector-augmented waves (PAW)46–49 generalized gradient approximation (GGA)50–52 was employed as implemented in the Vienna ab initio simulation package (VASP).53–55 In the plane wave calculations, a cutoff energy of 400 eV was applied, which was automatically set by the total energy convergence calculation for Pt(111) systems.
Results and discussion
The synthesis of bimetallic PtxFe1−x/C electrocatalysts with tunable physical properties was successfully achieved by controlling the Pt-to-Fe atomic composition. Fig. 1 shows the X-ray absorption near edge structure (XANES) features obtained at the Fe K-edge for the PtxFe1−x/C catalyst nanoparticles with various Pt-to-Fe ratios and reference Fe foil. The XANES spectra can provide crucial information on the oxidation state, the fractional d electron density and the electronic environment of the absorbing atom of PtxFe1−x/C catalyst nanoparticles required for elucidating the electronic structure. In the Fe K-edge XANES spectra of Fig. 1, the absorption at 7112 eV corresponds to an electronic transition from a 1s to 3d orbital.56 The absorption hump at 7125 eV corresponds to a 1s to 4d transition.57 As can be seen from Fig. 1, the intensities of the absorption hump from different samples are higher than the iron foil and this might result from the nanosize effect or due to the presence of iron oxide. The Fourier transforms (FT) of experimental EXAFS data at the Fe K-edge for the home-made PtxFe1−x/C catalyst nanoparticles and the reference Fe foil are shown in Fig. 2. The FT modules of all home-made PtxFe1−x/C catalyst nanoparticles exhibit a peak between 2.0 and 3.0 Å corresponding to the first coordination shell of Fe–Fe and Fe–Pt. The magnitude of the FT module related to the first shell coordination increases with increasing Fe content in the catalyst. The structural parameters derived from the Fe K-edge and Pt LIII edge EXAFS spectra are listed in Table 1.
Table 1 Best-fit structural parameters obtained from the analysis of the Pt LIII-edge and Fe K-edge EXAFS spectra for the home-made PtxFe1−x/C catalysts with various Pt-to-Fe ratiosa
| Catalyst |
Shell |
N |
R j/Å |
σ 2(×10−3)/A2 |
ΔE0/eV |
r |
| Coordination number, N; bond distance, R; residual error, r; Debye–Waller factor, σ; inner potential shift, ΔE0. |
Pt:Fe 1![[hair space]](https://www.rsc.org/images/entities/char_200a.gif) : :![[hair space]](https://www.rsc.org/images/entities/char_200a.gif) 3 3 |
Pt–Fe |
7.9(±0.8) |
2.618(±0.001) |
9.7(±0.2) |
+0.1 |
0.017 |
| Pt–Pt |
2.3(±1.0) |
2.715(±0.001) |
5.0(±0.1) |
+13.1 |
| Fe–Fe |
1.8(±0.8) |
2.643(±0.022) |
8.0(±0.8) |
−5.4 |
| Fe–Pt |
4.8(±1.7) |
2.618(±0.007) |
9.7(±2.0) |
−6.2 |
Pt:Fe 1![[hair space]](https://www.rsc.org/images/entities/char_200a.gif) : :![[hair space]](https://www.rsc.org/images/entities/char_200a.gif) 1 1 |
Pt–Fe |
5.8(±0.2) |
2.661(±0.002) |
9.0(±0.2) |
+3.1 |
0.019 |
| Pt–Pt |
3.8(±0.2) |
2.734(±0.003) |
5.0(±0.2) |
+7.0 |
| Fe–Fe |
0.2(±0.09) |
2.515(±0.044) |
2.0(±0.4) |
+11.0 |
| Fe–Pt |
8.6(±0.4) |
2.661(±0.004) |
9.1(±0.5) |
−2.1 |
Pt:Fe 3![[hair space]](https://www.rsc.org/images/entities/char_200a.gif) : :![[hair space]](https://www.rsc.org/images/entities/char_200a.gif) 1 1 |
Pt–Fe |
1.6(±0.1) |
2.661(±0.004) |
4.7(±0.6) |
−6.5 |
0.017 |
| Pt–Pt |
9.8(±0.4) |
2.733(±0.002) |
7.9(±0.3) |
−2.2 |
| Fe–Fe |
0.9(±0.3) |
2.512(±0.025) |
12.0(±0.1) |
−4.9 |
| Fe–Pt |
8.1(±0.5) |
2.661(±0.004) |
6.8(±0.4) |
−5.3 |
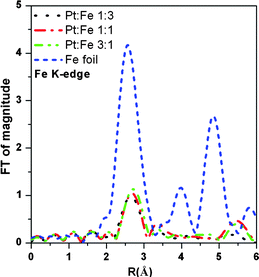 |
| | Fig. 2 Fourier transform magnitudes of k2χ(k) Fe K-edge EXAFS spectra for the home-made 30 wt% PtxFe1−x/C bimetallic nanoparticles with various Pt-to-Fe ratios and reference Fe foil. | |
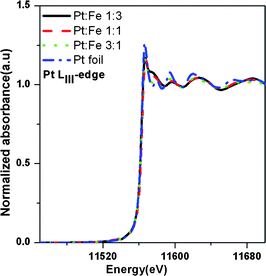
The Pt LIII-edge XANES spectra for the PtxFe1−x/C catalyst nanoparticles with various Pt-to-Fe ratios and reference Pt foil are shown in Fig. 3. The absorption at 11564 eV corresponds to a 2p3/2 to 5d electronic transition which results, at the threshold, in a sharp peak known as white line. The integrated intensity of the white line is related to the 5d electron vacancies.58–60 A close examination of the absorption white lines shown in the Fig. 3 reveals a very small reduction in the white line intensity in the case of the PtxFe1−x/C catalyst nanoparticles compared to the reference Pt foil. The variations in the Pt white line intensity can be attributed to the generation of more electronic hybrid states with Pt 5d electronic states, as a result of the alloying of Fe with Pt metal. The magnitude of the FT module related to the first shell coordination increases with an increase in Pt content in the catalyst, as shown in Fig. 4. Detailed best-fit results and structural parameters are listed in Table 1. As can be seen from Fig. 4, comparison of the FT peak of the PtxFe1−x/C catalyst nanoparticles appearing between 2 and 3 Å with the reference Pt FT peak shows that Pt atoms are not the only constituents of the environment around Pt in the bimetallic nanoparticles. The peak splitting in the case of bimetallic nanoparticles is an indication that the first shell coordination comprises two types of backscattering atoms. The structural parameters derived from the Fe K-edge and Pt LIII edge EXAFS spectra are listed in Table 1.
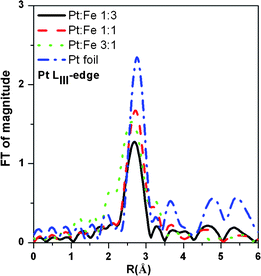 |
| | Fig. 4 Fourier transform magnitudes of k2χ(k) EXAFS spectra at the Pt LIII-edge for the home-made 30 wt% PtxFe1−x/C bimetallic nanoparticles with various Pt-to-Fe ratios and reference Pt foil. | |
To quantify the difference in white line intensity between the home-made PtxFe1−x/C bimetallic nanoparticles and the reference Pt foil, a method modified by Reifsnyder et al.,61,62 which was originally developed by Mansour et al.63 was employed in this work. In general, after subtracting the reference platinum foil data from the catalyst data, the resulting curves were numerically integrated between −10 and +14 eV relative to the absorption edge for both the LII (ΔA2) and LIII (ΔA3) edges to calculate the fractional change in the total number of unfilled d-band states compared to the reference platinum foil (fd) using the following relation [eqn (1)]:
| |
 | (1) |
All the areas (ΔA2, ΔA3, A3r, and A2r) are normalized by multiplying with the X-ray absorption cross section (σ) at the respective edge jump. Values of 117.1 and 54.2 cm2 g−1 were used for the absorption cross-section at the platinum L3 and L2 edges, respectively. The ΔAi (i =2 or 3) values are the normalized areas attributed to electronic transitions to unfilled d-states in the XANES spectra between samples and the reference foil. When the number of unfilled d-states in the reference material (hTr) is known,64 the number of unfilled d-states in the sample (hTs) can be calculated using eqn (2).
The variation in unfilled d-states (hTs) of PtxFe1−x/C bimetallic nanoparticles with various Pt-to-Fe ratios is presented in Fig. 5. As can be seen from Fig. 5, the variations in the unfilled d-states follows the order Pt3Fe1 > Pt1Fe3 > Pt1Fe1. The enhanced hybridization between Fe (3d) and Pt (5d) states and the resulting electron transfer might be responsible for the observed trends in unfilled d-states. It is worth mentioning that the observed trends in Pt unfilled d-states are consistent with the extent of platinum alloying (JPt) in Pt–Fe nanoparticles. The alloying extent of both platinum (JPt) as well as iron (JFe) in Pt–Fe nanoparticles is calculated by the XAS methodology previously reported by our group and will be discussed in the following section.42 The higher JPt value observed in the case of Pt1Fe1/C indicates more alloying of Pt with Fe thereby increased extent of the hybridization of Fe (3d) and Pt (5d) states. It generates fewer unfilled d-states as a result of electron transfer from Fe to Pt.
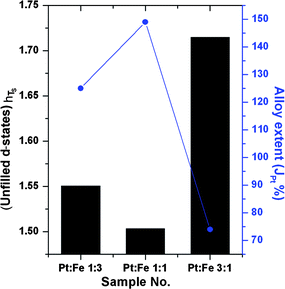 |
| | Fig. 5 The variation in unfilled d-states and extent of platinum alloying in home-made bimetallic PtxFe1−x/C nanoparticles with various Pt-to-Fe ratios. | |
The extent of charge transfer involved in bimetallic PtxFe1−x nanoparticles was estimated by DFT computation. For modeling the Pt(111) surface, we have adopted slabs containing three layers with four atoms per layer as shown in Fig. 6a). The surface is constructed as a slab within the three-dimensional periodic boundary conditions and models are separated from their images in the direction perpendicular to the surface by a 14 Å vacuum layer. The bottom layer was kept fixed to the bulk coordinates; full atomic relaxations were allowed for the top two layers. For these calculations, a 3 × 3 × 1 k-point mesh was used in the 3 × 3 super cell. The atoms in the cell were allowed to relax until the forces on unconstrained atoms were less than 0.01 eV Å−1.
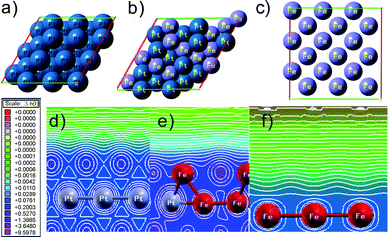 |
| | Fig. 6 The model of a) top-view of Pt(111), b) top-view of Pt14Fe13(111) and c) top-view of Fe(100). Contour plots of d) Pt(111), e) Pt14Fe13(111), and f) Fe(100) slabs, respectively. | |
After geometry relaxation, the mean distances d (Pt–Pt) and d(Pt–Fe) were calculated to be 2.772 Å and 2.742 Å, respectively. The contour maps of Fig. 6d)–f) correspond to slide models of Pt(111), Pt–Fe(111), and Fe(111), respectively. Fig. 6e) depicts the electron density contour of the plane cut through the Pt atom and Fe atom at the center site. In this contour we can clearly see the difference between the orbitals of the Pt atom and Fe atom. Thus, the electron donation is an important factor which influences the binding energy of gaseous molecule (i.e. CO or O2) being adsorbed on a Pt–Fe surface. Here, charge transfer took place between Pt and Fe atoms. Meanwhile, as shown in Table 2 the charge on the Pt atom in Pt–Fe(111) is increased to 10.484 e. Thus, the charge transferred from the Fe to Pt is 0.442 e. We find that the Fe atom donates charge to the Pt atom. In the Pt–Fe(111) case, significant change in the charge and bond distance of Pt–Fe is observed. From our results, the extent of charge transfer is dependent on the magnitude of alloying in bimetallic nanoparticles.
Table 2 Bader charger analysis of Pt(111), Pt–Fe(111) and Fe (100) systems
| Species |
Charge/e |
Charge difference/e |
| Pt(111) |
Pt: 10.044 |
— |
| Fe(100) |
Fe: 8.637 |
— |
| Pt14Fe13(111) |
Pt: 10.484 |
Pt: 10.044 − 10.484 = −0.442 |
| Fe: 7.494 |
Fe: 8.637 − 7.494 = +1.143 |
The physical properties of bimetallic PtxFe1−x/C electrocatalysts (Pt![[thin space (1/6-em)]](https://www.rsc.org/images/entities/char_2009.gif) :
:![[thin space (1/6-em)]](https://www.rsc.org/images/entities/char_2009.gif) Fe 1
Fe 1![[thin space (1/6-em)]](https://www.rsc.org/images/entities/char_2009.gif) :
:![[thin space (1/6-em)]](https://www.rsc.org/images/entities/char_2009.gif) 3, 1
3, 1![[thin space (1/6-em)]](https://www.rsc.org/images/entities/char_2009.gif) :
:![[thin space (1/6-em)]](https://www.rsc.org/images/entities/char_2009.gif) 1, and 3
1, and 3![[thin space (1/6-em)]](https://www.rsc.org/images/entities/char_2009.gif) :
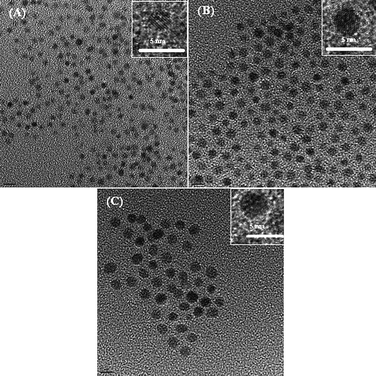
:![[thin space (1/6-em)]](https://www.rsc.org/images/entities/char_2009.gif) 1) were determined from the edge-jump measurements of the Fe K-edge and Pt LIII-edge X-ray absorption near edge spectra (XANES), as presented in Table 3. The X-ray diffraction patterns of home-made PtxFe1−x/C electrocatalysts with various Pt-to-Fe ratios are shown in Fig. 7. The peaks corresponding to (111), (200), and (220) appearing at 2θ values of ca. 39.8°, 46.3° and 67.5°, respectively are characteristic peaks corresponding to a face-centered cubic Pt. The characteristic peaks related to iron species were absent in the XRD pattern. Furthermore, the appearance of Pt reflections with a positive shift relative to crystalline Pt according to XRD standard JCPDS No. 87-0646 in home-made catalysts indicates that iron atoms have been incorporated. The average grain size associated with the catalysts is calculated using Scherrer's equation considering the full-width at half-maximum of peak (220) and is listed in Table 3. The average grain size of Pt1Fe3/C is only 2.4 nm and grain sizes of Pt1Fe1/C and Pt3Fe1/C are found to be 3.0 and 4.1 nm, respectively. Fig. 8 presents the typical transmission electron microscopic (TEM) images of the home-made PtxFe1−x catalysts without carbon support and the results are also listed in Table 3. The corresponding high-resolution TEM images of these catalysts are shown as insets. As can be seen, For the Pt1Fe1 catalyst, the derived mean particle size is about 2–3 nm with a relatively narrow size distribution. The particle size is found to be larger, ca. 3–4 nm for catalysts containing higher Pt content, i.e. Pt–Fe (3
1) were determined from the edge-jump measurements of the Fe K-edge and Pt LIII-edge X-ray absorption near edge spectra (XANES), as presented in Table 3. The X-ray diffraction patterns of home-made PtxFe1−x/C electrocatalysts with various Pt-to-Fe ratios are shown in Fig. 7. The peaks corresponding to (111), (200), and (220) appearing at 2θ values of ca. 39.8°, 46.3° and 67.5°, respectively are characteristic peaks corresponding to a face-centered cubic Pt. The characteristic peaks related to iron species were absent in the XRD pattern. Furthermore, the appearance of Pt reflections with a positive shift relative to crystalline Pt according to XRD standard JCPDS No. 87-0646 in home-made catalysts indicates that iron atoms have been incorporated. The average grain size associated with the catalysts is calculated using Scherrer's equation considering the full-width at half-maximum of peak (220) and is listed in Table 3. The average grain size of Pt1Fe3/C is only 2.4 nm and grain sizes of Pt1Fe1/C and Pt3Fe1/C are found to be 3.0 and 4.1 nm, respectively. Fig. 8 presents the typical transmission electron microscopic (TEM) images of the home-made PtxFe1−x catalysts without carbon support and the results are also listed in Table 3. The corresponding high-resolution TEM images of these catalysts are shown as insets. As can be seen, For the Pt1Fe1 catalyst, the derived mean particle size is about 2–3 nm with a relatively narrow size distribution. The particle size is found to be larger, ca. 3–4 nm for catalysts containing higher Pt content, i.e. Pt–Fe (3![[thin space (1/6-em)]](https://www.rsc.org/images/entities/char_2009.gif) :
:![[thin space (1/6-em)]](https://www.rsc.org/images/entities/char_2009.gif) 1). When PtxFe1−x/C nanoparticles are annealed in order to improve the chemical bonding with carbon, no change in particle size is observed. Furthermore, all the Pt–Fe nanoparticles are well dispersed on the carbon support. The particle size variations derived from TEM images are in good agreement with the XRD measurements.
1). When PtxFe1−x/C nanoparticles are annealed in order to improve the chemical bonding with carbon, no change in particle size is observed. Furthermore, all the Pt–Fe nanoparticles are well dispersed on the carbon support. The particle size variations derived from TEM images are in good agreement with the XRD measurements.
Table 3 Composition and grain size of the commercial E-TEK Pt/C and home-made PtxFe1−x/C nanoparticles prepared by the chemical reduction method
| Catalyst |
Pt![[thin space (1/6-em)]](https://www.rsc.org/images/entities/char_2009.gif) : :![[thin space (1/6-em)]](https://www.rsc.org/images/entities/char_2009.gif) Fea Fea |
Grain sizeb/nm from XRD |
Particle size/nm from TEM |
| determined by the edge jump of the Fe K-edge and Pt LIII-edge XANES spectra. grain size derived from XRD based on the Pt (220) peak. |
| 20% Pt/C (E-TEK) |
— |
1.8 |
2–3 |
| Pt1Fe3/C |
38![[thin space (1/6-em)]](https://www.rsc.org/images/entities/char_2009.gif) : :![[thin space (1/6-em)]](https://www.rsc.org/images/entities/char_2009.gif) 62 62 |
2.4 |
2–3 |
| Pt1Fe1/C |
60![[thin space (1/6-em)]](https://www.rsc.org/images/entities/char_2009.gif) : :![[thin space (1/6-em)]](https://www.rsc.org/images/entities/char_2009.gif) 40 40 |
3.0 |
2–3 |
| Pt3Fe1/C |
82![[thin space (1/6-em)]](https://www.rsc.org/images/entities/char_2009.gif) : :![[thin space (1/6-em)]](https://www.rsc.org/images/entities/char_2009.gif) 18 18 |
4.1 |
3–4 |
Recently, we explored X-ray absorption spectroscopy (XAS) methodologies for the quantitative characterization of the structure of bimetallic nanoparticles. The atomic structures and atomic distribution of home-made PtxFe1−x/C bimetallic nanoparticles are derived from the experimentally obtained XAS structural parameters. The alloying extent of platinum (JPt) as well as iron (JFe) can also be also calculated from the XAS structural parameters. These structural parameters are not only helpful to distinguish random and non-random alloying of Pt and Fe atoms in a Pt–Fe cluster, but also give information about the extent of Pt and Fe atomic distributions in nanoparticles. The calculation of JPt and JFe of PtxFe1−x/C bimetallic nanoparticles involves, obtaining the ratio of the scattering atoms’ “Fe” coordination number around absorbing “Pt” atoms (NPt–Fe) to the total coordination number of absorbing platinum atoms (ΣNPt–i = NPt–Fe + NPt–Pt) denoted as Pobserved (= NPt–Fe/ΣNPt–i). The Pobserved provides information on the probability of Pt bonds with Fe atom and serves as an index to Pt atomic distribution in a Pt–Fe cluster. Similarly, the ratio of the scattering atoms’ “Pt” coordination number around absorbing “Fe” atoms (NFe–Pt) to the total coordination number of absorbing iron atoms (ΣNFe–i = NFe–Pt + NFe–Fe) denoted as Robserved (= NFe–Pt/ΣNFe–i). The Robserved provides information on the Fe atomic distribution in a Pt–Fe cluster. Once Pobserved and Robserved values are determined from the XAS coordination number parameters, the JPt and JFe values can be estimated by using eqns (3) and (4), respectively. The alloying extent can be related to the degree of heterogeneous bonding (Pt–Fe bonding) in the bimetallic Pt–Fe samples. It means that the interaction between Pt and Fe, which can facilitate a bi-functional mechanism, will increase with an increase in the alloying extent of platinum. Therefore, the catalytic activity for the ORR would be higher for a sample with a higher Pt alloying extent
| | |
JPt = Pobserved/Prandom × 100
| (3) |
| | |
JFe = Robserved/Rrandom × 100
| (4) |
where
Prandom and
Rrandom can be calculated from the atomic ratio of Pt to Fe in a Pt–Fe
nanoparticle. In extracting the coordination numbers the heterometallic coordination numbers are constrained using
eqn (5).
| | |
NPt–Fe = (XFe / XPt) × NFe–Pt
| (5) |
where
XM is the molar ratio of the metal Pt or Fe. The coordination numbers and the alloying extent of Pt and Fe estimated from the Pt L
III-edge and Fe K-edge XAS structural parameters are listed in
Table 4. For all the home-made Pt
xFe
1−x/C
nanoparticles with various Pt-to-Fe ratios the total coordination number parameter relationship of Σ
NPt–i > Σ
NFe–i, indicate that Fe atoms are segregated to the surface of the
nanoparticle and Pt atoms to the core resulting in a Pt-rich core–Fe-rich shell structure. Among the three home-made Pt
xFe
1−x/C
bimetallic nanoparticles,
i.e. Pt
1Fe
1, Pt
1Fe
3 and Pt
3Fe
1, the Pt
1Fe
1 catalyst has the higher
JPt and
JFe values indicating a higher extent of Pt and Fe alloying in this
catalyst. Due to the higher platinum and
iron alloying extent in Pt
1Fe
1 catalyst, it is predicted to have a good
catalytic performance towards the ORR.
Table 4 Coordination numbers and alloying extent of platinum (JPt) and iron (JFe) estimated from the Pt LIII-edge and Fe K-edge XAS structural parameters
| Catalyst |
ΣNPt−i |
P observed |
J Pt (%) |
ΣNFe−i |
R observed |
J Fe (%) |
Pt![[thin space (1/6-em)]](https://www.rsc.org/images/entities/char_2009.gif) : :![[thin space (1/6-em)]](https://www.rsc.org/images/entities/char_2009.gif) Fe 1 Fe 1![[thin space (1/6-em)]](https://www.rsc.org/images/entities/char_2009.gif) : :![[thin space (1/6-em)]](https://www.rsc.org/images/entities/char_2009.gif) 3 3 |
10.2(±1.8) |
0.78(±0.07) |
125(±11) |
6.6(±2.5) |
0.72(±0.26) |
192(±68) |
Pt![[thin space (1/6-em)]](https://www.rsc.org/images/entities/char_2009.gif) : :![[thin space (1/6-em)]](https://www.rsc.org/images/entities/char_2009.gif) Fe 1 Fe 1![[thin space (1/6-em)]](https://www.rsc.org/images/entities/char_2009.gif) : :![[thin space (1/6-em)]](https://www.rsc.org/images/entities/char_2009.gif) 1 1 |
9.7(±0.4) |
0.60(±0.02) |
149(±5) |
8.8(±0.5) |
0.98(±0.05) |
164(±8) |
Pt![[thin space (1/6-em)]](https://www.rsc.org/images/entities/char_2009.gif) : :![[thin space (1/6-em)]](https://www.rsc.org/images/entities/char_2009.gif) Fe 3 Fe 3![[thin space (1/6-em)]](https://www.rsc.org/images/entities/char_2009.gif) : :![[thin space (1/6-em)]](https://www.rsc.org/images/entities/char_2009.gif) 1 1 |
11.4(±0.5) |
0.14(±0.01) |
74(±6) |
9.0(±0.8) |
0.90(±0.06) |
110(±7) |
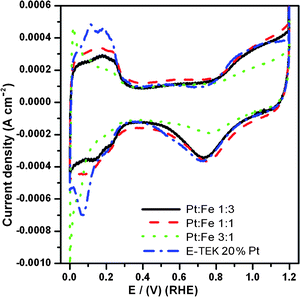
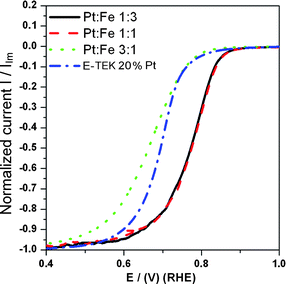
Cyclic voltammograms (CVs) of home-made PtxFe1−x/C bimetallic nanoparticles with various Pt-to-Fe atomic ratios recorded in N2-saturated 0.5 M sulfuric acid electrolyte solutions at a scan rate of 5 m Vs−1 are presented in Fig. 9. Typical features associated with the hydrogen adsorption–desorption and preoxidation–reduction peaks can be clearly seen in the CV scans of all the home-made catalysts. As can be seen from Fig. 9, the onset potential for the Pt oxide formation in the positive-going sweep and the oxide reduction in the negative-going sweep is slightly shifted to more positive potentials for all the PtxFe1−x/C catalysts compared to Pt/C. This observation indicates that the alloying inhibited the chemisorption of oxygenated species such as OHad on the Pt sites at high potential (above 0.8 V) by the change in the Pt electronic structure induced by the addition of Fe. This may be beneficial to facile oxygen adsorption at low potentials, and thus ORR kinetic enhancement.11,65Fig. 10 shows O2 reduction on the Pt/C and home-made PtxFe1−x/C catalysts. In order to facilitate better comparison of the activity, all the currents are normalized to the limit current of the each sample. As shown in Fig. 10, the ORR on all the home-made catalysts is diffusion-controlled when the potential is less than 0.7 V and from 0.7 to 0.85 V it is in the mixed control region of diffusion-kinetics. In the mixed control region (0.7 to 0.85 V) and Tafel region (higher than 0.85 V), the magnitudes of the ORR activities are significantly different. It can be clearly seen in Fig. 10 that all the home-made PtxFe1−x/C catalysts exhibit enhanced ORR activities in the raised portion of the curve compared with the pure E-TEK 20% Pt/C. However, among the home-made PtxFe1−x/C catalysts the ORR activity enhancement order is Pt1Fe1/C > Pt1Fe3/C > Pt3Fe1/C > E-TEK 20% Pt/C. The enhanced ORR performance of Pt1Fe1/C is partially attributed to its comparably higher extent of Pt and Fe alloying, the number of Pt unfilled d-states created by alloying, and the grain size.
The surface-specific activities for the ORR at 0.95 V on all the home-made PtxFe1−x catalysts are compared in Fig. 11. As we know that the surface-specific activity can be taken as an index to asses the applicability of the catalyst towards ORR and it depends on the catalyst composition. The observed tendency in the surface-specific activity values is consistent with our findings of alloying extent and Pt electronic states. Thus, synthetic approaches that can yield small-sized particles with a high degree of alloying and convenient electronic structure raise the possibility of achieving promising ORR electrocatalysts.
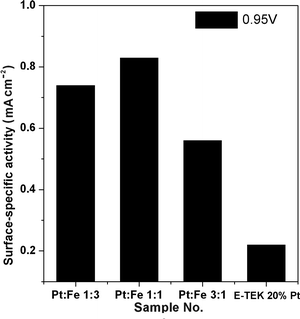 |
| | Fig. 11 Surface-specific activity measured at 0.95 V (vs. RHE) for home-made PtxFe1−x catalysts with various Pt-to-Fe ratios. | |
Conclusions
We have successfully synthesized PtxFe1−x catalysts with various Pt-to-Fe atomic ratios with tunable physical properties by a chemical reduction method. The electronic effect and the variations in alloying extent and Pt d-band vacancies in Pt–Fe/C electrocatalysts have been established by X-ray absorption spectroscopy. Electrochemical analyses provided direct evidence that the alloying extent strongly influences the catalytic activity for the oxygen reduction reaction (ORR). The home-made Pt1Fe1/C catalyst had higher catalytic activity due to the higher alloying extent and proper composition. The unfilled d-state values extracted from Pt LIII- and LII-edge XANES spectra show that Pt1Fe1/C has lower unfilled Pt d-states. Furthermore, DFT computational results revealed that the extent of charge transfer from Fe to Pt is higher in the case of the Pt1Fe1/C catalyst. Increased extent of the hybridization of Fe (3d) and Pt (5d) states as a result of higher alloying extent of Pt and Fe in Pt1Fe1/C catalyst creates fewer unfilled d-states (lower than 1.6) as a result of electron transfer from Fe to Pt. In contrast, in the other two samples, i.e., Pt1Fe3/C, and Pt3Fe1/C the extent of hybridization of Fe (3d) and Pt (5d) states is lower as a result of lower Pt and Fe alloying and provides more unfilled d-states. The most important conclusion of this paper is that controlling the alloying extent of Pt and the second metal represents a promising approach to improve the catalytic activity of Pt–M bimetallic catalyst nanoparticles towards the ORR for fuel cell applications.
Acknowledgements
The authors gratefully acknowledge financial support from the National Science Council (NSC-97-2120-M-011-001 and NSC-97-2221-E-011-075-MY3), and facilities from the National Synchrotron Radiation Research Center (NSRRC), and the National Taiwan University of Science and Technology.
References
- B. C. H. Steele and A. Heinzel, Nature, 2001, 414, 345 CrossRef CAS.
- A. Faur Ghenciu, Curr. Opin. Solid State Mater. Sci., 2002, 6, 389 CrossRef; P. Costamagna and S. Srinivasan, J. Power Sources, 2001, 102, 253 CrossRef CAS.
- P. Costamagna and S. Srinivasan, J. Power Sources, 2001, 102, 242 CrossRef CAS.
- S. Gottesfeld, T. A. Zawodzinski, Polymer electrolyte fuel cells, in Advances in Electrochemical Science and Engineering, ed. D. M. Kolb, C. W. Tobias, R. C. Alkire and H. Gerischer, Wiley-VCH, Weinheim, 1997 vol. 5 Search PubMed.
- R. R. Adzic in Electrocatalysis, ed. J. Lipkowski and P. N. Ross, VCH, New York, 1998, vol. 5, pp. 197 Search PubMed.
- S. Mukerjee, S. Srinivasn and M. P. Soriaga, J. Phys. Chem., 1995, 99, 4577 CrossRef CAS.
- A. S. Aricò, A. K. Shukla, H. Kim, S. Park, M. Min and V. Antonucci, Appl. Surf. Sci., 2001, 172, 33 CrossRef CAS.
- U. A. Paulus, A. Wokaun, G. G. Scherer, T. J. Schmidt, V. Stamenkovic, V. Radmilovic, N. M. Markovic and P. N. Ross, J. Phys. Chem. B, 2002, 106, 4181 CrossRef CAS.
- N. M. Marković, T. J. Schmidt, V. Stamenković and P. N. Ross, Fuel Cells, 2001, 1, 105 CrossRef CAS.
- J. Drillet, A. Ea, R. Friedmann, R. Kotz, B. Schmyder and V. Schmidt, Electrochim. Acta, 2002, 47, 1983 CrossRef CAS.
- S. Mukerjee, S. Srinivasan, M. P. Soriaga and J. McBreen, J. Electrochem. Soc., 1995, 142, 1409 CAS.
- M. Min, J. Cho, K. Cho and H. Kim, Electrochim. Acta, 2000, 45, 4211 CrossRef CAS.
- N. Neergat, A. K. Shukla and K. S. Gandhi, J. Appl. Electrochem., 2001, 31, 373 CrossRef CAS.
- M. T. Paffett, J. G. Barry and S. Gottesfeld, J. Electrochem. Soc., 1988, 135, 1431 CrossRef CAS.
- E. Antolini, R. R. Passos and E. A. Ticianelli, Electrochim. Acta, 2002, 48, 263 CrossRef CAS.
- T. Toda, H. Igarashi and M. Watanabe, J. Electrochem. Soc., 1999, 146, 3750 CrossRef CAS.
- J. Tae Hwang and J. S. Chung, Electrochim. Acta, 1993, 38, 2715 CrossRef.
- B. C. Beard and P. N. Ross Jr., Electrochim. Acta, 1990, 137, 336.
- L. Xiao, L. Zhuang, Y. Liu, J. Lu and H. D. Abruña, J. Am. Chem. Soc., 2009, 131, 602 CrossRef CAS.
- L.-L. Wang and D. D. Johnson, J. Am. Chem. Soc., 2007, 129, 3658 CrossRef CAS.
- J. Zhang, K. Sasaki, E. Sutter and R. R. Adzic, Science, 2007, 315, 220 CrossRef CAS.
- H. Ye and R. M. Crooks, J. Am. Chem. Soc., 2005, 127, 4930 CrossRef CAS.
- Y.-T. Kim, K. Ohshima, K. Higashimine, T. Uruga, M. Takata, H. Suemasu and T. Mitari, Angew. Chem., Int. Ed., 2006, 45, 407 CrossRef CAS.
- V. R. Stamenkovic, B. S. Mun, M. Arenz, K. J. J. Mayrhofer, C. A. Lucas, G. F. Wang, P. N. Ross and N. M. Markovic, Nat. Mater., 2007, 6, 241 CrossRef CAS.
- V. R. Stamenkovic, B. S. Mun, K. J. J. Mayrhofer, P. N. Ross and N. M. Markovic, J. Am. Chem. Soc., 2006, 128, 8813 CrossRef CAS.
- J. Zhang, M. B. Vukmirovic, Y. Xu, M. Mavrikakis and R. R. Adzic, Angew. Chem. Int. Ed, 2005, 44, 2.
- J. Zhang, M. B. Vukmirovic, K. Sasaki, A. V. Nilekar, M. Mavrikakis and R. R. Adzic, J. Am. Chem. Soc., 2005, 127, 12480 CrossRef CAS.
- S. Koh and P. Strasser, J. Am. Chem. Soc., 2007, 129, 12624 CrossRef CAS.
- A. B. Anderson, J. Roques, S. Mukerjee, V. S. Murthi, N. M. Markovic and V. Stamenkovic, J. Phys. Chem. B, 2005, 109, 1198 CrossRef CAS.
- V. S. Murthi, R. C. Urian and S. Mukerjee, J. Phys. Chem. B, 2004, 108, 11011 CrossRef CAS.
- W. Chen, J. Kim, S. Sun and S. Chen, J. Phys. Chem. C, 2008, 112, 3891 CrossRef CAS.
- Z. A. Sun and C. C. Tseung, Electrochem. Solid-State Lett., 1999, 3, 413 CrossRef.
- Y. Xu, A. V. Ruban and M. Mavrikakis, J. Am. Chem. Soc., 2004, 126, 4717 CrossRef CAS.
- C. H. Chen, L. S. Sarma, J. M. Chen, S. C. Shih, G. R. Wang, D. G. Liu, M. T. Tang, J. F. Lee and B. J. Hwang, ACS Nano, 2007, 1, 114 CrossRef CAS.
- I. Srnová-Šloufová, F. Lednický, A. Gemperle and J. Gemperlová, Langmuir, 2000, 16, 9928 CrossRef CAS.
- Y. H. Chen and U. Nickel, J. Chem. Soc., Faraday Trans., 1993, 89, 2479 RSC.
- G. Schmid, Clusters and Colloids; VCH: Weinheim, Germany, 1994 Search PubMed.
- S. Link, Z. L. Wang and M. A. El-Sayed, J. Phys. Chem. B, 1999, 103, 3529 CrossRef CAS.
- Y. Waseda, Novel Application of Anomalous X-ray Scattering for Structural Characterization of Disordered Material, Springer-Verlag, New York, 1984 Search PubMed.
- D. Bazin and D. Sayers, Jpn. J. Appl. Phys. Suppl., 1993, 32, 252 CrossRef CAS.
- T. Shido and R. Prins, Curr. Opin. Solid State Mater. Sci., 1998, 3, 330 CrossRef CAS.
- B. J. Hwang, L. S Sarma, J. M. Chen, C. H. Chen, S. C. Shih, G. R. Wang, D. G. Liu, J. F. Lee and M. T. Tang, J. Am. Chem. Soc., 2005, 127, 11140 CrossRef CAS.
-
(a) See, for example, the guidelines for data collection modes for EXAFS measurements anduser-controlled parameters: http://www.i-x-s.org/OLD/subcommittee_reports/sc/SC00report.pdf;
(b) See, for example, the guidelines for error reporting:http://www.i-x-s.org/OLD/subcommittee_reports/sc/err-rep.pdf.
- E. A. Stern, M. Newville, B. Ravel, Y. Yacoby and D. Haskel, Phys. B, 1995, 208–209, 117 CrossRef.
- S. I. Zabinsky, J. J. Rehr, A. Ankudinov, R. C. Albers and M. J. Eller, Phys. Rev. B: Condens. Matter, 1995, 52, 2995 CrossRef CAS.
- D. Vanderbilt, Phys. Rev. B: Condens. Matter, 1990, 41, 7892 CrossRef.
- P. E. Blöchl, Phys. Rev. B: Condens. Matter, 1994, 50, 17953 CrossRef.
- M. C. Payne, M. P. Teter, D. C. Allan, T. A. Arias and J. D. Joannopoulos, Rev. Mod. Phys., 1992, 64, 1045 CrossRef CAS.
- G. Kresse and D. Joubert, Phys. Rev. B: Condens. Matter Mater. Phys., 1999, 59, 1758 CrossRef CAS.
- P. Hu, D. A. King, S. Crampin, M. H. Lee and M. C. Payne, Chem. Phys. Lett., 1994, 230, 501 CrossRef CAS.
- J. P. Perdew, J. A. Chevary, S. H. Vosko, K. A. Jackson, M. R. Pederson, D. J. Singh and C. Fiolhais, Phys. Rev. B: Condens. Matter, 1992, 46, 6671 CrossRef CAS.
- J. P. Perdew, Electronic Structure in Solids' 91, ed. P. Ziesche, H. Eschrig, Berlin, Akademie Verlag, 1991 Search PubMed.
- G. Kresse and J. Hafner, Phys. Rev. B: Condens. Matter, 1993, 47, 558 CrossRef CAS.
- G. Kresse and J. Furthmuller, Phys. Rev. B: Condens. Matter, 1996, 54, 11169 CrossRef CAS.
- G. Kresse and J. Furthmuller, Comput. Mater. Sci., 1996, 6, 15 CrossRef CAS.
- B. J. Hwang, Y. W. Tsai, L. S. Sarma, C. H. Chen, J. F. Lee and H. H. Strehblow, J. Phys. Chem. B, 2004, 108, 15096 CrossRef CAS.
- B. J. Hwang, S. M. Kumar, C. H. Chen, Monalisa, M. Y. Cheng, D. G. Liu and J. F. Lee, J. Phys. Chem. C, 2007, 111, 15267 CrossRef CAS.
- J. A. Horsley, J. Chem. Phys., 1982, 76, 1451 CrossRef CAS.
- Y. W. Tsai, Y. L. Tseng, L. S. Sarma, D. G. Liu, J. F. Lee and B. J. Hwang, J. Phys. Chem. B, 2004, 108, 8148 CrossRef CAS.
- A. E. Russell and A. Rose, Chem. Rev., 2004, 104, 4613 CrossRef CAS.
- S. N. Reifsnyder, M. M. Otten, D. E. Sayers and H. H. Lamb, J. Phys. Chem. B, 1997, 101, 4972 CrossRef CAS.
- J. M. Ramallo-López, G. E. Santori, L. Giovanetti, M. L. Casella, O. A. Ferretti and F. G. Requejo, J. Phys. Chem. B, 2003, 107, 11441 CrossRef CAS.
- A. N. Mansour, J. W. Cook and D. E. Sayers, J. Phys. Chem., 1984, 88, 2330 CrossRef CAS.
- A. V. Ankudinov, A. I. Nesvizhskii and J. Rehr, J. Synchrotron Radiat., 2001, 8, 92 CrossRef CAS.
- Y. Suo, L. Zhuang and J. Liu, Angew. Chem., Int. Ed., 2007, 46, 2862 CrossRef CAS.
|
| This journal is © The Royal Society of Chemistry 2010 |
Click here to see how this site uses Cookies. View our privacy policy here. ![[thin space (1/6-em)]](https://www.rsc.org/images/entities/char_2009.gif) :
:![[thin space (1/6-em)]](https://www.rsc.org/images/entities/char_2009.gif) Fe atomic compositions (3
Fe atomic compositions (3![[thin space (1/6-em)]](https://www.rsc.org/images/entities/char_2009.gif) :
:![[thin space (1/6-em)]](https://www.rsc.org/images/entities/char_2009.gif) 1, 1
1, 1![[thin space (1/6-em)]](https://www.rsc.org/images/entities/char_2009.gif) :
:![[thin space (1/6-em)]](https://www.rsc.org/images/entities/char_2009.gif) 1, and 1
1, and 1![[thin space (1/6-em)]](https://www.rsc.org/images/entities/char_2009.gif) :
:![[thin space (1/6-em)]](https://www.rsc.org/images/entities/char_2009.gif) 3) revealed that the Pt1Fe1/C nanocatalyst showed a greater enhancement in ORR activity than platinum. The enhanced catalytic activity toward ORR is attributed to the higher alloying extent of platinum and iron as well as the promising electronic structure offered by the lower unfilled Pt d states in PtxFe1−x nanoparticles when compared to pure Pt.
3) revealed that the Pt1Fe1/C nanocatalyst showed a greater enhancement in ORR activity than platinum. The enhanced catalytic activity toward ORR is attributed to the higher alloying extent of platinum and iron as well as the promising electronic structure offered by the lower unfilled Pt d states in PtxFe1−x nanoparticles when compared to pure Pt.![[thin space (1/6-em)]](https://www.rsc.org/images/entities/char_2009.gif) :
:![[thin space (1/6-em)]](https://www.rsc.org/images/entities/char_2009.gif) 1, 1
1, 1![[thin space (1/6-em)]](https://www.rsc.org/images/entities/char_2009.gif) :
:![[thin space (1/6-em)]](https://www.rsc.org/images/entities/char_2009.gif) 1 and 1
1 and 1![[thin space (1/6-em)]](https://www.rsc.org/images/entities/char_2009.gif) :
:![[thin space (1/6-em)]](https://www.rsc.org/images/entities/char_2009.gif) 3 were synthesized by a chemical reduction method. In a typical process, an appropriate amount of Pt(acac)2, 1,2-hexadecanediol (0.75 mmol) and 10 mL of dioctyl ether were added to a three-necked reaction flask. The solution temperature was raised to 100 °C and maintained for about 15 min. While vigorously stirring the reaction mixture, oleylamine (0.25 mmol), oleic acid (0.25 mmol), and an appropriate amount of Fe(CO)5 were injected by a syringe into the solution. Before the addition, the mixture of oleylamine, oleic acid, and Fe(CO)5 was heated to the boiling point of dioctyl ether, i.e. to 300 °C. After the addition, the whole reaction mixture was refluxed for 30 min. Later, the reaction mixture was cooled down to room temperature. The product was then precipitated out by washing with a mixture of 20 mL of ethanol, followed by centrifugation and drying. Finally, 80 mg of carbon black (Vulcan-XC72R) was mixed with 20 mg of PtxFe1−x. The carbon-supported PtxFe1−x/C nanoparticles were thermally treated at 300 °C for 1 h in a 10% H2 atmosphere.
3 were synthesized by a chemical reduction method. In a typical process, an appropriate amount of Pt(acac)2, 1,2-hexadecanediol (0.75 mmol) and 10 mL of dioctyl ether were added to a three-necked reaction flask. The solution temperature was raised to 100 °C and maintained for about 15 min. While vigorously stirring the reaction mixture, oleylamine (0.25 mmol), oleic acid (0.25 mmol), and an appropriate amount of Fe(CO)5 were injected by a syringe into the solution. Before the addition, the mixture of oleylamine, oleic acid, and Fe(CO)5 was heated to the boiling point of dioctyl ether, i.e. to 300 °C. After the addition, the whole reaction mixture was refluxed for 30 min. Later, the reaction mixture was cooled down to room temperature. The product was then precipitated out by washing with a mixture of 20 mL of ethanol, followed by centrifugation and drying. Finally, 80 mg of carbon black (Vulcan-XC72R) was mixed with 20 mg of PtxFe1−x. The carbon-supported PtxFe1−x/C nanoparticles were thermally treated at 300 °C for 1 h in a 10% H2 atmosphere.
![[hair space]](https://www.rsc.org/images/entities/char_200a.gif) :
:![[hair space]](https://www.rsc.org/images/entities/char_200a.gif) 3
3![[hair space]](https://www.rsc.org/images/entities/char_200a.gif) :
:![[hair space]](https://www.rsc.org/images/entities/char_200a.gif) 1
1![[hair space]](https://www.rsc.org/images/entities/char_200a.gif) :
:![[hair space]](https://www.rsc.org/images/entities/char_200a.gif) 1
1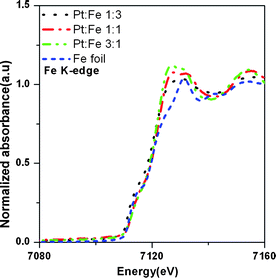



![[thin space (1/6-em)]](https://www.rsc.org/images/entities/char_2009.gif) :
:![[thin space (1/6-em)]](https://www.rsc.org/images/entities/char_2009.gif) Fe 1
Fe 1![[thin space (1/6-em)]](https://www.rsc.org/images/entities/char_2009.gif) :
:![[thin space (1/6-em)]](https://www.rsc.org/images/entities/char_2009.gif) 3, 1
3, 1![[thin space (1/6-em)]](https://www.rsc.org/images/entities/char_2009.gif) :
:![[thin space (1/6-em)]](https://www.rsc.org/images/entities/char_2009.gif) 1, and 3
1, and 3![[thin space (1/6-em)]](https://www.rsc.org/images/entities/char_2009.gif) :
:![[thin space (1/6-em)]](https://www.rsc.org/images/entities/char_2009.gif) 1) were determined from the edge-jump measurements of the Fe K-edge and Pt LIII-edge X-ray absorption near edge spectra (XANES), as presented in Table 3. The X-ray diffraction patterns of home-made PtxFe1−x/C electrocatalysts with various Pt-to-Fe ratios are shown in Fig. 7. The peaks corresponding to (111), (200), and (220) appearing at 2θ values of ca. 39.8°, 46.3° and 67.5°, respectively are characteristic peaks corresponding to a face-centered cubic Pt. The characteristic peaks related to iron species were absent in the XRD pattern. Furthermore, the appearance of Pt reflections with a positive shift relative to crystalline Pt according to XRD standard JCPDS No. 87-0646 in home-made catalysts indicates that iron atoms have been incorporated. The average grain size associated with the catalysts is calculated using Scherrer's equation considering the full-width at half-maximum of peak (220) and is listed in Table 3. The average grain size of Pt1Fe3/C is only 2.4 nm and grain sizes of Pt1Fe1/C and Pt3Fe1/C are found to be 3.0 and 4.1 nm, respectively. Fig. 8 presents the typical transmission electron microscopic (TEM) images of the home-made PtxFe1−x catalysts without carbon support and the results are also listed in Table 3. The corresponding high-resolution TEM images of these catalysts are shown as insets. As can be seen, For the Pt1Fe1 catalyst, the derived mean particle size is about 2–3 nm with a relatively narrow size distribution. The particle size is found to be larger, ca. 3–4 nm for catalysts containing higher Pt content, i.e. Pt–Fe (3
1) were determined from the edge-jump measurements of the Fe K-edge and Pt LIII-edge X-ray absorption near edge spectra (XANES), as presented in Table 3. The X-ray diffraction patterns of home-made PtxFe1−x/C electrocatalysts with various Pt-to-Fe ratios are shown in Fig. 7. The peaks corresponding to (111), (200), and (220) appearing at 2θ values of ca. 39.8°, 46.3° and 67.5°, respectively are characteristic peaks corresponding to a face-centered cubic Pt. The characteristic peaks related to iron species were absent in the XRD pattern. Furthermore, the appearance of Pt reflections with a positive shift relative to crystalline Pt according to XRD standard JCPDS No. 87-0646 in home-made catalysts indicates that iron atoms have been incorporated. The average grain size associated with the catalysts is calculated using Scherrer's equation considering the full-width at half-maximum of peak (220) and is listed in Table 3. The average grain size of Pt1Fe3/C is only 2.4 nm and grain sizes of Pt1Fe1/C and Pt3Fe1/C are found to be 3.0 and 4.1 nm, respectively. Fig. 8 presents the typical transmission electron microscopic (TEM) images of the home-made PtxFe1−x catalysts without carbon support and the results are also listed in Table 3. The corresponding high-resolution TEM images of these catalysts are shown as insets. As can be seen, For the Pt1Fe1 catalyst, the derived mean particle size is about 2–3 nm with a relatively narrow size distribution. The particle size is found to be larger, ca. 3–4 nm for catalysts containing higher Pt content, i.e. Pt–Fe (3![[thin space (1/6-em)]](https://www.rsc.org/images/entities/char_2009.gif) :
:![[thin space (1/6-em)]](https://www.rsc.org/images/entities/char_2009.gif) 1). When PtxFe1−x/C nanoparticles are annealed in order to improve the chemical bonding with carbon, no change in particle size is observed. Furthermore, all the Pt–Fe nanoparticles are well dispersed on the carbon support. The particle size variations derived from TEM images are in good agreement with the XRD measurements.
1). When PtxFe1−x/C nanoparticles are annealed in order to improve the chemical bonding with carbon, no change in particle size is observed. Furthermore, all the Pt–Fe nanoparticles are well dispersed on the carbon support. The particle size variations derived from TEM images are in good agreement with the XRD measurements.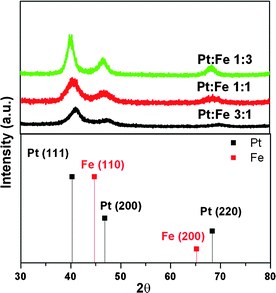
![[thin space (1/6-em)]](https://www.rsc.org/images/entities/char_2009.gif) :
:![[thin space (1/6-em)]](https://www.rsc.org/images/entities/char_2009.gif) Fe 1
Fe 1![[thin space (1/6-em)]](https://www.rsc.org/images/entities/char_2009.gif) :
:![[thin space (1/6-em)]](https://www.rsc.org/images/entities/char_2009.gif) 3
3![[thin space (1/6-em)]](https://www.rsc.org/images/entities/char_2009.gif) :
:![[thin space (1/6-em)]](https://www.rsc.org/images/entities/char_2009.gif) Fe 1
Fe 1![[thin space (1/6-em)]](https://www.rsc.org/images/entities/char_2009.gif) :
:![[thin space (1/6-em)]](https://www.rsc.org/images/entities/char_2009.gif) 1
1![[thin space (1/6-em)]](https://www.rsc.org/images/entities/char_2009.gif) :
:![[thin space (1/6-em)]](https://www.rsc.org/images/entities/char_2009.gif) Fe 3
Fe 3![[thin space (1/6-em)]](https://www.rsc.org/images/entities/char_2009.gif) :
:![[thin space (1/6-em)]](https://www.rsc.org/images/entities/char_2009.gif) 1
1