Field-assisted synthesis of SERS-active silver nanoparticles using conducting polymers†
Ping
Xu
*ab,
Sea-Ho
Jeon
a,
Nathan H.
Mack
a,
Stephen K.
Doorn
a,
Darrick J.
Williams
a,
Xijiang
Han
b and
Hsing-Lin
Wang
*a
aC-PCS, Los Alamos National Laboratory, Los Alamos, NM 87545, USA. E-mail: hwang@lanl.gov
bDepartment of Chemistry, Harbin Institute of Technology, Harbin 150001, China. E-mail: pxu@hit.edu.cn
First published on 4th June 2010
Abstract
A gradient of novel silver nanostructures with widely varying sizes and morphologies is fabricated on a single conducting polyaniline–graphite (P-G) membrane with the assistance of an external electric field. It is believed that the formation of such a silver gradient is a synergetic consequence of the generation of a silver ion concentration gradient along with an electrokinetic flow of silver ions in the field-assisted model, which greatly influences the nucleation and growth mechanism of Ag particles on the P-G membrane. The produced silver dendrites, flowers and microspheres, with sharp edges, intersections and bifurcations, all present strong surface enhanced Raman spectroscopy (SERS) responses toward an organic target molecule, mercaptobenzoic acid (MBA). This facile field-assisted synthesis of Ag nanoparticles via chemical reduction presents an alternative approach to nanomaterial fabrication, which can yield a wide range of unique structures with enhanced optical properties that were previously inaccessible by other synthetic routes.
Introduction
Conducting polymers have been the subject of numerous investigations due to their potential in electronic and optical devices, such as light-emitting diodes, sensors, batteries, and electrochemical supercapacitors.1–7 Specifically, polyaniline (PANI) has emerged as the prime candidate for commercial applications due to its lower price tag, ease of processing and environmental stability.8–10 It has long been recognized that certain metal ions having a reduction potential higher than that of a conducting polymer can be reduced by the conducting polymer to form zero-valent metals.11,12 Recently, we have shown that a variety of experimental parameters, such as dopants, metal ion solution concentration, as well as the structure and composition of the conducting polymer, can profoundly influence the overall shape and size of the electrolessly deposited metal nanostructures.7,13–15 It was also found that platinum and palladium nanostructures chemically deposited on a PANI membrane were highly efficient catalysts for regioselective hydrosilylation reactions and selective hydrogenation of alkynes and cinnamaldehyde.16,17 The palladium nanoparticles supported on polyaniline nanofibers have been used as active catalysts for Suzuki coupling between aryl chlorides and phenylboronic acid, and for phenol formation from aryl halides and potassium hydroxide in water and air.18 It can be imagined that nanocomposites consisting of metal nanostructures and conducting polymers will have even broader applicability in many other areas. One such application involves generating materials with dramatically enhanced surface Raman spectroscopy (SERS) sensitivities to form the basis of a rapid and reliable biological and chemical sensing platform. SERS is widely used to amplify Raman scattering signals of absorbed molecules on a nanostructured metal surface. The origins of this enhancement are primarily due to the strong light-induced electric field, which strongly depends on the roughness/morphology of the metal particles.19 Structures with sharp edges, intersections, and bifurcations typically exhibit extremely strong signal enhancements,20–23 and therefore, construction of metal nanoparticles into well-defined dimensionalities and shapes is of great interest for SERS applications.24–26Here, we introduce the facile synthesis of nanostructured silver gradients with varying morphologies on a PANI-graphite (P-G) membrane with the assistance of an external electric field. In the absence of an electric field, only silver microspheres assembled from smaller silver nanosheets are obtained. A possible mechanism for the generation of such silver nanostructures with different morphologies is also proposed. The deposited silver nanostructure gradient on the P-G membrane can be used as an effective SERS substrate for detecting surface absorbed organic molecules.
Experimental
Materials
Polyaniline (PANI) emeraldine base (EB) powder was obtained from Aldrich. Graphite (99.9% Nanostructured & Amorphous Materials Inc. Los Alamos, NM), N-methyl-2-pyrrolidone (NMP, 99% Aldrich), heptamethyleneimine (HPMI, 98% Acros), AgNO3 (99.9999% Aldrich), citric acid (99.9% Fisher) and mercaptobenzoic acid (MBA, Aldrich 90%) were used as received.Fabrication of P-G membranes
The P-G membranes are produced by employing a phase inversion method using water as the coagulation bath.16,17 Here a 5 wt% mixture of graphite and polyaniline is used as the active material. In a typical experiment, 1.0925 g PANI (EB) powder and 0.0575 g graphite powder were mixed in a 12 ml Teflon vial. Then, 4.14 g NMP and 0.747 g HPMI were added. The mixture was stirred for 0.5–1 h to form a homogeneous solution, followed by being poured onto a glass substrate and spread into a wet film using a gardener's blade (Pompano Beach, FL) with a controlled thickness. The wet film was then immersed into a water bath for 24 h, after which the resulting solid membrane was spontaneously delaminated from the glass substrate. The membrane was then dried at room temperature for 12 h before doping in 0.25 M citric acid for 3 days.Preparation of Ag nanostructures on P-G membrane
For preparation of silver gradients on P-G membrane, a direct current (DC) electric field was firstly applied to the membrane (see the ESI†). Then, one drop of 25 mM AgNO3 solution (1 μL) was deposited on the membrane. One minute later, the membrane was repeatedly rinsed with distilled water to remove silver nitrate residue, followed by air drying for 2 h. To investigate the silver structures produced on P-G membranes without an electric field, a P-G membrane was immersed in an AgNO3 solution of varying concentrations for one minute, then rinsed with distilled water and dried in air.Characterization
Scanning electron microscopic (SEM) images were taken on an FEI Inspect F SEM to study the morphologies of the silver nanoparticles. The elemental composition was analyzed by energy-dispersive X-ray spectroscopy (EDX). X-Ray diffraction (XRD) measurements were carried out on a Rigka Ultima III diffractometer that uses fine line sealed Cu-Kα tube (λ = 1.5406 Å) X-rays. Transmission electron microscopic (TEM) and high resolution TEM (HR-TEM) images were measured on a JEOL 3000F TEM. TEM samples were prepared by scratching the Ag structures off of the PANI membrane onto a carbon-coated copper grid. The metal-supported P-G membrane was immersed in an MBA ethanol solution (3 mg/5 ml) for 15 min and then rinsed in fresh ethanol prior to the surface-enhanced Raman spectroscopy (SERS) measurements. The SERS spectra were recorded on a Kaiser Raman spectrometer through a 20×/0.50 microscope objective, coupled to a liquid nitrogen-cooled charge-coupled device (CCD) detector (wavelength: 785 nm). The incident laser power was kept at 1 mW and total accumulation times of 10 s were employed.Results and discussion
The P-G membrane was fabricated according to a slightly modified literature procedure, where graphite was added to the PANI powder mixture prior to membrane casting in order to enhance its overall electrical conductivity. In a typical silver nanostructure synthesis, a direct current (DC) voltage was first applied to the P-G membrane. Then, 1 μL of 25 mM AgNO3 solution was dropped on to the P-G membrane that had previously been doped with citric acid, where a gradient of silver particles spontaneously formed within 60 s (Fig. 1a). The elemental composition of all the structures was confirmed by energy-dispersive X-ray spectroscopic (EDX) analysis to be pure silver and not silver salt. The XRD pattern of the structures on the P-G membrane further verifies the presence of silver metals, with the diffraction peaks at 2θ = 38.04, 44.20, 64.40, 77.32 and 81.52° corresponding to the (111), (200), (220), (311) and (222) crystal planes, respectively, of face-centered cubic silver (JCPDS 65-2871). The calculated intensity ratio between the (111) and (200) is much higher than that of bulk silver, indicating that these silver structures mainly grow along the [111] crystal plane (see the ESI†). The broad peak centered at 2θ = 24° in the XRD pattern is ascribed to the amorphous polyaniline and graphite in the P-G membrane substrate.15,27,28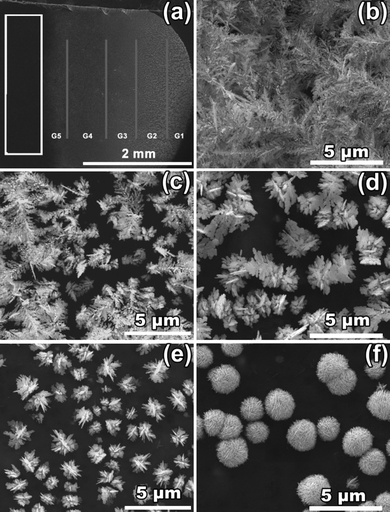 | ||
| Fig. 1 (a) Macroscopic image of Ag gradient produced on a P-G membrane under an electric field of 20 V for 1 min; and magnified SEM images of Ag nanostructures from different parts on the P-G membrane: (b)–(f) correspond to the produced silver structures in regions G1–G5 respectively. | ||
The morphologies of the silver gradients produced on the P-G membrane can be divided into five general areas (G1–G5), where each contains distinct Ag particle morphologies, as shown in a series of scanning electron microscopic (SEM) images (Fig. 1b–f). Structures found on the P-G membrane near the negative electrode (G1) exhibited highly branched, dendritic silver morphologies up to 20 μm in length (Fig. 1b). The branches of the dendritic structures are uniform with a diameter of approximately 100 nm, a stark contrast from silver dendrites prepared via chemical reduction of Ag+ ions by a zinc or copper plate,29,30 and electrochemical deposition on Ni/Cu electrodes at a potential of −2.0 V,31 which have highly branched feather-like structures. Silver structures found slightly further from the negative electrode (G2) consisted of a mixture of shorter dendrite (compared to those at G1) and flower-like silver structures. The silver flowers here have similar features to the dendrites in G1, and presumably act as nucleation sites for their subsequent longer dendrite growth. Moving further from the negative electrode (G3), flower-like structures become dominant, which consist of larger three dimensional assemblies of Ag nanosheets with thicknesses of approximately 70 nm, quite different from those obtained by an electrochemical approach on a Pt film.32 This trend continues with increasing distance from the negative electrode, where uniformly smaller flower-like silver structures are observed (G4). At the opposite side of the P-G membrane, near the positive electrode, there is a region where no silver deposition is observed (white frame in Fig. 1a), presumably due to electrostatic repulsion of Ag ions by the electric field. Interestingly, at the area between Ag deposition and bare PANI surface (G5), silver microspheres are formed, which are comprised of many densely packed 50 nm thick nanosheets. It should be noted that similar silver gradients are formed using a variety of electric field potentials that range from 10 to 100 V (see the ESI†). At voltages higher than 200 V, the P-G membrane breaks down, and voltages lower than 10 V cannot induce the formation of silver gradients.
The transmission electron microscopic (TEM) images of the Ag dendrites, flowers and microspheres are shown in Fig. 2. A high-resolution TEM (HR-TEM) image of the Ag dendrites and the corresponding selected area electron diffraction (SAED) pattern are shown in Fig. 2b, which indicate that the marked area is dominated by single crystalline growth along the [111] crystal plane. Similarly, the HR-TEM image and SAED pattern of the Ag flowers (Fig. 2d) also indicate single crystalline morphologies along the [111] crystal plane. From the TEM image of the Ag microspheres (Fig. 2e), it is apparent that they are comprised of Ag nanosheets, and HR-TEM and SAED analyses of the marked area (Fig. 2f) show favorable growth along the [111] crystal plane. A dihedral angle of 70.1° can be distinguished, which is close to the theoretical value of 70.5°.33 However, at the junction of two Ag nanosheets, the d spacing was measured to be 0.209 nm, close to the theoretical value of [100] d spacing, 0.204 nm. This may explain why even though Ag dendrites, flowers and microspheres are almost exclusively single crystalline along the [111] plane, a minute (200) diffraction peak can still be seen in the XRD pattern.
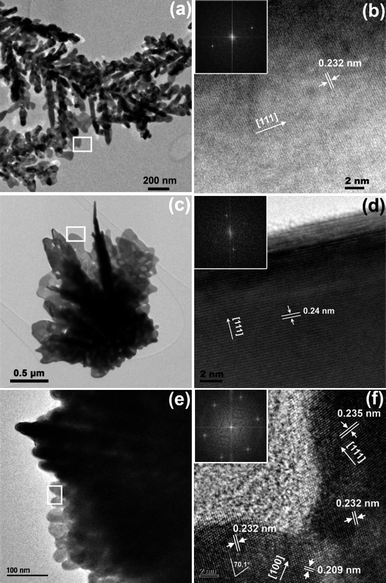 | ||
| Fig. 2 TEM and HR-TEM images of Ag dendrites (a, b), flowers (c, d) and microspheres (e, f). HR-TEM images were taken from the marked area shown in TEM images. Selected area electron diffraction (SAED) patterns are inset in HR-TEM images. | ||
The formation of such silver nanoparticle gradients on the P-G membranes is easily understood as an electrophoretic effect resulting from field driven movement of the Ag+ ions toward the negative electrode. The resulting Ag+ concentration gradient proceeds to have direct impacts on the observed Ag nanostructures. In the absence of graphite loading, no Ag gradients can be formed, as the conductivity of the membrane is so low that no differential electric field can be generated, thus motion of the Ag+ ions cannot be induced. The concentration gradient formed in the presence of an electric field is believed to be responsible for the widely varying growth of nanostructured silver, whose morphology is concentration dependent. However, it was found that the concentration gradient alone does not produce all of the varying silver structures seen in Fig. 1. Simply varying the Ag ion concentration—in the absence of an electric field—tends to yield only Ag microspheres constructed of even finer Ag nanostructures (Fig. 3). Yet, skeleton-like Ag structures were produced when the P-G membrane was immersed in 5 mM AgNO3 aqueous solution, indicating that to some extent, morphological control of Ag structure can be realized by varying the silver ion concentration. Increasing AgNO3 concentration beyond 10 mM results in Ag microspheres composed of finer sheet-like structures. With the increase in the concentration, the size of the microspheres grew larger, with the sheet-like structures becoming finer and more densely packed. Of note, however, is that no concentration-related dendritic growth is observed in these static (non-field driven) conditions. As previously demonstrated, sheet-like structure growth of silver is an intrinsic characteristic of citric acid-doped PANI.13
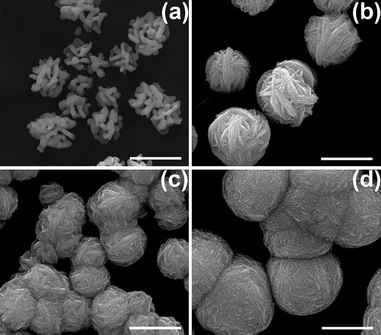 | ||
| Fig. 3 SEM images of Ag structures prepared by immersing the P-G membrane (without applying any electric field) in (a) 5 mM, (b) 10 mM, (c) 25 mM and (d) 100 mM AgNO3 aqueous solution for 1 min. Scale bar: 1 μm. | ||
The above analyses demonstrate the effect of concentration gradient and electrokinetic flow on the formation of nanostructured Ag on a P-G membrane. As schematically illustrated in Fig. 4, we hypothesize that the relative nucleation and growth mechanisms of these Ag structures under static and field driven conditions are dramatically impacted by the movement of Ag+ ions. In the static case, Ag+ ions simply diffuse vertically from the bulk solution down to the membrane surface. Upon interacting with an active nucleation site on the PANI (an electron donor), the Ag+ ion is reduced to form zero-valent Ag (Fig. 4a). Once a metallic nucleation particle is formed, subsequent growth is directed by the diffusion kinetics of the Ag+ ions in the bulk solution. Static growth of Ag on the P-G membrane in this regime results in microspheres with fine sheet-like substructures. Conversely, when an electric field is applied to the P-G membrane, the positively charged Ag+ ions are driven toward the negative electrode, forming a Ag+ ion concentration gradient (Fig. 4b). Here, the motion of Ag+ ions is a combination of a vertical diffusion towards the surface and lateral electrokinetic flow towards the cathode. When these Ag+ ions driven by electrokinetic flow interact with the P-G membrane (or a nucleated Ag particle on the membrane), the lateral movement of Ag ions is believed to alter the growth mechanism of the Ag structures to one that favors unidirectional dendritic growth as compared to static (omnidirectional) growth. These effects are manifested as dramatic changes in the Ag morphology as a function of distance from the cathode, showing a novel approach to Ag nanostructure generation that was previously synthetically inaccessible.
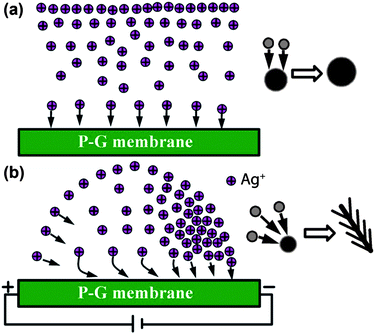 | ||
| Fig. 4 Schematic illustration of the motion behaviors of silver ions toward the P-G membrane surface and the evolution of the silver structures under different conditions: (a) without an external electric field; (b) with a proper external electric field. | ||
The highly branched, dendritic silver structures promise to have numerous SERS applications, as they contain ample features consistent with electromagnetic “hot spots” necessary for efficient SERS excitation. The relative SERS activities of different silver gradient structures were measured from a self-assembled monolayer of mercaptobenzoic acid (MBA) on the metal surface using a 785 nm Raman apparatus in a normal incidence, backscatter configuration. During the measurement, the beam was focused on the Ag structures from different areas through the microscope. MBA is suitable for SERS analysis as it readily adsorbs to Au and Ag surfaces, and has intense benzene ring stretches at 1075 cm−1 and 1580 cm−1, making it readily identifiable in SERS spectra.34 The spectra taken on the various metal morphologies are shown in Fig. 5. MBA has weak electronic interactions with nanostructured silver surfaces and does not absorb at the Raman excitation frequency,21 thus the SERS mechanism mainly results from the electromagnetic enhancement associated with the Ag nanostructured surfaces. Notably, one can see that all three structure regimes (dendrites, flowers, and spheres) exhibit relatively strong SERS signals. Ag dendrites and flowers have a relatively stronger SERS response as compared to that of the microspheres, presumably due to the differences in morphology and relative surface areas.35,36 These data are consistent with a previous report where Au nanoflowers exhibit strong SERS responses, attributed to the substantially enhanced local electromagnetic fields generated by their unique surface topography.37 We believe strongly overlapping electric fields are present in these interstitial sites of Ag flowers and dendrites, which result in “hot spots” along with corresponding intense SERS activity.38 For the densely packed Ag microspheres, the nanocavities formed between the neighboring nanosheet structures may support electromagnetic enhancements; however, the densely packed structure also reduces the total surface area accessible to the adsorbed molecules, thereby limiting the number of SERS-active molecules (self-assembled monolayer) on the metal surface, resulting in a relatively weaker SERS response. Here, the Ag nanostructures fabricated on P-G membranes by the field-assisted approach show comparable SERS effect to some reported Ag films.39,40
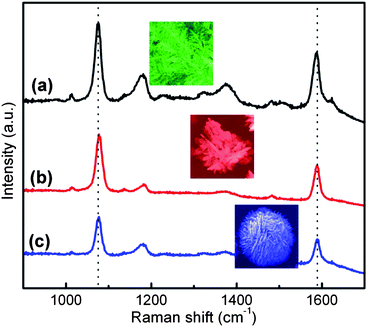 | ||
| Fig. 5 SERS spectra of mercaptobenzoic acid (MBA) absorbed on (a) silver dendrites, (b) silver flowers and (c) silver microspheres. | ||
Conclusions
In summary, we have demonstrated a field-assisted fabrication method capable of preparing a wide range of nanostructured silver on conducting polyaniline–graphite (P-G) membranes with various sizes and morphologies. In the absence of an external electric field, only silver microspheres that consist of densely packed nanosheets are obtained. Our electric field-assisted model suggests that the generation of a Ag+ concentration gradient along with an electrokinetic flow of Ag+ ions dramatically impacts the nucleation and growth of Ag particles on the P-G membrane and leads to a wide range of Ag nanostructures that are not readily available via other synthetic routes. Silver dendrites, flowers and microspheres present morphologies consistent with electromagnetic “hot spots”, resulting in strong SERS responses. This work demonstrates the feasibility of using Ag nanoparticle-decorated P-G membranes as highly efficient SERS substrates via an extremely facile fabrication methodology. The field-assisted synthesis of Ag nanoparticles presents an alternative approach to nanomaterial fabrication, which yields a wide range of unique structures with enhanced optical properties that were previous inaccessible.Acknowledgements
PX thanks the support from the Joint Educational Ph.D. Program of the Chinese Scholarship Council (CSC) and NSFC (No. 20776032). HLW acknowledges the financial support from Laboratory Directed Research and Development (LDRD) fund under the auspices of DOE, BES Office of Science, and the National Nanotechnology Enterprise Development Center (NNEDC). This work was performed in part at the Center for Integrated Nanotechnologies (CINT), at Los Alamos National Laboratory (Contract DE-AC52-06NA25396) and Sandia National Laboratories (Contract DE-AC04-94AL85000).Notes and references
- J. Huang, S. Virji, B. H. Weiller and R. B. Kaner, J. Am. Chem. Soc., 2003, 125, 314 CrossRef CAS.
- W. Li and H. L. Wang, J. Am. Chem. Soc., 2004, 126, 2278 CrossRef CAS.
- X. Zhang, W. J. Goux and S. K. Manohar, J. Am. Chem. Soc., 2004, 126, 4502 CrossRef CAS.
- J. X. Huang and R. B. Kaner, Nat. Mater., 2004, 3, 783 CrossRef.
- S. K. Pillalamarri, F. D. Blum, A. T. Tokuhiro and M. F. Bertino, Chem. Mater., 2005, 17, 5941 CrossRef CAS.
- N. R. Chiou, L. J. Lee and A. J. Epstein, Chem. Mater., 2007, 19, 3589 CrossRef CAS.
- P. Xu, X. Han, B. Zhang, N. H. Mack, S.-H. Jeon and H.-L. Wang, Polymer, 2009, 50, 2624 CrossRef CAS.
- A. J. Heeger, Synth. Met., 2001, 125, 23 CrossRef.
- P. Xu, X. Han, J. Jiang, X. Wang, X. Li and A. Wen, J. Phys. Chem. C, 2007, 111, 12603 CrossRef CAS.
- C. M. S. Izumi, G. F. S. Andreade and M. L. A. Temperini, J. Phys. Chem. B, 2008, 112, 16334 CrossRef CAS.
- W. S. Huang, M. Angelopoulos, J. R. White and J. M. Park, Mol. Cryst. Liq. Cryst., 1990, 189, 227 CAS.
- Y. P. Ting, K. G. Neoh, E. T. Kang and K. L. Tan, J. Chem. Technol. Biotechnol., 1994, 59, 31 CAS.
- H.-L. Wang, W. Li, Q. X. Jia and E. Akhadov, Chem. Mater., 2007, 19, 520 CrossRef CAS.
- W. Li, Q. X. Jia and H.-L. Wang, Polymer, 2006, 47, 23 CrossRef CAS.
- P. Xu, X. Han, C. Wang, B. Zhang, X. Wang and H.-L. Wang, Macromol. Rapid Commun., 2008, 29, 1392 CrossRef CAS.
- H.-H. Shih, D. Williams, N. H. Mack and H.-L. Wang, Macromolecules, 2009, 42, 14 CrossRef CAS.
- Y. Gao, C.-A. Chen, H.-M. Gau, J. A. Bailey, E. Akhadov, D. Williams and H.-L. Wang, Chem. Mater., 2008, 20, 2839 CrossRef CAS.
- B. J. Gallon, R. W. Kojima, R. B. Kaner and P. L. Diaconescu, Angew. Chem., Int. Ed., 2007, 46, 7251 CrossRef CAS.
- K. Kneipp, H. Kneipp, I. Itzkan, R. R. Dasari and M. S. Feld, Chem. Rev., 1999, 99, 2957 CrossRef CAS.
- K. Kneipp, H. Kneipp and J. Kneipp, Acc. Chem. Res., 2006, 39, 443 CrossRef CAS.
- Y. Fang, N.-H. Seong and D. D. Dlott, Science, 2008, 321, 388 CrossRef CAS.
- L. Fabris, M. Dante, T.-Q. Nguyen, J. B.-H. Tok and G. C. Bazan, Adv. Funct. Mater., 2008, 18, 2518 CrossRef CAS.
- I. Yoon, T. Kang, W. Choi, J. Kim, Y. Yoo, S.-W. Joo, Q.-H. Park, H. Ihee and B. Kim, J. Am. Chem. Soc., 2009, 131, 758 CrossRef CAS.
- E. Katz and I. Willner, Angew. Chem., Int. Ed., 2004, 43, 6042 CrossRef CAS.
- A. Courty, A.-I. Henry, N. Goubet and M.-P. Pileni, Nat. Mater., 2007, 6, 900 CrossRef CAS.
- M. Linh Tran, S. P. Centeno, J. A. Hutchison, H. Engelkamp, D. Liang, G. Van Tendeloo, B. F. Sels, J. Hofkens and H. Uji-i, J. Am. Chem. Soc., 2008, 130, 17240 CrossRef CAS.
- P. Xu, X. Han, C. Wang, D. Zhou, Z. Lv, A. Wen, X. Wang and B. Zhang, J. Phys. Chem. B, 2008, 112, 10443 CrossRef CAS.
- P. Xu, X. Han, C. Wang, H. Zhao, J. Wang, X. Wang and B. Zhang, J. Phys. Chem. B, 2008, 112, 2775 CrossRef CAS.
- J. Fang, H. You, P. Kong, Y. Yi, X. Song and B. Ding, Cryst. Growth Des., 2007, 7, 864 CrossRef CAS.
- W. Song, Y. Cheng, H. Jia, W. Xu and B. Zhao, J. Colloid Interface Sci., 2006, 298, 765 CrossRef CAS.
- C. Gu and T.-Y. Zhang, Langmuir, 2008, 24, 12010 CrossRef CAS.
- S. Tang, X. Meng, C. Wang and Z. Gao, Mater. Chem. Phys., 2009, 114, 842 CrossRef CAS.
- C.-H. Hsia, M.-Y. Yen, C.-C. Lin, H.-T. Chiu and C.-Y. Lee, J. Am. Chem. Soc., 2003, 125, 9940 CrossRef CAS.
- A. Michota and J. Bukowska, J. Raman Spectrosc., 2003, 34, 21 CrossRef CAS.
- L. Lu, A. Kobayashi, K. Tawa and Y. Ozaki, Chem. Mater., 2006, 18, 4894 CrossRef CAS.
- Y. Wang, P. H. C. Camargo, S. E. Skrabalak, H. Gu and Y. Xia, Langmuir, 2008, 24, 12042 CrossRef CAS.
- J. Xie, Q. Zhang, J. Y. Lee and D. I. C. Wang, ACS Nano, 2008, 2, 2473 CrossRef CAS.
- Y. Yang, J. Shi, T. Tanaka and M. Nogami, Langmuir, 2007, 23, 12042 CrossRef CAS.
- M. K. Kinnan and G. Chumanov, J. Phys. Chem. C, 2007, 111, 18010 CrossRef CAS.
- D. J. Anderson and M. Moskovits, J. Phys. Chem. B, 2006, 110, 13722 CrossRef CAS.
Footnote |
| † Electronic supplementary information (ESI) available: EDAX, XRD, and SEM images. See DOI: 10.1039/c0nr00106f |
| This journal is © The Royal Society of Chemistry 2010 |
