Electroconvection in nematic liquid crystals via nanoparticle doping
Martin
Urbanski
a,
Brandy
Kinkead
ab,
Hao
Qi
b,
Torsten
Hegmann
*b and
Heinz-S.
Kitzerow
*a
aDepartment of Chemistry, Faculty of Science, University of Paderborn, Warburger Str. 100, 33098, Paderborn, Germany. E-mail: heinz.kitzerow@upb.de; Fax: +49 (0) 5251 604 208; Tel: +49 (0) 5251 605 764
bDepartment of Chemistry, University of Manitoba, 144 Dysart Road, Winnipeg, MB R3T 2N2, Canada. E-mail: hegmannt@cc.umanitoba.ca; Fax: +1 204 474 7608; Tel: +1 204 474 7535
First published on 4th May 2010
Abstract
It is known that a small fraction of nanoparticles dispersed in a liquid crystal can alter the electrooptic response, completely. The present study on gold nanoparticles dispersed in 5-n-heptyl-2-(4-n-octyloxy-phenyl)-pyrimidine shows that the contrast inversion observed earlier is initiated by a change from parallel to homeotropic anchoring, thereby causing an instability, which in turn leads to the appearance of convection rolls. After rapid cooling from the isotropic phase, the nanoparticle dispersion shows a regular field-induced Fréedericksz transition, like the pure liquid crystal. The electrohydrodynamic instability is presumably an example for the behavior of (+, −) systems that was predicted by de Gennes, and only recently observed experimentally for the first time.
Introduction
Liquid crystals1 are indispensable materials for information displays, because their unique electrooptic behavior is utilized in modern flat panel LCD screens. Since their rod-like molecules align preferentially parallel in the commonly used nematic phase (along the director n, a pseudo-vector), these organic fluids show anisotropic properties, for example, birefringence Δn = ne − no, (where the indices “e” and “o” indicate the extraordinary and the ordinary refractive index, respectively), dielectric anisotropy Δε = ε‖ − ε⊥, and anisotropy of the electric conductivity Δσ = σ‖ − σ⊥ (where the indices “‖” and “⊥” correspond to the electric field direction with respect to the director alignment). One of the first electro-optic effects observed in liquid crystals was the formation of convection rolls, which appear particularly in liquid crystals with Δε < 0 and Δσ > 0.2–4 For these “(−, +)-materials”,1 an initial alignment of the director parallel to the glass substrates of the liquid crystal cell becomes unstable when an electric field is applied perpendicular to the substrates. Parallel stripes corresponding to convection rolls (Williams domains)5 and other regular patterns6 appear at the onset of instability, while chaotic turbulences are observed at voltages considerably higher than the critical voltage. Some forty years ago, the latter have been applied in dynamic scattering mode (DSM) displays.7 However, modern displays are based on materials with extremely low conductivity, and utilize a non-dissipative reorientation of the director, which is based only on the dielectric anisotropy (Fréedericksz effect).8,9 Nevertheless, the pattern formation in liquid crystals is currently a subject of extensive research activities. The standard model by Carr and Helfrich,2–4 which describes the behavior of a uniformly planar oriented (−, +) material (Δε < 0, Δσ > 0) was shown to explain also the possibility of pattern formation in (+, −) nematic liquid crystals (Δε > 0, Δσ < 0) in the case of perpendicular (homeotropic) anchoring.10–13 Electroconvection was also observed in many non-standard cases, for example (−, −),13,14 (+, +),15 or (−, +) under homeotropic anchoring conditions (⇒ “pre-wavy pattern”)16–19 and for bent-core liquid crystal compounds.20,21 Most recently, the influence of flexoelectric contributions on the pattern formation was described as well.14In the past, dispersions of nanoparticles in liquid crystals have always attracted great attention, since doping with nanoparticles can alter the properties of a liquid crystal, extremely. For example, the dispersion of ultra-small magnetic needles22,23 or platelets24 in nematic liquid crystals leads to ferronematics,22–25 which can be reoriented by very weak magnetic fields. Ferronematics can also be biased by magnetic fields, which leads to threshold-less optical switching in an electric field.25 Dispersion of silica aerogel nanoparticles leads to filled nematics,26 which can be used for a laser-addressed reversible display. Ferroelectric nanoparticles can enhance the dielectric anisotropy27 and the orientational order28 of nematic liquid crystals, while metallic nanoparticles can increase the conductivity by several orders of magnitude.29,30
Recently, Hegmann and co-workers reported that doping a nematic liquid crystal with nanoparticles made of gold31,32 or semiconductors (for example CdSe or CdTe)33 can fundamentally change its electro-optical properties. In samples, where the molecules of the pure liquid crystal align parallel to the glass substrate due to a polyimide alignment layer, respective nanoparticle dispersions may show a homeotropic alignment. When applying a voltage to the sample, the dispersion behaves seemingly like a liquid crystal with negative dielectric anisotropy. It switches from homeotropic to non-homeotropic alignment, although experiments32 prove a positive dielectric anisotropy for the nanoparticle/liquid crystal dispersion. In the present study, this unusual switching behavior is thoroughly investigated by means of electro-optical studies.
Experimental
Materials and methods
In the present study, the liquid crystal 5-n-heptyl-2-(4-n-octyloxy-phenyl)pyrimidine (FELIX-2900-03, Synthon Chemicals) was used as a host material. This compound shows the phase sequence Crystalline-52 °C–[Smectic A-45 °C]–Nematic-70 °C–Isotropic liquid. The synthesis of dodecylthiol-capped gold nanoparticles (diameter: 1.93 ± 0.47 nm) followed a modified Brust–Schiffrin approach34 as described earlier.32For the electro-optical characterization of the nanoparticle-doped nematic liquid crystal, a dispersion with 5% (by weight) nanoparticles in FELIX-2900-03 was used. The test cells were commercially available test cells (Instec, Inc.) with a cell gap of 4 μm. The pure liquid crystal was tested in cells purchased by EHC Ltd., Japan, with a cell gap of 6 μm for electro-optic measurements and 25 μm for dielectric measurements, respectively. The electrodes of all cells are covered by rubbed polyimide to induce planar alignment. A Mettler FP 5 heating stage was used for heating and cooling.
All electro-optical measurements were performed on a Leitz Ortholux II Pol-BK microscope with a white light source and an interference filter for monochromatic light (λ = 579 nm). As a detector, a usual photomultiplier (Oriel) was used. A waveform synthesizer (Rhode & Schwarz, model AFS) served for generating the voltages.
The dielectric permittivity was measured by means of an LCR-bridge (Hewlett Packard, HP 4274A) at a frequency of 1 kHz and an applied voltage of 0.3 V. As the amplitude of the applied voltage is small with respect to the threshold voltage for the Fréedericksz transition,32 reorienting effects due to the external voltage can be neglected. For measurements of ε‖, homeotropic alignment was achieved by applying a DC bias electric field in the range of 1.3 × 10⁶ V m−1.
Results and discussion
Systematic electro-optic experiments were performed on the same nanoparticle/liquid crystal dispersions investigated earlier by Hegmann et al.32 in order to compare the results with electro-optic properties of the pure liquid crystal 5-n-heptyl-2-(4-n-octyloxy-phenyl)pyrimidine [FELIX-2900-03]. The prepared cells (see Experimental section above) were first heated up to the isotropic phase and then slowly (1 °C min−1) cooled down. The electro-optical measurements were performed at 3 °C below the phase transition into the nematic phase. While the pure liquid crystal shows the expected planar alignment in the field OFF state (Fig. 1a), induced by the rubbed polyimide alignment layer of the cell, the mixture doped with 5 wt% of gold nanoparticles shows mainly homeotropic domains (Fig. 1b).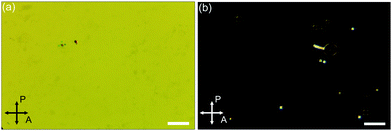 | ||
| Fig. 1 Polarized optical microscopy images of (a) the pure liquid crystal and (b) a mixture of 5% (by weight) Au-nanoparticles in FELIX-2900-03. The white bar represents 100 microns. Both samples were heated up to the isotropic phase and then cooled at a rate of 1 °C min−1 to T = TNI − 3 K. The rubbing direction of the cells used (Instec, 4 μm, antiparallel planar alignment was adjusted at an azimuthal angle of 45° between crossed polarizers. Both samples were illuminated with white light. | ||
The switching behavior changes fundamentally with the frequency of the applied AC bias. In typical electro-optical experiments at a frequency of 1 kHz, the pure liquid crystal shows a typical Fréedericksz transition, while the nanoparticle dispersion shows almost no electrooptic effect. This lack of switching and its presumable reason are discussed in the section below. However, more striking and entirely different is the behavior of the nanoparticle dispersion at very low frequencies (<1 Hz).
The electro-optical switching behavior of both cells at a frequency of 0.01 Hz is plotted in Fig. 2. The pure liquid crystal (Fig. 2a) switches from a bright state (parallel alignment) through some intensity oscillations to the dark state (homeotropic alignment), which is typical for the Fréedericksz transition. The Fréedericksz threshold field strength is E = 8.9 × 10⁵ V m−1. However, the nanoparticle-doped liquid crystal (Fig. 2b) shows a reverse switching behavior at low frequencies. While the director is homeotropically aligned in the field OFF state, the orientation seems to change to a planar alignment above a critical field strength of E = 2.4 × 10⁶ V m−1. The latter behavior is very surprising because the liquid crystal host exhibits a positive dielectric anisotropy. The switching is reversible as the director reorients to homeotropic alignment when the field strength drops below the critical field strength or when turning the field OFF.
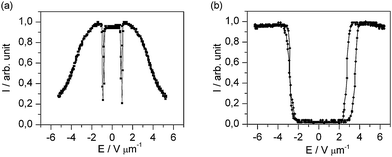 | ||
| Fig. 2 Electro-optic characteristics of (a) the undoped FELIX-2900-03 and (b) FELIX-2900-03 doped with 5% (by weight) of dodecylthiol-capped Au-nanoparticles. The frequency of the applied AC voltage is 0.01 Hz, the measurement was performed with monochromatic light (λ = 579 nm). | ||
The homeotropic alignment in the doped mixture is most likely caused by the gold nanoparticles residing at the polyimide/liquid crystal interface of the cell, forming a monolayer and superimposing the orientational effects of the polyimide as discussed earlier.32 In the bright state appearing above a certain DC voltage, electrohydrodynamic instabilities emerge (Fig. 3).
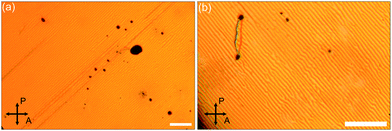 | ||
| Fig. 3 Parallel convection rolls due to electrohydrodynamic instabilities in FELIX-2900-03 doped with 5% (by weight) of dodecylthiol-capped Au-nanoparticles at an applied DC bias of 30 V. (a) Magnification 10×, (b) magnification 32×. The white bars represent 100 microns; the convection rolls have a spacing of 8–9 μm. | ||
The reverse switching behavior and the appearance of electrohydrodynamic instabilities resemble the recent experimental observations on electroconvection in a nematic liquid crystal with positive dielectric anisotropy, negative conductivity anisotropy [“(+, −) material”] and initial homeotropic alignment.10–12 Clearly, the transition from the dark state (Fig. 1b) to a bright state (Fig. 2b) indicates that the homeotropic alignment induced by the nanoparticles becomes unstable when applying a voltage perpendicular to the glass substrates, which leads to a rotation of the long axes of the molecules away from the direction of the electric field. Finally, this instability leads to the formation of convection rolls. In the present experiment, these convection rolls reproducibly form parallel stripes, in contrast to the “isotropic convection scenario” studied by Buka et al.11 This parallel alignment indicates that the polyimide alignment layer still has an effect on the liquid crystal alignment, in spite of the modified (homeotropic) alignment induced by the nanoparticles.
To test whether the present nanoparticle/liquid crystal dispersion is indeed an example for a (+, −) nematic system, we measured the dielectric anisotropy in the temperature range near the phase transition temperature, since former studies32 did not provide precise data. Fig. 4 shows the dielectric permittivities parallel and perpendicular to the director in the temperature range from TNI − T = 7 °C to the isotropic phase for the pure liquid crystal FELIX-2900-03. At the temperature of the electro-optic measurements (TNI − T = 3 °C), the dielectric anisotropy is positive with an absolute value of about Δε = +0.50. The measurement of conductivity anisotropy Δσ is more complicated, so currently we cannot deliver reliable data on this topic. This will be a task for research to come.
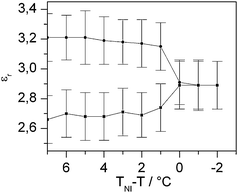 | ||
| Fig. 4 Plot of the relative dielectric permittivity of pure FELIX-2900-03. | ||
For comparison, a more typical electro-optical experiment at a frequency of 1 kHz is shown in Fig. 5. The pure liquid crystal shows the same characteristics of a usual Fréedericksz transition from planar to homeotropic alignment as represented in Fig. 2a. This indicates that the DC behavior of the liquid crystal matrix FELIX-2900-03 does not generally differ from the AC behavior. However, the reverse switching of the doped samples does not appear at high AC frequencies. As the director is homeotropically aligned in the field OFF state, this orientation is even stabilized by the applied field, resulting in a completely dark characteristic.
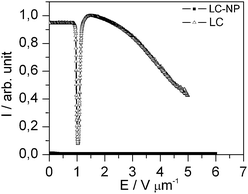 | ||
| Fig. 5 Electro-optical characteristics of the pure liquid crystal and the doped liquid crystal with homeotropic alignment in the field OFF state at an AC frequency of 1 kHz. The measurement was performed with monochromatic light (λ = 579 nm) between crossed polarizers. While the pure LC shows a typical Fréedericksz transition, the nanoparticle doped LC stays homeotropically aligned, resulting in a completely dark state for any field strength. | ||
In another experiment, the doped liquid crystal is cooled from the isotropic phase quite fast (10 °C min−1). In this case, the homeotropic alignment does not appear, but the liquid crystal orients parallel to the substrates due to the polyimide alignment layer of the cell. For this initial alignment, the doped liquid crystal shows the typical characteristics of a usual Fréedericksz transition as the undoped liquid crystal (Fig. 6). This proves that the unusual switching behavior shown in Fig. 2b is not a transition of the Fréedericksz type. The behavior shown in Fig. 6 confirms that the nanoparticle/liquid crystal dispersion exhibits a positive dielectric anisotropy like the pure liquid crystal (Fig. 4). In both cases, the dielectric anisotropy drives the molecules to orient parallel to the electric field.
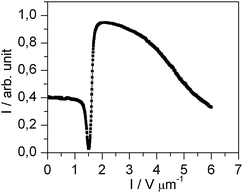 | ||
| Fig. 6 Electro-optical characteristic of the doped liquid crystal with planar alignment in the field OFF state at an AC frequency of 1 kHz. The measurement was performed with monochromatic light (λ = 579 nm). | ||
Conclusions
In conclusion, the reverse switching behavior of gold nanoparticle/liquid crystal dispersions reported earlier32 is found to be caused by electroconvection. When the dispersion is slowly (1 °C min−1) cooled from the isotropic to the nematic phase, a homeotropic alignment is induced, probably because the gold nanoparticles reside at the liquid crystal/substrate interface and alter the anchoring conditions.35 However, rapid cooling does not allow the nanoparticles to change the initial alignment of the cell. In the latter case, the doped liquid crystal shows a common Fréedericksz transition from planar to homeotropic alignment, which indicates positive dielectric anisotropy. Presumably, the unusual electroconvection scenario observed in the first case is a new example of instabilities in (+, −) nematic liquid crystals that were predicted long ago1 and observed recently.10–12 Two of three preconditions (homeotropic alignment and positive dielectric anisotropy) are obviously fulfilled while the third (negative conductivity anisotropy) remains to be proven. A rather simplified, schematic model of the formation of convection rolls is shown in Fig. 7.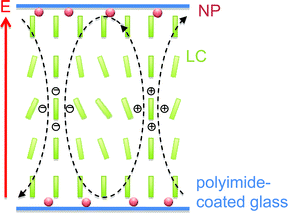 | ||
| Fig. 7 Simplified, schematic drawing showing the gold nanoparticles at the interface as well as the principle, nanoparticle-induced formation of convection rolls. | ||
In any case, the competing influences of the polyimide alignment layers, which promote parallel alignment, and the nanoparticles, which promote homeotropic alignment, provide an intriguingly interesting environment for electro-optic effects. Even when the initial alignment is perpendicular to the substrate and apparently no direction in the substrate plane is preferred, the convection rolls nevertheless align in one direction, which indicates the remaining influence on the polyimide alignment layer. It is important to highlight that pure Felix-2900-03 does not show any formation of convection rolls at any frequency of the applied electric field. It can be expected that this dual alignment capability does not only affect electroconvection, but may also be suitable for other effects, where surface switching is essential, for example bistable switching effects in cholesteric liquid crystals.
Acknowledgements
The authors would like to thank Dr Andreas Hoischen for his kind assistance in performing the dielectric measurements. Financial support by the Deutsche Forschungsgemeinschaft (DFG, KI 411), the European Science Foundation (ESF-EUROCORES, SONS II program, LC-NANOP project), the Natural Sciences and Engineering Research Council of Canada (NSERC), and the Technology Transfer Office (TTO) of the University of Manitoba for an IPM is gratefully acknowledged.References
- P. G. de Gennes, The Physics of Liquid Crystals, 1st ed., Clarendon, Oxford, 1974 Search PubMed.
- E. F. Carr, Mol. Cryst. Liq. Cryst., 1969, 7, 253–268 Search PubMed.
- W. Helfrich, J. Chem. Phys., 1969, 51, 4092–4105 CrossRef CAS.
- E. Bodenschatz, W. Zimmermann and L. Kramer, J. Phys., 1988, 49, 1875–1899 CAS.
- R. Williams, J. Chem. Phys., 1963, 39, 384–388 CrossRef CAS.
- Pattern Formation in Liquid Crystals, ed. A. Buka and L. Kramer, Springer-Verlag, New York, 1996 Search PubMed.
- G. H. Heilmeier, L. A. Zanoni and L. A. Barton, Appl. Phys. Lett., 1968, 13, 46–47 CrossRef CAS.
- V. Fréedericksz and V. Zolina, Trans. Faraday Soc., 1933, 29, 919–929 RSC.
- S. M. Kelly, Flat Panel Displays: Advanced Organic Materials, The Royal Society of Chemistry, Cambridge, 2000 Search PubMed.
- Á. Buka, B. Dressel, W. Otowski, K. Camara, T. Toth-Katona, L. Kramer, J. Lindau, G. Pelzl and W. Pesch, Phys. Rev. E: Stat., Nonlinear, Soft Matter Phys., 2002, 66, 051713 CrossRef CAS.
- Á. Buka, B. Dressel, L. Kramer and W. Pesch, Phys. Rev. Lett., 2004, 93(4), 044502 CrossRef CAS.
- Á. Buka, B. Dressel, L. Kramer and W. Pesch, Chaos, 2004, 14(3), 793–802 CrossRef CAS.
- E. Kochowska, S. Németh, G. Pelzl and Á. Buka, Phys. Rev. E: Stat., Nonlinear, Soft Matter Phys., 2004, 70, 011711 CrossRef.
- A. Krekhov, W. Pesch, N. Éber, T. Tóth-Katona and Á. Buka, Phys. Rev. E: Stat., Nonlinear, Soft Matter Phys., 2008, 77, 021705 CrossRef.
- B. Dressel and W. Pesch, Phys. Rev. E: Stat., Nonlinear, Soft Matter Phys., 2003, 67, 031707 CrossRef CAS.
- J.-H. Huh, Y. Hidaka, A. G. Rossberg and S. Kai, Phys. Rev. E: Stat. Phys., Plasmas, Fluids, Relat. Interdiscip. Top., 2000, 61(3), 2769–2776 CrossRef CAS.
- J.-H. Huh, Y. Hidaka, Y. Yusuf, N. Éber, T. Tóth-Katona, Á. Buka and S. Kai, Mol. Cryst. Liq. Cryst., 2001, 364, 111–122 CrossRef CAS.
- J.-H. Huh, Y. Yusuf, Y. Hidaka and S. Kai, Phys. Rev. E: Stat., Nonlinear, Soft Matter Phys., 2002, 66, 031705 CrossRef.
- N. Éber and Á. Buka, Phase Transitions, 2005, 78(6), 433–442 CrossRef CAS.
- D. Wiant, J. T. Gleeson, N. Éber, K. Fodor-Csorba, A. Jákli and T. Tóth-Katona, Phys. Rev. E: Stat., Nonlinear, Soft Matter Phys., 2005, 72, 041712 CrossRef CAS.
- (a) M.-G. Tamba, W. Weissflog, A. Eremin, J. Heuer and R. Stannarius, Eur. Phys. J. E, 2007, 22, 85–95 CrossRef CAS; (b) J. Heuer, R. Stannarius, M.-G. Tamba and W. Weissflog, Phys. Rev. E: Stat., Nonlinear, Soft Matter Phys., 2008, 77, 056206 CrossRef; (c) P. Tadapatri, U. S. Hiremath, C. V. Yelamaggad and K. S. Krishnamurthy, J. Phys. Chem. B, 2010, 114, 10–21 CrossRef CAS.
- F. Brochard and P. G. de Gennes, J. Phys., 1970, 31, 691–708 CAS.
- J. Rault, P. E. Cladis and J. P. Burger, Phys. Lett. A, 1970, 32(3), 199–200 CrossRef CAS.
- C. F. Hayes, Mol. Cryst. Liq. Cryst., 1976, 36, 245–253 CrossRef CAS.
- B. J. Liang and S.-H. Chen, Phys. Rev. A: At., Mol., Opt. Phys., 1989, 39(3), 1441–1446 CrossRef CAS.
- M. Kreuzer, T. Tschudi, W. H. de Jeu and R. Eidenschink, Appl. Phys. Lett., 1993, 62(15), 1712–1714 CrossRef CAS.
- E. Ouskova, O. Buchnev, V. Reshetnyak, Y. Reznikov and H. Kresse, Liq. Cryst., 2003, 30(10), 1235–1239 CrossRef CAS.
- F. Li, O. Buchnev, C. I. Cheon, A. Glushchenko, V. Reshetnyak, Y. Reznikov, T. J. Sluckin and J. L. West, Phys. Rev. Lett., 2006, 97, 147801 CrossRef.
- L. A. Holt, R. J. Bushby, S. D. Evans, A. Burgess and G. Seeley, J. Appl. Phys., 2008, 103, 063712 CrossRef.
- For a review, see: H. Qi and T. Hegmann, J. Mater. Chem., 2008, 18, 3288–3294 Search PubMed.
- H. Qi and T. Hegmann, J. Mater. Chem., 2006, 16, 4197–4205 RSC.
- H. Qi, B. Kinkead and T. Hegmann, Adv. Funct. Mater., 2008, 18, 212–221 CrossRef CAS.
- B. Kinkead and T. Hegmann, J. Mater. Chem., 2010, 20, 448–458 RSC.
- H. Choo, E. Cutler and Y.-S. Shon, Langmuir, 2003, 19, 8555–8559 CrossRef CAS.
- H. Qi and T. Hegmann, ACS Appl. Mater. Interfaces, 2009, 1, 1731–1738 Search PubMed.
| This journal is © The Royal Society of Chemistry 2010 |

