Thermo-responsive microphase separated supramolecular polyurethanes†
Daniel Hermida
Merino
a,
Andrew T.
Slark
c,
Howard M.
Colquhoun
a,
Wayne
Hayes
a and
Ian W.
Hamley
*ab
aDepartment of Chemistry, University of Reading, Whiteknights, Reading, RG6 6AD, UK. E-mail: I.W.Hamley@reading.ac.uk; Fax: + 44 (0)118 378 8450
bDiamond Light Source, Harwell Science and Innovation Campus, Chilton, Didcot, OX11 0DE, UK
cHenkel UK Limited, Wexham Road, Slough, SL2 5DS, UK
First published on 5th July 2010
Abstract
The ability to generate very stable assemblies via non-covalent interactions has enabled materials to be constructed that were not feasible via ‘traditional’ covalent bond formation processes. A series of low molecular mass bisurethane and bisurea polymers have been developed that form stable self-assembled networks through hydrogen bonding interactions. Thermo-responsive polymers were generated by end-capping poly(ethylene-co-butylene) or polybutadiene chains with the bisurethane or bisurea motif. Microphase separation is observed via TEM and small-angle X-ray scattering (SAXS) for the modified pseudo polymers and significant differences in the temperature dependence of microphase separation are analysed via SAXS. The importance of the polarity of the end groups is manifested in distinct temperature-dependent microphase separation behaviour. Information on the local hydrogen bonding structure is provided by wide-angle X-ray scattering and variable temperature FTIR.
1. Introduction
Self-assembly coupled with non-covalent synthesis offers the opportunity to generate novel nanocomposites with great control of a range of architectures that can facilitate the miniaturisation of devices,1,2 the development of smart materials with switchable properties,3 the evolution of optical and electronic devices4 and applications in bionanotechnology for pharmaceutical applications. The versatility of supramolecular assemblies offers the possibility to construct a diverse range of chemical architectures, from linear polymeric chains to networks and hyperbranched systems. The combination of properties of classical covalent polymers with hydrogen bonding interactions provides a novel way to obtain reversible materials with responsive and tuneable properties5 that match or improve the characteristics of classical polymers. In the present study, external thermal stimuli6 alter the thermodynamic equilibrium, offering a route to design functional supramolecular networks7 that will be exploited to attain thermo-reversible microphase separated morphologies responsible for the characteristic viscoelastic mechanical properties of polyurethanes.8–12 These supramolecular entities may enable the production of new thermoplastic elastomers, adhesives, and tuneable polymer materials.13We have developed new polymeric materials that are associated via multiple weak hydrogen-bonding interactions.14,15Fig. 1 shows the modular design concept of the end-functionalised polymers studied. The telechelic end-groups introduced into the prepolymers have been shown to dramatically affect the mechanical properties of the elastomers. Moreover, the correspondence of the binding constant with the rheological properties on the one hand and the degree of thermo-responsiveness on the other offers a novel concept to formulate reversible materials with customised mechanical properties.16
In the present paper, X-ray scattering has been used to probe the structure on several length scales viain situ measurements. Small-angle X-ray scattering (SAXS) was used to probe microphase separation. Simultaneous wide-angle X-ray scattering (WAXS) can provide information on the molecular scale, in particular on the packing of the polymer chains. Detailed analysis of the combined SAXS/WAXS data provides a wealth of data on a series of end-functionalised bisurethane and bisurea polymers, including differences in extent and temperature dependence of microphase separation. These results are related to other experiments previously reported16,17 where analogous supramolecular polymer materials have been reported to exhibit microphase separation with a typical rheological behaviour of block-copolymers. Moreover, time–temperature superposition (TTS) of rheological data from several polyisobutylene-based polymers similar to those studied in the present paper has confirmed the microphase separation and the effect of the end-groups on the mechanical properties.18 Attempts to produce materials that exhibit TTS have revealed the importance of the hydrogen bonding nature of the end-group in the temperature dependence of the physical properties. For the polymer studied here, DSC provides evidence of lack of crystallinity of the hard segment that results in the desired ‘switch off’ of the storage modulus in a processable temperature regime.17 The X-ray scattering data in the present paper are complemented with variable temperature FTIR spectroscopy, which probes the local hydrogen bonding environment within the supramolecular polymers.
2. Experimental
Materials
All reagents were used without further purification. Triethanolamine (99+%) and 2-(dibutylamino)ethanol (99%) were purchased from Aldrich. N,N-di-n-butylethylenediamine (98%) and N,N-bis(2-hydroxyethyl)ethylenediamine were obtained from Alfa Aesar. 4,4′-Methylenebis(phenyl isocyanate), poly(ethylene-co-butylene)diol (Mw = 3500) and polybutadiene diol (Mw = 2000) were donated by Henkel UK Limited. Tetrahydrofuran (THF) was distilled from benzophenone and sodium.General synthetic pathway
The synthesis of the supramolecular polymers studied in this report followed the procedure described earlier.17,18Small-angle X-ray scattering
SAXS experiments were performed on stations 2.1 and 6.2 at the Synchrotron Radiation Source, Daresbury Lab, UK and station A-2 of HASYLAB at Deutsches Elektronen-Synchrotron DESY in Hamburg (Germany). At Daresbury, the samples were placed in DSC pans into which holes were punched to produce X-ray windows. The windows are made of mica and the capsules were sealed to avoid sample loss. DSC runs were performed to study the thermal dependence of the microphase separation of the polymers. A two-dimensional RAPID area detector was used to acquire SAXS patterns. WAXS data were obtained using a curved one-dimensional multiwire gas detector. Since no orientation was observed in the SAXS patterns, data were reduced to one-dimensional form using the software BSL, with appropriate background subtraction. The wavenumber q = 4πsin θ/λ (scattering angle 2θ and wavelength λ = 1.5 Å) scale was calibrated using wet collagen (rat tail tendon). Similar measurements were undertaken on station 6.2, but with an X-ray wavelength λ = 1.40 Å.Further SAXS experiments were performed on beamline A-2 of DESY, Hamburg, Germany. Samples were placed in aluminium foil and mounted in a heated cell. Two linear Gabriel-type detectors were used to acquire SAXS and WAXS data simultaneously. The wavenumber (wavelength λ = 1.5 Å) scale was calibrated for SAXS using mineralized rat tail tendon, and for WAXS using a sample of poly(ethylene terephthalate).
Computer modelling
Computational modelling studies have been performed by the use of charge-compensated molecular mechanics, employing a custom-modified version of the Dreiding II force field, using the package Cerius3.5 (Accelrys Inc., San Diego). The simulations were run on a Silicon Graphics O2 workstation. Cerius3.5 is a force field based method which minimises the energy by modifying the structure toward the optimum geometry. Classical mechanics were employed in order to calculate the movement of the molecules and using an approximation for the potential energy (described as function of the geometry). The modelling of the bisurethane systems aimed to provide information on the possible conformations adopted by a single molecule. This was interpreted within the frame of intramolecular interactions within a hydrogen-bonded network.Variable temperature FT infrared spectroscopy
Fourier Transform Infrared (FTIR) spectroscopy has been employed to obtain variable temperature spectra since it is able to reveal information on the strength and extent of the association through hydrogen bonding interactions in organic molecules and polymers.8–12 The spectra were recorded using a Bruker Equinox 55 FTIR microspectrometer fitted with an MCT D316 IR scope detector. FTIR measurements were performed in transmission mode and 32 scans at 4 cm−1 resolution were averaged. The samples were obtained by drop casting directly on a KBr disk from a solution of THF 1% (w/v). The microspectrometer was equipped with a heating stage (Linkam TMS 94) with KBr windows in which the KBr disk is placed. Temperature ramp FTIR experiments were performed by heating the samples from 25 °C at a rate of 5 °C min−1 to 120 °C. Once the desired temperature was reached the temperature was stabilised by holding the temperature (5 minutes) at each subsequent temperature (40, 50, 60, 70, 80, 90, 100 and 110 °C) before data acquisition began. Time dependent FTIR studies were carried out by holding the sample at 120 °C for 5 minutes before the heating stage was switched off and the temperature decay had started. The spectra were obtained at interval of times (ca. 40 seconds at the beginning and 3 minutes at the end) using the same technical conditions as described for the above experiments.TEM
TEM analysis was performed in the Centre for Advanced Microscopy at the University of Reading (CfAM) using a CM20 Transmission Electron Microscope with an electron beam voltage of 80 kV. Sample preparation on carbon grids (S162-3 Formvar/Carbon 300 Mesh Cu) consisted of placing a droplet of the sample onto the grid and allowing the grid to dry in air. The sample was then stained with a droplet of uranyl acetate (1% in water) and left to dry in air prior to analysis.3. Results and discussion
Time-resolved SAXS and WAXS, variable temperature FTIR (VT-FTIR) and TEM experiments were performed to examine the microphase separation produced by end-capped self-assembled poly(ethylene-co-butylene) (P(E-co-B)) and poly(butadiene) (PB) polymers (1–8) synthesized in our group (Scheme 1).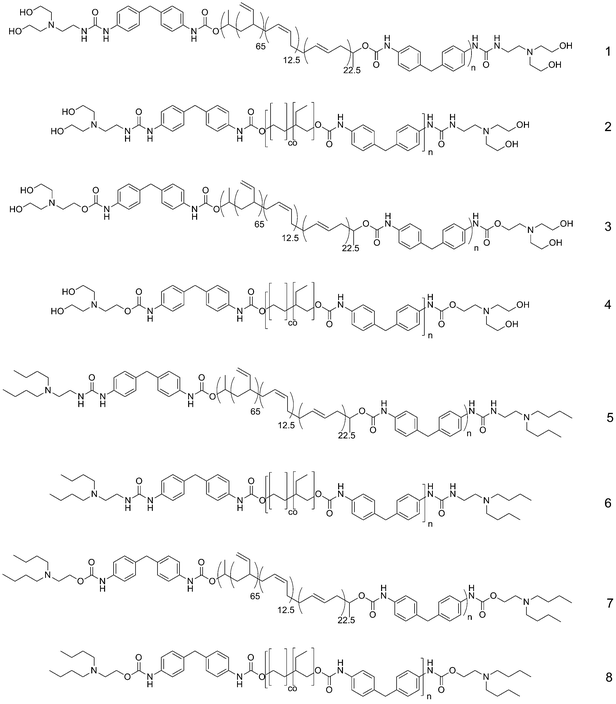 | ||
| Scheme 1 Bisurethane and bisurea polybutadiene derivatives (1, 3, 5 and 7) and poly(ethylene-co-butylene) derivatives (2, 4, 6 and 8) with n = 3. | ||
TEM confirmed the irregular microphase separation of 2 and 3 with a domain size of 10 nm, which is in agreement with the SAXS data discussed in the following. Fig. 2 shows representative images from dried samples. The minority hard segments (bisurea or bisurethane end groups including MDI) are selectively stained by the uranyl acetate.
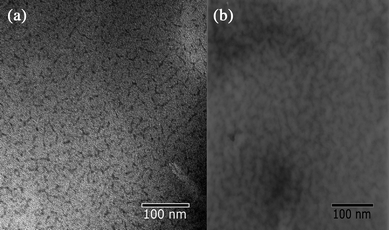 | ||
| Fig. 2 TEM micrographs of (a) 2 and (b) 3 obtained for dried films, stained with uranyl acetate. | ||
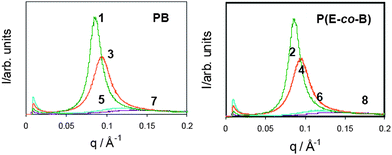
Preliminary room temperature SAXS experiments have been performed19 in order to investigate the influence of the bisurethane and bisurea end groups on the microphase separation (Fig. 3). The SAXS experiments reveal that the P(E-co-B) and PB derivatives are microphase separated. The absence of higher order reflections, as typical for polyurethane/polyurea systems,20–22 indicates the absence of well-defined microphase separated morphologies as observed for model block copolymers.23 The data revealed sharper and more intense peaks for the tetrol derivatives 1–4 when compared to the tetrabutyl derivatives 5–8, indicating enhanced microphase separation for the more polar systems caused by an increase in the electron density of the hard segment and thus, the electron density contrast of the hard/soft segment. This may result from the enhanced hydrogen bonding capacity of the tetrol derivatives.
The SAXS domain spacing obtained from Bragg's law, d = 2π/qmax, ranges from 4 to 8 nm approximately (Table 1). To interpret the observed domain spacings, the polymer dimensions have been estimated based on molecular models. The bisurethane and bisurea end groups have lengths estimated as dend = 1.65 nm for the tetrabutyl terminated derivatives and 1.64 nm for the tetrol terminated analogues. The dimension of the central polymer block was modelled as a random coil configuration with a radius of gyration RG = 2.82 nm for PB and 3.74 nm for the P(E-co-B). The radius of gyration was estimated24 from
 | (1) |
| PB | P(E-co-B) | |||||||
|---|---|---|---|---|---|---|---|---|
| 1 | 3 | 5 | 7 | 2 | 4 | 6 | 8 | |
| d data/nm | 7.25 | 6.64 | 5.12 | 4.31 | 8.12 | 7.25 | 5.96 | 5.87 |
| d model/nm | 8.92 | 8.92 | 8.94 | 8.94 | 10.76 | 10.76 | 10.78 | 10.78 |
In all cases, the experimental value of d was lower than that from the model and this systematic overestimation in the model suggests either interdigitation of end groups or a more compact polymer coil dimension than estimated. The largest differences are for those materials containing tetrabutyl groups (5, 6, 7 and 8). The difference of order of a factor of two suggests possible folding of the molecules, i.e. a hairpin structure possibly favoured by intramolecular hydrogen bonding (vide infra). The d spacings of materials with poly(ethylene-co-butylene) soft segments are also consistently larger than those of polybutadiene soft segments with analogous end groups (1vs.2, 3vs.4, 5vs.6 and 7vs.8) (vide infra).
The temperature dependence of microphase separation was studied by SAXS on heating (30 °C to 120 °C, ramp rate = 6 °C min−1). A dramatic difference was noted for the two classes of materials. For the tetrabutyl terminated bisurea poly(ethylene-co-butylene) derivative 6, a temperature dependence of the intensity, position and width peak was observed (Fig. 4). This observation was ascribed to disruption of the hydrogen bonding network. In stark contrast, SAXS analysis of the tetrol terminated bisurea poly(ethylene-co-butylene) derivative 2 did not reveal (in the temperature range studied) a significant temperature dependence of the SAXS peak parameters.
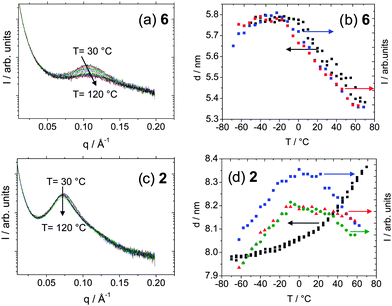 | ||
| Fig. 4 Variable temperature SAXS analysis of 6 and 2. (a and c) SAXS profiles, (b and d) domain spacing and intensity. The DSC was performed with a ramp of 3 cycles. (Blue square) intensity, heating, (red triangle) intensity, cooling, (green circle) intensity, second heating, (black square) domain spacing (nm). | ||
Fig. 5 summarizes the temperature dependent domain spacings obtained by SAXS on all polymers studied. It is evident that the results fall into two classes—the tetrol derivatives show an increase in domain spacing with temperature above approximately 0 °C, whereas the tetrabutyl derivatives reveal a decrease.
 | ||
| Fig. 5 Analysis of temperature dependence of SAXS peak from heating ramps (a) intensity and (b) domain spacing. Multiple data points at a given temperature result from repeat measurements. | ||
The increase in domain spacing for the tetrol derivatives may reflect the strong hydrogen bonding pattern for these systems which may lead to increased chain stretching with increasing temperature. Mean field theory for random copolymer melts predicts a coarsening of domain structure as the temperature is decreased,25 as for model block copolymers.23 It could be argued that the increase of domain spacing is the consequence of an enhancement of the microphase separation resulting from annealing of the sample. However, this rearrangement effect has been excluded since a reversible behaviour has been observed upon reheating without a considerable enhancement of the microphase separation (the heating ramp consists of a first heating, cooling and a reheating stages). An alternative explanation is that the increase in domain spacing on heating is due to an increase in incompatibility between hard and soft phases. This apparently counterintuitive suggestion, which goes against the expected increase in entropy of mixing, may in fact be due to an increase in hydrogen bonding with temperature, i.e. to LCST-type behaviour.
The temperature dependence of SAXS peak intensity is shown in Fig. 5a. The intensity for the tetrabutyl derivatives decreases significantly with temperature above 0 °C in a similar fashion to the d spacing, indicating an enhancement of mixing of the hard and soft segments with increasing temperature. Changes in the intensity for the tetrol derivatives are less pronounced. Above 0 °C there is a small decrease in intensity for 3 and 4 (bisurethanes) whereas there is very little change in intensity for materials 1 and 2 (bisureas) above this temperature. This observation suggests less change in miscibility for the tetrol derivatives with temperature.
We also considered simple thermal expansion effects of the polymer chains. The effects of expansion of the microphase separated structure can be studied as a result of the linear increase of d with T (T ≥ 0 °C) by plotting the gradient of domain spacing versusT for the polar terminated derivatives (1, 2, 3 and 4), leading to an estimated thermal expansion coefficient between 4 × 10⁻⁴ K−1 and 1 × 10⁻⁴ K−1. These values are the same order of magnitude as those reported previously for other copoly(urethane)s in a low temperature regime where thermal expansion was observed (at higher temperature a decrease in domain spacing was observed, associated with an order–disorder transition, ODT).20 The characteristic sharp boundary for the interphase in microphase-separated polyurethanes26 has been observed at high q as described by Porod's law, i.e. a power law in q. Similar behaviour was observed for the systems studied here, although the presence of a structure factor peak prohibits quantitative analysis.
Mean field theory for weakly segregated block copolymers leads to predictions of the temperature dependence of peak intensity. This, in turn, allowed the determination of the effective spinodal decomposition temperature from the relationship:21,22
 | (2) |
In mean field theory the exponent γ = 1.
Use of this equation leads to the conclusion that the temperature dependence of the peak intensity for the tetrol derivatives (1 and 3) (Fig. 6) is in approximate agreement with mean field theory. However, there are significant departures from mean field behaviour for the tetrabutyl-terminated analogues (5 and 7). The values of Ts obtained are below the soft segment Tg (Tg = −45 °C for polybutadiene) which precludes the observation of the ODT. In this case, supramolecular polymers that possess higher capability to form hydrogen bonding interactions were closer to the expected spinodal-type behaviour. However, it may be noted that numerous block copolymers possess similar structure before and after the ODT as a result of composition fluctuations.27 The mean field theory also makes predictions for the temperature dependence of domain spacing, d.20,28 For model block copolymers, the intensity changes discontinuously at the ODT.23 The temperature dependence of q* can also vary dramatically near the ODT.23 In our case, discontinuous changes in intensity and domain spacing were not observed (cf.Fig. 4 and 5) potentially revealing the absence of an ODT over the temperature range studied.
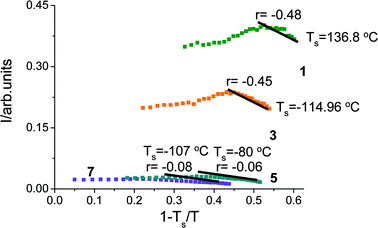 | ||
| Fig. 6 Spinodal determination of the bisurethane polybutadiene derivatives (1, 3, 5, and 7). | ||
We have attempted to model molecular conformations consistent with the various domain spacings observed (Table 1), which range from ca. 6 to 8 nm for poly(ethylene-co-butylene) derivatives and from 4.3 to 7.2 nm for the poly(butadiene) analogues.
The domain spacing of all the tetrol derivatives is significantly larger than that for the tetrabutyl analogues (Fig. 5a), and the temperature dependence of d is also opposite at high temperatures. These observations are rationalised by modelling the tetrol derivatives in an “extended configuration” (Fig. 7a), with reduced interdigitation of end groups at high temperature (as the hydrogen bonds weaken, see the following discussion of FTIR data) leading to the observed increase in domain spacing. In contrast, for the tetrabutyl derivatives, where smaller domain spacings are observed (Table 1) it is proposed that intramolecular hairpin conformations are significantly favoured (Fig. 7b). In these models, which are purely schematic, the polymer unit is mimicked by short alkyl chains of length chosen to match the calculated chain dimensions (Table 1 and related discussion).
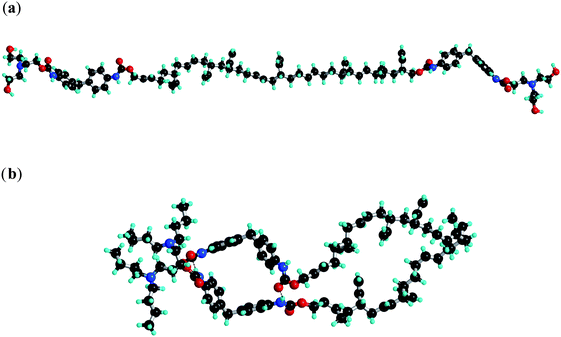 | ||
| Fig. 7 Modelling of the hydrogen bonding interactions of (a) tetrol terminated bisurethane systems in the extended configuration and (b) tetrabutyl terminated bisurethane system in the hairpin configuration. | ||
WAXS was used to probe the molecular conformation and packing at molecular length scales, in particular to obtain information on the hydrogen bonding pattern. WAXS was performed simultaneously with SAXS, and the results for two representative systems are presented in Fig. 8.
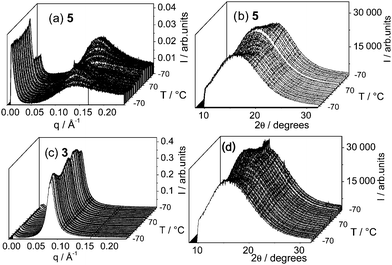 | ||
| Fig. 8 Variable temperature SAXS (a and c) and WAXS (b and d) analysis of 3 and 5. The samples were heated at 5 °C min−1 between −70 °C and 70 °C for three cycles (one cycle shown). | ||
The main WAXS peaks were observed in the range 4.7–4.9 Å. This corresponds to the side–side separation of the polymer chains (Fig. 9). In this figure, hydrogen bonding is illustrated between alcohol and urethane groups. Mixed hydrogen bonding between alcohol, urethane and tertiary amine groups is also possible, as discussed in our previous paper.16
 | ||
| Fig. 9 Representation of the microstructure of the hydrogen bonded network in the tetrol derivatives (1, 2, 3 and 4). For convenience, hydrogen bonding is shown at only one end of the polymers. | ||
The temperature dependence of the WAXS peak position was also analysed (Fig. 10). In the case of the WAXS peak position (and corresponding dWAXS spacing), the tetrol and tetrabutyl derivatives show a similar dependence, i.e. an increase in dWAXS with temperature. This indicates that the different temperature dependencies of the SAXS domain spacing are not related to the side–side packing of the polymer chains. As mentioned above, this may reflect differences in the hydrogen bonding pattern of the end groups. In the case of the tetrol derivatives, an increase in domain spacing with temperature may arise as a consequence of the strong hydrogen bonding between the end-groups. This may in turn lead to chain stretching. In contrast, for the tetrabutyl derivatives, increasing temperature may lead to the usual increased sampling of different conformations and a decrease in polymer coil dimensions.
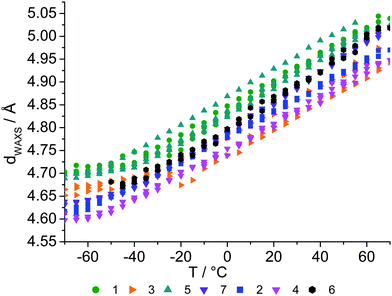 | ||
| Fig. 10 Temperature dependence of the principal WAXS spacing dWAXS. | ||
Finally, the telechelic end-capping has been varied, which influences the hydrogen-bonding capacity. In order to quantify the effect of each structural site and the effect on the interactivity of the bisurethane system, the content of each component has been calculated (vide infra, Table 2) considering that the soft segment comprises exclusively the polymer coils. Included is data for model compounds 9 and 10 (Scheme 2).
 | ||
| Scheme 2 Structure of low molecular bisurethane model compounds: tetrol (9) and tetrabutyl (10) terminated derivatives. | ||
| Sample | P(E-co-B) (hard content) | PB (hard content) |
|---|---|---|
| 8/7 | 11.36 | 18.32 |
| 6/5 | 11.35 | 18.30 |
| 4/3 | 11.01 | 17.79 |
| 2/1 | 10.98 | 17.76 |
| 9 | 2.91 | 4.70 |
| 10 | 2.51 | 4.07 |
Several physical trends may be noted depending on structural modification. Primarily, the domain spacing of P(E-co-B) derivatives is larger than for corresponding PB derivatives (see Table 1) although the hard content of the PB is higher (Table 2). The chemical incompatibilities resulting from the difference in polarities between the P(E-co-B) and the end groups are presumably larger, leading to greater phase separation.
Variable temperature FTIR experiments have been performed in order to understand the effect of the temperature on the ordering in the polymer melts. It provides insight into both the self-assembly mechanism and its thermo-reversibility since it can probe the chemical environment, degree and strength of the competitive/cooperative hydrogen bonds in supramolecular polyurethanes/ureas. FTIR has also been used to provide evidence of microphase separation in segmented polyurethanes/ureas. Solution state FTIR characterization of model bisurethanes 9 and 10 has demonstrated16 the hydrogen bonding nature of the interactions which cause the polymeric properties of the bisurethane derivatives. Variable temperature FTIR experiments have also been employed to confirm the interaction and the ordering of the urethane groups in the bulk.
Variable temperature FTIR analysis of 9, 10 and the corresponding polymer derivatives (1–8) has revealed consistent spectroscopic characteristics. These spectra revealed a significant shift from 3317 cm−1 at 25 °C to 3334 cm−1 at 120 °C for the NH stretching vibration (see Fig. S1(a1), (a2) and (a3)†) which indicates that hydrogen bonding interactions are disrupted as the temperature was increased and therefore, the molecular mobility was amplified. Furthermore, a large enhancement of the free NH stretching vibration intensity (3444 cm−1) was observed as the temperature increases, indicating the free vibration of the NH group.
Similarly, the shift of the stretching vibration from 1707 cm−1 at 25 °C to 1718 cm−1 at 120 °C (for the bonded peak) corresponds to the urethane carbonyl of the tetrabutyl terminated bisurethane system (Fig. 11, 10, 8 and 6). As for the NH stretching band, the shift of the signal for the urethane denotes some dissociation of the hydrogen bonds and thus, the tendency to obtain the free vibration of the urethane. Moreover, the bisurea systems (1, 2 and 5, 6) possess both urethane and urea moieties which afford more complex spectra. These spectra reflect the complex hydrogen bonding network formed in these supramolecular polyurethane/urea samples. The IR spectrum of 6 provides further evidence of the connectivity of the proton of the urea moieties as a result of the higher acidity of the carbonyl of the urethane (1690 cm−1). Furthermore, the urea region of the spectrum reveals the presence of free urea as well as disordered and ordered hydrogen bonded urea that confirms the lack of crystallinity of the bisurethane/urea systems. Given the adaptability of the interactions produced by the interacting groups of hydroxyl terminated bisurethane/urea systems, it is expected that the identification of the hydrogen bonding interactions and the detection of the diverse interaction sites by FTIR will be complex. The amorphous structure of the networks enables different arrangements either in an intra- or inter-molecular fashion. In order to evaluate the extent of the hydrogen bonding interactions and to determine the temperature at which physical cross-links are modified, the absorption bands in the FTIR spectra were analysed for several samples. Fig. 11 shows representative data for the low molecular weight model compounds, i.e. tetrabutyl-terminated bisurethane system 10 and tetrol end-capped system 9. Furthermore, the percentage of hydrogen bonded urethane has also been included in the diagram which has been calculated as:29
 | (3) |
Here, total area = free urethane peak area + H-bonded urethane peak area.
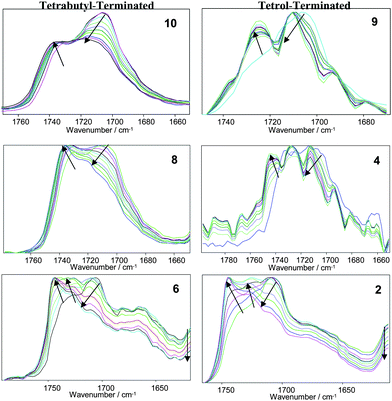 | ||
| Fig. 11 VT-FTIR (25–120 °C) spectra of the model bisurethane compounds (9 and 10) and selected polymer derivatives. Characteristic peaks: 1730–1740 cm−1 free urethane carbonyl, 1703–1710 cm−1 hydrogen bonded, 1690–1700 cm−1 free urea carbonyl, 1660–1670 cm−1 hydrogen bonded urea carbonyl (disordered), 1630–1645 cm−1 hydrogen bonded urea, 1575 cm−1 strongly H-bonded amide II. Arrows indicate effect of increasing temperature. | ||
The extent of hydrogen bonding in both bisurethane derivatives 9 and 10 decreased in a quasi-linear fashion as the temperature was increased (Fig. 12). As expected the free urethane peak position does not change appreciably with temperature, although that of the H-bonded urethane does show significant shifts. It should be highlighted that the stretching vibration does not seem to be completely free at the highest temperature. Even for polyamides, the hydrogen bonds are not fully dissociated in the melt state even well above 200 °C. The urethane hydrogen peaks for 9 and 10 show a discontinuity in the peak positions at around 60 °C. A similar process is observed for 1 and 2 (Fig. S3†).
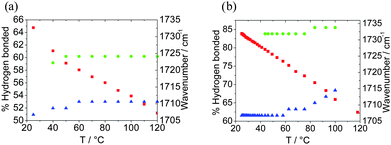 | ||
| Fig. 12 Summary of the extent of hydrogen bonding versus temperature. The blue data points indicate the location of the H-bonded urethane peak, the green ones denote the free urethane band position and the red data points the percentage of H-bonded urethane calculated using eqn (3), (a) 9 and (b) 10. | ||
The development of the network formation via hydrogen bonding was followed by time dependent FTIR experiments. The rearrangement of the bisurethanes resulting from the disruption of the physical cross-links has been investigated. The experiment shows the reversibility of the structure achieved (see Fig. 13) confirming the observed mechanism by SAXS and WAXS. The conversion of the bisurethane systems to the original morphology was reorganised mostly over the time course of 15 minutes (see Fig. 13, red circles). This is in good agreement with observations by Yilgor and co-workers for polyureas based on MDI30 but diverge from the analogous polyurethanes31 that did not reveal any significant microphase separation. The profile of the cooling plots (uncontrolled cooling, the red circles in Fig. 13 show the time dependence) shows some similarity with the heating counterpart (see Fig. 13, blue triangles versus black squares), suggesting equivalent behaviour either in the formation or in the disruption of the hydrogen bonds (see Fig. S1 and S2†).
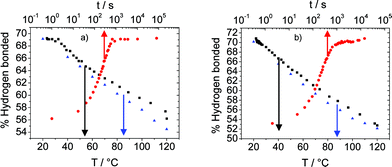 | ||
| Fig. 13 Time and temperature dependence of the extent of urethane hydrogen bonding of (a) 8 and (b) 4. (Blue triangle) heating, (black square) cooling, (red circle) cooling/time dependence. | ||
4. Summary
A pronounced difference in the microphase separation of model bisurethane and bisurea supramolecular polymers was observed, depending on the nature of the end groups. This was caused by differences in the extent and pattern of hydrogen bonding. SAXS data confirmed microphase separation, without long-range order, as characteristic for polyurethane/urea block copolymers. The magnitude and temperature dependence of domain spacing was different for tetrol and tetrabutyl derivatives. WAXS analyses have revealed a preferred local packing distance of 4.7 Å which shows ordering as a consequence of the hydrogen bonding between the urethane groups.9,32 The tetrol terminated polymers present more distinct phases but a lower hard content. The structures achieved are all thermo-sensitive and thermo-reversible. However, the thermal response of the polymer derivatives is distinct since the tetrol derivatives (either for P(E-co-B) as for PB derivatives) show enhanced phase segregation as the temperature is increased whereas the rest of the tetrabutyl systems exhibit a decrease in the domain spacing.It has been rationalised that the increase of the domain spacing with temperature for the tetrol derivatives is produced by more interdigitated configurations of the end-groups since the domain spacings are consistent with the length of the compound in an “extended configuration” modelling the polymer as a coil. Tetrabutyl as well as tetrol terminated polymer derivatives of P(E-co-B) are comparable in structural terms apart from the increase of the urethane/urea content in the P(E-co-B) copolymers. Compounds 1, 2, 3 and 4 present domain spacings that correspond with the “extended configuration”. WAXS patterns have confirmed the local packing of the supramolecular polymers through the hydrogen bonds formed by the urea–urethane groups. The increase in WAXS d spacing is observed for all derivatives, as is the decrease in extent of urethane hydrogen bonding. Thus local packing cannot explain the decrease in domain spacing observed at high temperature for the tetrabutyl derivatives which also exhibit significantly smaller domain spacings than the tetrol derivatives. We have proposed that this is due to a significant extent of chain folding of tetrabutyl-terminated polymers into compact hairpin conformations. Our results highlight that control of structural properties, in particular microphase separation, via subtle modifications to end group chemistry can lead to distinct morphological, and rheological18 properties.
Acknowledgements
The authors acknowledge sponsorship by Henkel UK Limited. We are grateful to Gemma Newby for assistance with the SAXS/WAXS experiments at HASYLAB and to Dr Peter Harris and Dr Chris Stain for support with TEM.References
- R. P. Feynman, There is Plenty of Room at the Bottom, in Miniaturization, ed. H. D. Gilbert, Reinhold Publishing, New York, 1961, pp. 282–296 Search PubMed.
- D. Philp and J. F. Stoddart, Angew. Chem., Int. Ed. Engl., 1996, 35, 1154–1196 CrossRef.
- A. T. Cate, H. Koojiman, A. L. Spek, R. P. Sijbesma and E. W. Meijer, J. Am. Chem. Soc., 2004, 126, 3801–3808 CrossRef.
- S. H. Kawai, S. L. Gilat and J. M. Lehn, J. Chem. Soc., Chem. Commun., 1994, 1011 RSC.
- L. Brunsveld, B. J. B. Folmer, E. W. Meijer and R. P. Sijbesma, Chem. Rev., 2001, 101, 4071–4097 CrossRef CAS.
- B. J. B. Folmer, R. P. Sijbesma and E. W. Meijer, Polym. Mater. Sci. Eng., 1999, 217, 39.
- C. B. St. Pourcain and A. C. Griffin, Macromolecules, 1995, 28, 4116–4121 CrossRef.
- B. B. Sauer, R. S. Mclean, D. J. Brill and D. J. Londono, J. Polym. Sci., Part B: Polym. Phys., 2002, 40, 1727–1740 CrossRef CAS.
- B. D. Kaushiva and G. L. Wilkes, J. Appl. Polym. Sci., 2000, 77, 202–216 CrossRef CAS.
- B. D. Kaushiva, S. R. McCartney, G. R. Rossmy and G. L. Wilkes, Polymer, 2000, 41, 285–310 CrossRef CAS.
- P. R. Laity, J. E. Taylor, S. S. Wong, P. Khunkamchoo, K. Norris, M. Cable, V. Chohan, G. T. Andrews, A. F. Johnson and R. E. Cameron, J. Macromol. Sci., Part B: Phys., 2004, 43, 95–124 Search PubMed.
- C.-P. Chen, S. A. Dai, H.-L. Chang, W.-C. Su, T.-M. Wuand and R.-J. Jeng, Polymer, 2005, 46, 11849–11857 CrossRef CAS.
- J. Ruokolainen, R. Mäkinen, M. Torkkeli, T. Mäkelä, R. Serimaa, G. Ten Brinke and O. Ikkala, Science, 1998, 280, 557 CrossRef CAS.
- W. Hayes, P. Woodward, A. Clarke and A. T. Slark, Eur. Pat. Appl., EP792925, 2007.
- P. Woodward, A. Clarke, D. Hermida Merino, A. T. Slark and W. Hayes, Polym. Prepr. (Am. Chem. Soc., Div. Polym. Chem.), 2007, 48(2), 936–937 CAS.
- P. Woodward, A. Clarke, B. W. Greenland, D. H. Merino, L. Yates, A. T. Slark, J. F. Miravet and W. Hayes, Soft Matter, 2009, 5, 2000–2010 RSC.
- P. Woodward, D. H. Merino, I. W. Hamley, A. T. Slark and W. Hayes, Aust. J. Chem., 2009, 62, 790–793 CrossRef CAS.
- P. J. Woodward, D. H. Merino, B. W. Greenland, I. W. Hamley, Z. Light, A. T. Slark and W. Hayes, Macromolecules, 2010, 43, 2512–2517 CrossRef CAS.
- D. H. Merino, P. Woodward, J. K. Kandola, P. J. F. Harris, A. T. Slark, I. W. Hamley and W. Hayes, Polym. Prepr. (Am. Chem. Soc., Div. Polym. Chem.), 2008, 49(1), 1084 CAS.
- A. J. Ryan, C. W. Macosko and W. Bras, Macromolecules, 1992, 25, 6277–6283 CrossRef CAS.
- S. Velankar and S. L. Cooper, Macromolecules, 1998, 31, 9181–9192 CrossRef CAS.
- S. Velankar and S. L. Cooper, Macromolecules, 2000, 33, 382–394 CrossRef CAS.
- I. W. Hamley, The Physics of Block Copolymers, Oxford Science Publications, 1998 Search PubMed.
- L. J. Fetters, D. J. Lohse, D. Richter, T. A. Wittenand and A. Zirkelt, Macromolecules, 1994, 27, 4639–4647 CrossRef CAS.
- G. H. Fredrickson and S. T. Milner, Phys. Rev. Lett., 1991, 67, 835–838 CrossRef CAS.
- M. Špirkova, L. Matejka, D. Hlavata, B. Meissner and J. Pytela, J. Appl. Polym. Sci., 2000, 77, 381–389 CrossRef CAS.
- J. H. Rosedale, F. S. Bates, K. Almdal, K. Mortensen and G. D. Wignall, Macromolecules, 1995, 28, 1429–1443 CrossRef.
- L. Leibler, Macromolecules, 1980, 13, 1602–1617 CrossRef CAS.
- L. Ning, W. De-Ning and Y. Sheng-Kang, Polymer, 1996, 37, 3577–3583 CrossRef CAS.
- I. Yilgor, E. Yilgor, S. Das and G. L. Wilkes, J. Polym. Sci., Part B: Polym. Phys., 2009, 47, 471–483 CrossRef CAS.
- I. Yilgor, E. Yilgor, I. G. Guler, T. C. Ward and G. L. Wilkes, Polymer, 2006, 47, 4105–4114 CrossRef CAS.
- A. Aneja and G. L. Wilkes, J. Appl. Polym. Sci., 2002, 85, 2956–2967 CrossRef CAS.
Footnote |
| † Electronic supplementary information (ESI) available: Synthesis and characterization of polybutadiene derivatives 1, 3, 5 and 7. Additional FTIR spectra. See DOI: 10.1039/c0py00122h |
| This journal is © The Royal Society of Chemistry 2010 |


