Controlled assembly of Fe3O4 magnetic nanoparticles on graphene oxide†
Yi
Zhang‡
ab,
Biao
Chen‡
ac,
Liming
Zhang
a,
Jie
Huang
a,
Fenghua
Chen
a,
Zupei
Yang
b,
Jianlin
Yao
c and
Zhijun
Zhang
*a
aSuzhou Institute of Nano-tech and Nano-bionics, Chinese Academy of Sciences, Suzhou, 215123, P. R. China. E-mail: zjzhang2007@sinano.ac.cn; Fax: +86-0512-62603079; Tel: +86-0512-62872556
bSchool of Chemistry and Materials Science, Shaanxi Normal University, Xi'an, 710062, Shaanxi, P. R. China
cCollege of Chemistry, Chemical Engineering and Materials Science, Soochow University, Suzhou, 215123, P. R. China
First published on 7th February 2011
Abstract
We describe a facile approach to controllable assembly of monodisperse Fe3O4 nanoparticles (NPs) on chemically reduced graphene oxide (rGO). First, reduction and functionalization of GO by polyetheylenimine (PEI) were achieved simultaneously by simply heating the PEI and GO mixture at 60 °C for 12 h. The process is environmentally friendly and convenient compared with previously reported methods. Meso-2,3-dimercaptosuccinnic acid (DMSA)-modified Fe3O4 NPs were then conjugated to the PEI moiety which is located on the periphery of the GO sheets via formation of amide bonds between COOH groups of DMSA molecules bound on the surface of the Fe3O4 NPs and amine groups of PEI. The magnetic GO composites were characterized by means of TEM, AFM, UV-vis, FTIR, Raman, TGA, and VSM measurements. Finally, preliminary results of using the Fe3O4-rGO composites for efficient removal of tetracycline, an antibiotic that is often found as a contaminant in the environment, are reported.
Integration of nanoparticles (NPs) and graphene into nanocomposites has recently become a hot topic of research due to their new and/or enhanced functionalities that cannot be achieved by either component alone, and therefore holds great promise for a wide variety of applications in catalysis, optoeletronic materials, surface enhanced Raman Scattering, biomedical fields, and so on.1–10 Among them are nanocomposites of magnetic NPs (MNPs) and graphene oxide (GO) (Fe3O4-GO), for potential applications in enhanced optical limiting, MRI, drug delivery, and removal of contaminants from waste water.8–11 Formation of Fe3O4-GO nanocomposites is usually achieved by in situreduction of iron salt precursors12–14 or assembly of the MNPs on the GO surface,11 similarly to its carbon nanotube counterpart.15,16 Cong et al. reported for the first time depositing of magnetic nanoparticles on a chemically reduced GO and application of the magnetic functionalized rGO in MRI.9 Most recently He and colleagues attached iron oxide NPs to GO viaconjugation chemistry and explored their application for removal of methylene blue from waste water.11 There are, however, some problems with the approaches reported so far, such as poor control over the size, size distribution, and location of magnetic nanoparticles on the GO sheets. In addition, thus-prepared Fe3O4-GO composites may agglomerate and gradually precipitate from their aqueous suspension.9 All these drawbacks make the use of magnetic GO in biomedical and other fields difficult.
Herein we describe a facile strategy for assembly of monodisperse Fe3O4 NPs onto a polyetheylenimine (PEI)-grafted reduced GO sheet, the schematic of which is illustrated in Fig. 1. In this straightforward route, the Fe3O4 NPs were firstly prepared viathermal decomposition of Fe precursors and then modified by hydrophilic 2,3-dimercaptosuccinnic acid (DMSA), followed by assembling the DMSA-modified Fe3O4 NPs onto PEI-grafted GO sheets. There are two significant advantages of our approach over other previously reported ones: (1) well controlled size, size distribution, and morphology of the Fe3O4 NPs in the Fe3O4-rGO composites. This is readily achieved by first preparing the monodispersed Fe3O4 NPs by well established synthetic procedures and then assembly onto the GO surface. (2) controlled decoration of Fe3O4 NPs on the edge of GO sheets, which allows us to efficiently load aromatic drugs or to adsorb aromatic pollutants from waste water, on the basal plane of the GO sheet via π–π stacking, the latter will be discussed later in this paper. To our knowledge, this may be the first report on a facile and general synthesis route for NPs-GO composites by which NPs with precisely-controlled size and morphology can be deposited onto specific sites of the GO sheets.
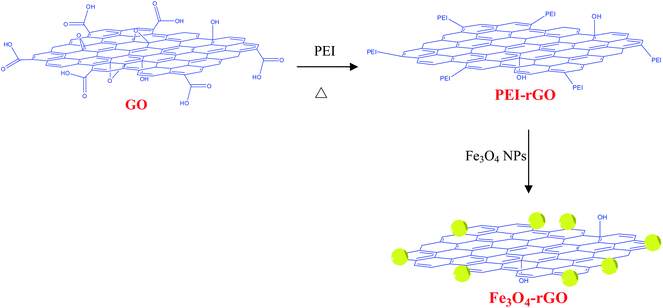 | ||
| Fig. 1 Schematic diagram of synthesis of Fe3O4-rGO composites. | ||
In our approach, 6 nm Fe3O4 NPs and 18 nm Fe3O4 NPs were prepared by thermal decomposition of Fe(acac)3 using a well-established procedure17 and surface modified by DMSA18 to allow further covalent bonding to GO. TEM images in Fig. S1† indicate that the as-prepared Fe3O4 NPs are uniform particles with sizes of 6 nm and 18 nm, respectively.
Water soluble GO was prepared from graphite according to the modified Hummers method reported in our previous work.19 40 mL aqueous suspension of GO (0.1mg mL−1) was then mixed with 40 mL PEI (1% aqueous solution) and heated to 60 °C for 12 h.20 The color of the mixture changed gradually from brown to black during the heating process, indicating reduction of GO to reduced GO (rGO) during heating with PEI. It was reported that GO can be reduced to rGO in the presence of amine-containing molecules.20 After purification by centrifugation and dialysis, the product was extensively characterized by AFM, UV-vis, FTIR, Raman, and electrochemical measurements. AFM measurement show that the thickness of GO changed from 1.79 nm to 0.815 nm (Fig. 2) upon heating of the mixture of GO and PEI. It is reasonable that reduction of GO to rGO by PEI, that is, removal of oxygen-containing groups such as epoxide from both sides of the GO sheet, leads to a decrease in GO thickness. The characteristic peak at 231 nm for GO, was shifted to 266 nm in the UV-vis spectra (Fig. S2†), suggesting reduction of GO and restoration of the large electronic conjugation.21,22 Significant shift of the D band from 1336 cm−1 to 1322 cm−1 and the G band from 1603 cm−1 to 1591 cm−1 in the Raman spectra (Fig. S3†), and an increase of intensity ratio of the D band to G band (ID/IG) from 1.26 to 1.53 are typical features of reduction of GO to rGO.23,24 From IR spectra (Fig. S4†), substantial increase in two peaks at 2852 cm−1 and 2923 cm−1 assignable to symmetric and asymmetric stretching modes of CH2 of the PEI chains, and dramatic decrease in the peak at 1730 cm−1 due to C![[double bond, length as m-dash]](https://www.rsc.org/images/entities/char_e001.gif) O of COOH-GO suggests reduction of the GO and chemical bonding of PEI to the rGO sheets.25,26 The zeta potential of the original GO is −39.7 mV, which was shifted to 55.8 mV when the GO was heated with PEI, indicative of formation of PEI-rGO complex and introduction of positive charges into initially negatively charged GO sheets. The PEI-rGO complex obtained dispersed well in water and was stable when stored in ambient conditions for 3 months. Agglomeration and precipitation usually occurs when GO is chemically reduced to rGO.27 Based on the discussion above, the role of the PEI in this work is threefold: reducing GO to rGO, stabilizing the chemically reduced GO in aqueous solution, and acting as a linker molecule for anchoring the MNPs on the GO sheet.
O of COOH-GO suggests reduction of the GO and chemical bonding of PEI to the rGO sheets.25,26 The zeta potential of the original GO is −39.7 mV, which was shifted to 55.8 mV when the GO was heated with PEI, indicative of formation of PEI-rGO complex and introduction of positive charges into initially negatively charged GO sheets. The PEI-rGO complex obtained dispersed well in water and was stable when stored in ambient conditions for 3 months. Agglomeration and precipitation usually occurs when GO is chemically reduced to rGO.27 Based on the discussion above, the role of the PEI in this work is threefold: reducing GO to rGO, stabilizing the chemically reduced GO in aqueous solution, and acting as a linker molecule for anchoring the MNPs on the GO sheet.
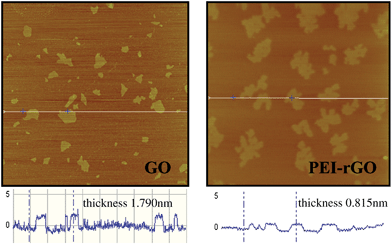 | ||
| Fig. 2 AFM images of GO and PEI-grafted GO sheets. | ||
Next, formation of Fe3O4-rGO nanocomposites was carried out by chemical bonding of PEI-rGO and DMSA-modified Fe3O4 NPs in the presence of 1-ethyl-3-(3-dimethyaminopropyl) carbodiimide (EDC) and N-hydroxysuccinnimide (NHS) (Fig.1). The composition, morphologies, and magnetic properties of the Fe3O4-rGO composites were extensively characterized by TEM, EDX, FTIR, TGA, and VSM measurements. Fig. 3 shows TEM images of the 6nm Fe3O4-rGO and 18nm Fe3O4-rGO composites. The monodisperse Fe3O4 NPs (Fig. S1†) were preferentially decorated to the periphery of the graphene surface. This can be explained as follows. The COOH groups are thought to populate along the edge of the GO sheets in the original GO,28 which serves as a template for PEI grafting, and then PEI guided assembly of Fe3O4 NPs occurs on the outer boundary of the graphene sheets. It is also noted that some Fe3O4 NPs are located on the basal plane due to the irregular distribution of the carboxylic acid groups on the GO sheets caused by the vigorous oxidation of graphite. Typical EDX pattern (inset in the left TEM image of Fig. 3) indicates that the 6nm Fe3O4-rGO composites contain Fe, O, and C elements, while the Cu element comes from the copper grids. From TGA data shown in Fig. S5,† slight weight loss (5.2%) at temperature below 120 °C was observed, due to loss of water or other volatile residuals. Further heating of the 6nm-Fe3O4-rGO from 120 °C to 550 °C results in 25.3% weight loss, mainly due to removal of oxygen-containing functional groups such as COOH, OH, C![[double bond, length as m-dash]](https://www.rsc.org/images/entities/char_e001.gif) O, and epoxide of the GO sheets. The amount of Fe3O4 component in the 6nm-Fe3O4-rGO composites was thus estimated to be 61% from the TGA data.10,23 This ratio is rather high compared with other magnetic composites, and may be beneficial for their applications in various fields.10Fig. 4 gives magnetic hysteresis loops for 6nm Fe3O4-rGO composites measured at 298 K. The profiles of the magnetization curves of the 6 nm Fe3O4 and the corresponding 6nm-Fe3O4-rGO composites are characteristic of superparamagnetic nanoparticles. The saturation magnetization of the 6 nm Fe3O4 NPs in our work is significantly lower when compared with their bulk counterpart, which was also observed previously by others and can be explained by size-dependent magnetization of the magnetic NPs and the presence of organic ligands on the surface of the Fe3O4 NPs.17,29,30 The 6 nm Fe3O4 NPs loaded on the rGO support showed a decrease in saturation magnetization (from 39 emu g−1 to 28 emu g−1), due to a decrease in the amount of magnetic component in the composites,9,10 but it is still very high compared with that of the Fe3O4-rGO obtained viaassembly of surface modified Fe3O4 NPs on GO in previous work.11
O, and epoxide of the GO sheets. The amount of Fe3O4 component in the 6nm-Fe3O4-rGO composites was thus estimated to be 61% from the TGA data.10,23 This ratio is rather high compared with other magnetic composites, and may be beneficial for their applications in various fields.10Fig. 4 gives magnetic hysteresis loops for 6nm Fe3O4-rGO composites measured at 298 K. The profiles of the magnetization curves of the 6 nm Fe3O4 and the corresponding 6nm-Fe3O4-rGO composites are characteristic of superparamagnetic nanoparticles. The saturation magnetization of the 6 nm Fe3O4 NPs in our work is significantly lower when compared with their bulk counterpart, which was also observed previously by others and can be explained by size-dependent magnetization of the magnetic NPs and the presence of organic ligands on the surface of the Fe3O4 NPs.17,29,30 The 6 nm Fe3O4 NPs loaded on the rGO support showed a decrease in saturation magnetization (from 39 emu g−1 to 28 emu g−1), due to a decrease in the amount of magnetic component in the composites,9,10 but it is still very high compared with that of the Fe3O4-rGO obtained viaassembly of surface modified Fe3O4 NPs on GO in previous work.11
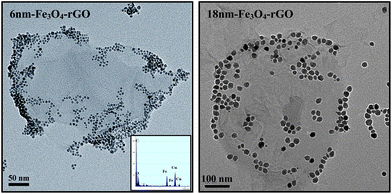 | ||
| Fig. 3 TEM image of the 6 nm Fe3O4-rGO and 18 nm Fe3O4-rGO composites. The inset in the left image shows EDX pattern of the 6nm-Fe3O4-rGO sample. | ||
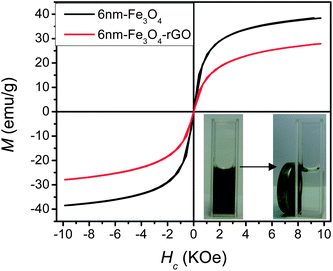 | ||
| Fig. 4 Magnetization curves of 6 nm Fe3O4 NPs and 6 nm Fe3O4-rGO composites. The inset shows photographs of the aqueous solution of the 6 nm Fe3O4-rGO composites before (left) and after attracted by a magnetic bar (right). | ||
Finally, we carried out a preliminary study on the use of the 6nm-Fe3O4-rGO nanocomposites in magnetically-guided removal of aromatic antibiotic contaminants from waste water (Fig. 5). We chose tetracycline (TC) as a model contaminant because TC and related derivatives are consumed in huge amounts (∼10,000 ton) annually worldwide, much of which is discharged into soil and water, becoming a major environmental hazard.31 We demonstrated previously that GO exhibits a super-strong ability to adsorb aromatic anticancer drugs.19 For the 6nm-Fe3O4-rGO composites, the basal plane of the GO is almost unoccupied by the magnetic NPs (TEM image in Fig. 3), and therefore facilitates selective adsorption of aromatic TC molecules via π–π stacking and other molecular interactions. The magnetic GO loaded with TC can be removed from the waste water readily by applying a magnetic bar. In our experiment, the aqueous suspension of 6nm-Fe3O4-rGO is simply mixed with aqueous solutions of TC of different concentrations and stirred for 24h. After adsorption of TC, the magnetic composites were then separated with the aid of a magnetic bar. Adsorbed amount of TC was found to increase with increasing equilibrium concentration of TC. The maximum amount of TC adsorbed to GO was determined to be 95 mg g−1 (Fig. 5) under current experimental conditions. It was found that the adsorption of TC by 6nm Fe3O4-rGO composites follows Freundlich isotherm (Fig. S6†). The adsorption of TC by GO is so strong that sonication for 30 min cannot remove the TC from the GO sheet (data not shown). Further experiments are under way in this lab to investigate the efficient use of the magnetic GO in selective removal of TC and other environmental contaminants with aromatic structures from waste water.
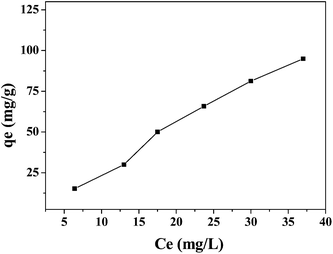 | ||
| Fig. 5 Adsorption of tetracycline by 6 nm Fe3O4-rGO as a function of equilibrium concentration at 25 °C. | ||
In summary, we demonstrated that simple heating of the mixture of PEI and GO in aqueous suspension leads to chemical reduction of GO, and binding of PEI to the GO sheet mainly at its outer boundary, which then guided prefential assembly of the magnetic NPs on the periphery of the GO sheet. This structural feature of the GO-based magnetic composites facilitates efficient loading of anticancer drugs or adsorbing aromatically structured chemical pollutants onto the basal region of the GO sheets. This approach may be generalized to form a wide variety of NP-rGO composites, by simply changing the type of nanoparticles and the ratio of NPs to GO, adaptable to different applications.
Experimental section
Materials
Native graphite flake was purchased from Alfa Aesar. Concentrated sulfuric acid (H2SO4), potassium persulfate (K2S2O8), phosphorus pentoxide (P2O5), potassium permanganate (KMnO4), branched polyethylenimine 25 K (PEI), absolute ethanol, hexane, dichloromethane, iron(III) acetylacetonate (Fe(acac)3), oleic acid, oleylamine, meso-2,3-dimercaptosuccinic acid (DMSA), dimethylsulfoxide (DMSO), 1-ethyl-3-(3-dimethyaminopropyl) carbodiimide (EDC), and N-hydroxysuccinnimide (NHS) were purchased from Sigma-Aldrich. Ultrapure water (18MΩ cm−1) was used in all experiments.Instrumentation
The Fe3O4 NPs and their GO composites were characterized by atomic force microscopy (AFM) and Tecnai G2 F20 S-Twin transmission electron microscopy (TEM) equipped with Energy Dispersive Spectrometry (EDX). Samples for TEM were prepared by placing a drop of water dispersion onto a carbon-coated copper grid and drying at room temperature. Zeta potential was obtained using a ZEN3600 (NanoZS). UV-vis spectra were collected using a Lambda 25 UV-vis-near infrared spectrophotometer. Raman spectra were measured using a confocal microprobe Raman system (HR 800), which is equipped with a holographic notch filter and a CCD detector. The excitation wavelength was 632.8 nm from a He–Ne laser. Thermogravimetric analysis (TGA) was conducted using a TG/DTA 6200 system under dry air with a heating rate of 10 °C min−1. Magnetic measurement was carried out at room temperature with a vibrating sample magnetometer (VSM).Modification of the Fe3O4 NPs by meso-2,3-dimercaptosuccinic acid (DMSA). In this experiment, 20 mg of the as-prepared Fe3O4 NPs was dissolved in 2 mL toluene followed by addition of a solution containing 20 mg DMSA and 2 mL DMSO. The resulting solution was stirred at 25 °C for 12 h. This precipitant was then carefully washed with ethyl acetate three times and separated by magnetic separation. Finally, the DMSA-Fe3O4 NPs were collected using a permanent magnet bar and transferred into 2 mL water.18
Then the mass of adsorbed tetracycline per mass unit of the 6nm-Fe3O4-rGO is expressed as function of tetracycline concentration in supernatant as
| qe = V(C0 − Ce)/m |
The adsorption of TC to the 6nm-Fe3O4-rGO can be expressed by Freundlich model equation:
| lnqe = lnKf + 1/n(lnCe) |
Acknowledgements
Financial support of this work by Natural Science Foundation of China (No.20873090, 21073224), National Basic Research Program of China (2010CB933504), and CAS (KJCX2.YW.M12) is gratefully acknowledged. The authors thank Platform for Characterization and Test at SINANO for TEM measurement.References
- K. Jasuja, J. Linn, S. Melton and V. Berry, J. Phys. Chem. Lett., 2010, 1, 1853 Search PubMed.
- Y. C. Si and E. T. Samulski, Chem. Mater., 2008, 20, 6792 CrossRef CAS.
- C. Xu, X. Wang and J. W. Zhu, J. Phys. Chem. C, 2008, 112, 19841 CrossRef CAS.
- Z. H. Tang, S. L. Shen, J. Zhuang and X. Wang, Angew. Chem. Int. Ed., 2010, 49, 1.
- B. S. Kong, J. X. Geng and H. T. Jung, Chem. Commun., 2009, 16, 2174 Search PubMed.
- C. X. Guo, H. B. Yang, Z. M. Sheng, Z. S. Lu, Q. L. Song and C. M. Li, Angew. Chem., Int. Ed., 2010, 49, 3014 CAS.
- C. H. Lu, H. H. Yang, C. L. Zhu and G. N. Chen, Angew. Chem., Int. Ed., 2009, 48, 4785 CrossRef CAS.
- X. Y. Zhang, X. Y. Yang, Y. F. Ma, Y. Huang and Y. S. Chen, J. Nanosci. Nanotechnol., 2010, 10, 2984 CrossRef CAS.
- H. P. Cong, J. J. He, Y. Lu and S. H. Yu, Small, 2010, 6, 169 CrossRef CAS.
- X. Y. Yang, X. Y. Zhang, Y. F. Ma, Y. Huang, Y. S. Wang and Y. S. Chen, J. Mater. Chem., 2009, 19, 2710 RSC.
- F. He, J. T. Fan, D. Ma, L. M. Zhang, C. Leung and H. L. Chan, Carbon, 2010, 48, 3139 CrossRef CAS.
- J. F. Shen, Y. Z. Hu, M. Shi, N. Li, H. W. Ma and M. X. Ye, J. Phys. Chem. C, 2010, 114, 1498 CrossRef CAS.
- T. Szabó, A. Bakandritsos, V. Tzitzios, E. Devlin, D. Petridis and I. Dékány, J. Phys. Chem. B, 2008, 112, 14461 CrossRef CAS.
- V. K. Singh, M. K. Patra, M. Manoth, G. S. Gowd, S. R. Vadera and N. Kumar, New Carbon Mater., 2009, 24, 147 Search PubMed.
- L. Q. Jiang and L. Gao, Chem. Mater., 2003, 15, 2848 CrossRef CAS.
- V. Georgakilas, V. Tzitzios, D. Gournis and D. Petridis, Chem. Mater., 2005, 17, 1613 CrossRef.
- S. H. Sun, H. Zeng, D. B. Robinson, S. Raoux, P. M. Rice, S. X. Wang and G. X. Li, J. Am. Chem. Soc., 2004, 126, 273 CrossRef CAS.
- Z. P. Chen, Y. Zhang, K. Xu, R. Z. Xu, J. W. Liu and N. Gu, J. Nanosci. Nanotechnol., 2008, 8, 6260 CrossRef CAS.
- L. M. Zhang, J. G. Xia, Q. H. Zhao, L. W. Liu and Z. J. Zhang, Small, 2010, 6, 537 CrossRef CAS.
- D. S. Yu and L. M. Dai, J. Phys. Chem. Lett., 2010, 1, 467 Search PubMed.
- Q. Yang, X. J. Pan, F. Huang and K. C. Li, J. Phys. Chem. C, 2010, 114, 3811 CrossRef CAS.
- C. Z. Zhu, S. J. Guo, Y. X. Fang and S. J. Dong, ACS Nano, 2010, 4, 2429 CrossRef CAS.
- W. F. Chen, L. F. Yan and P. R. Bangal, Carbon, 2010, 48, 1146 CrossRef CAS.
- G. K. Ramesha and S. Sampath, J. Phys. Chem. C, 2009, 113, 7985 CrossRef CAS.
- H. L. Guo, X. F. Wang, Q. Y. Qian, F. B. Wang and X. H. Xia, ACS Nano, 2009, 3, 2653 CrossRef CAS.
- S. Stankovich, R. D. Piner, X. Q. Chen, N. Q. Wu, S. T. Nguyen and R. S. Ruoff, J. Mater. Chem., 2006, 16, 155 RSC.
- J. X. Geng and H. T. Jung, J. Phys. Chem. C, 2010, 114, 8227 CrossRef CAS.
- S. J. Park and R. S. Ruoff, Nat. Nanotechnol., 2010, 4, 217.
- K. Woo, J. Hong, S. Choi, H. W. Lee, J. P. Ahn, C. S. Kim and S. W. Lee, Chem. Mater., 2004, 16, 2814–2818 CrossRef CAS.
- N. Z. Bao, L. M. Shen, Y. S. Wang, P. Padhan and A. Gupta, J. Am. Chem. Soc., 2004, 126, 273–279 CrossRef CAS.
- A. K. Sarmah, M. T. Meyer and A. B. A. Boxall, Chemosphere, 2006, 65, 725 CrossRef CAS.
- W. S. Hummers, R. E. Offeman and J. Am, J. Am. Chem. Soc., 1958, 80, 1339 CrossRef CAS.
- N. I. Kovtyukhova, P. J. Ollivier, B. R. Martin, T. E. Mallouk, S. A. Chizhik, E. V. Buzaneva and A. D. Gorchinskiy, Chem. Mater., 1999, 11, 771 CrossRef CAS.
Footnotes |
| † Electronic supplementary information (ESI) available: TEM, UV-vis spectra, Raman spectra, FTIR, and TGA. See DOI: 10.1039/c0nr00776e |
| ‡ These authors contributed equally to this work. |
| This journal is © The Royal Society of Chemistry 2011 |
