Human olfactory receptor 17-40 as an active part of a nanobiosensor: a microscopic investigation of its electrical properties
Eleonora
Alfinito
*a,
Jean-Francois
Millithaler
a,
Lino
Reggiani
a,
Nadia
Zine
b and
Nicole
Jaffrezic-Renault
b
aDipartimento di Ingegneria dell'Innovazione, Università del Salento, Lecce, Italy, EU, & CNISM - Consorzio Nazionale Interuniversitario per le Scienze Fisiche della Materia, Roma, Italy, EU. E-mail: eleonora.alfinito@unisalento.it
bUniversity of Lyon, Laboratory of Analytical Chemistry, Claude Bernard University, 43 Boulevard 11 Novembre 1918, 69622 Villeurbanne Cedex, France, EU
First published on 19th July 2011
Abstract
Increasing attention has recently been devoted to protein-based nanobiosensors. The main reason is the huge number of possible technological applications, ranging from drug detection to early cancer diagnosis. Their operating model is based on protein activation and the corresponding conformational change due to the capture of an external molecule, the so-called ligand. Recent measurements, performed with different techniques on the human 17-40 olfactory receptor, revealed a very narrow window of response in respect to the odour concentration. This is a crucial point for understanding whether the use of this olfactory receptor as a sensitive part of a nanobiosensor is a good choice. In this paper we investigate the topological and electrical properties of the human olfactory receptor 17-40 with the objective of providing a microscopic interpretation of available experiments. To this purpose, we model the protein by means of a graph that is able to capture the mean features of the 3D backbone structure. The graph is then associated with an equivalent impedance network, able to evaluate the impedance spectra of the olfactory receptor in its native and activated state. We assume a topological origin of the different protein electrical responses to different ligand concentrations: In this perspective all the experimental data are collected and interpreted satisfactorily within a unified scheme, also useful for application to other proteins.
Introduction
Olfaction is one of the most refined senses in mammals: It allows the recognition of many thousands of different odours. In general, each odour is a mixture of different molecules, each of them able to activate a specific set of olfactory receptors (ORs), present in the nasal epithelium.1–4 By contrast, each OR selectively recognizes few specific molecules (ligands).5 In such a way, the sequence of activated ORs identifies the odour univocally.6,7 This mechanism indicates ORs as natural candidates for the production of a new generation of hybrid nanodevices for the detection of specific ligands.8–13 To this purpose, these nanobiosensors should integrate animal ORs with an electrical/electronic transducer.8Conventional electronic noses are biomimetic sensors able to detect specific odours. The detection is usually performed by means of solid-state gas sensors: they translate the captured information into a digital signal which is elaborated by appropriate algorithms. To date, the sensitivity and selectivity of conventional devices are of a good level, but still very far from those of a mammalian nose, the gold standard of an olfactory biosensor.4,9 The use of ORs as the active part of a sensor aims to improve its selectivity, to reduce its size for achieving an on-field detection, to cut the costs and, as a future challenge, to obtain a specific device for each odour of interest.1,2,4,8,9,12,13
These preliminary remarks are mainly supported by the observation of a change in the electrical response in OR-based devices.14–16 This change coincides with protein activation due to the presence of a specific ligand.
All the ORs are G-protein coupled receptors (GPCRs): This family of proteins includes receptors of many different molecules, and also the light receptors (opsins). GPCRs have quite a similar structure and function. Previous studies on opsins9 and rat OR I79,17 validated a theoretical model that is able to describe the electrical properties of these proteins through an impedance network protein analogue (INPA). Recent investigations on human OR 17-40,14,18,19 valuable for the practical realization of a nanobiosensor, led to interesting results that are not yet fully understood on a microscopic level. In particular, measurements were performed with electrochemical impedance spectroscopy (EIS) on a two terminal device with the active part controlled by this OR: It was observed that the polarization resistance showed a peculiar bell-shaped behaviour at increasing values of the specific odorant concentration.14 The peak was centered at low concentrations of the specific ligand (around 10−10 M). Furthermore, by using complementary techniques like the differential surface plasmon resonance (SPR) and differential bioluminescence response, in addition to the first peak, a second maximum response was observed at a higher concentration of the odorant (around 10−5 M).18 These results were also confirmed by differential conductance measurements.16
The aim of this paper is to group recent investigations performed on human OR 17-40, in particular those obtained from EIS measurements, into a unified microscopic model. By using the INPA approach we correlate the electrical response of the given protein to its topological properties. Accordingly, it is possible to predict how the modifications of the latter, as induced by the capture of ligands, influence the former. The understanding of this correlation is promising for the future use of human OR 17-40 in nanobiosensors. Finally, we conjecture on the existence of a correspondence between the collective response of an ensemble of proteins to a specific odour concentration, and the variation of a calculated single protein impedance at different values of the network free parameter Rc. This parameter defines the maximal distance between two interacting amino acids. In this way, the single protein model is able to provide estimations on the electrical response of a protein based macroscopic device.
The paper is organized as follows. Section 2 briefly summarizes the theoretical model. Sections 3 and 4 detail the main results of the paper and illustrate conjecture for describing the protein modifications due to different ligand concentrations. A conclusive section summarizes the major achievements and the perspectives of this research.
Theory
The INPA approach, as detailed in previous papers,9,17 correlates the electrical and topological properties of a sensing protein. The main objective of INPA is to predict the protein electrical modifications as induced by a change of its topology. For the reader’s convenience, its main features briefly discussed. The approach is structured in two steps.The first step produces the protein analogue graph. The input data of the model is the tertiary (3D) structures of the protein. These structures are known from the protein data bank (PDB) available in literature20 or similar (see, for example, Ref. 17). Given the 3D structure, the protein is represented by means of a topological network (a graph). Each node on the graph corresponds to a single amino acid. If two amino acids are closer than an assigned interacting radius, Rc, then a link is drawn between the corresponding nodes.
The second step dresses the graph. By associating an elemental impedance with each link, the graph becomes an impedance network. In other words, each link mimics a privileged channel for charge transfer and/or charge polarization.17
The elementary impedance between nodes i and j, Zi,j, consists of an Ohmic resistance, R, connected in parallel with a dielectric-filled parallel-plate capacitor, C,9,10,17
 | (1) |
 , is the cross-sectional area between two spheres of radius Rc centered on the i-th and j-th node, respectively; li,j is the distance between these centers, ρ is the resistivity, taken to be the same for every amino acid, with the indicative value of ρ = 1010 Ωm;
  is the imaginary unit, ε0 is the vacuum permittivity, and ω is the circular frequency of the applied voltage. The relative dielectric constant of the couple of the i,jamino acids, εi,j, is expressed in terms of the intrinsic polarizability of the i,jamino acids.
By positioning the input and output electrical contacts on the first and last node respectively (corresponding to the first and last amino acid of the protein sequential structure), the network is solved within a linear Kirchhoff scheme.9,10,17 Within this framework, the protein is mapped into an electrical network whose topology reflects the protein conformation. When the conformation changes, the network topology and, in turn, the electrical response, follows this change.
Material and method
To date, no crystallographic data are available for the 3D structures of the human OR 17-40. Accordingly, the 3D structures used in this paper are obtained from homology modeling.17 Those are calculated by using the light receptor bovine rhodopsin in the native state (in the dark), as a template for the henceforth mentioned native human OR 17-40, and the bovine rhodopsin in the active state, metarhodopsin II (in the light), as the template for the active human OR 17-40.The INPA approach is very flexible, and allows one to carry out different kinds of investigations. In particular, here we aim:
i) To compare the contact maps of the protein in the native and active state as a function of the interacting radius, Rc. These 2D maps visualize the connected parts of the network and are drawn by assigning to each couple of linked amino acids, say i–j, a point of coordinates i,j. Two amino acids are linked if their distance is less than Rc, otherwise they remain separated. Therefore, by comparing the contact maps of the protein in the native and active state, we gain access to a direct image of the main changes in the protein topology.
ii) To calculate the relative variation of resistance between the native and active state of the OR. Since the elementary impedance depends on the distance between amino acids, when the protein conformation changes, the global impedance, and thus the resistance, changes.
iii) To calculate, within the standard frequency range 1 mHz ÷ 100 kHz, the protein impedance spectra for the native and active states. In this way it is possible to draw the theoretical Nyquist plot that should be compared with the experimental one.
Finally, the different electrical responses, as calculated from the networks pertaining to the native/active state, are here taken as an estimate of the measured electrical responses implied by the protein conformational change.
Results
The main results concerning sections 3 and 2 are detailed in the following subsections.Protein topology
The global insight on the protein conformational change, as induced by the ligand capture, is given by the contact maps reported in Fig. 1 and Fig. 2. In these figures the diagonal is a symmetry axis that allows one to compare native and active states in the same figure, the native state is represented by points satisfying i < j while the active state by points i > j. Furthermore, the contact maps are calculated for two different interaction radii, specifically 6 Å in Fig. 1 and 20 Å in Fig. 2. From these figures we can observe that, by increasing the value of Rc, the density of the points and thus the connectivity increase substantially, as expected. In particular, the main differences between the native and active state are in the increased connectivities among the helices h3-h4-h6, where the principal binding pocket is presumably located.21 Notably, significant differences between the native and active states survive at large Rc, up to Rc values of around 50 Å.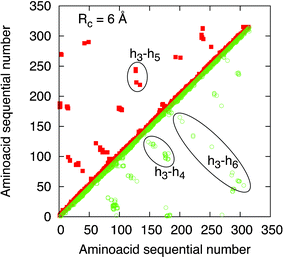 | ||
| Fig. 1 Contact maps of human OR 17-40 for Rc= 6 Å. The data of the native state is reported on the left side of the diagonal (full red squares), the data of the active state is reported on the right side of the diagonal (green open squares). The ellipses signal the main differences between the native and active state which are attributed to the transmembrane helices h3-h4-h6. | ||
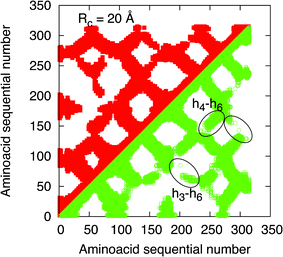 | ||
| Fig. 2 Contact maps of OR 17-40 for Rc= 20 Å. The data of the native state are reported on the left side of the diagonal (red full squares), the data of the active state is reported on the right side of the diagonal (green open squares). The ellipses signal the main differences between the native and active states which are attributed to the transmembrane helices h3-h4-h6. | ||
Protein resistance
The value of the protein resistance in its native state is, in general, different from that in its active state and the magnitude of this difference depends on Rc, as reported in Fig. 3. Here the main result is the non-monotonic behaviour of the resistance change at increasing values of Rc. The region of maximum sensitivity to the conformational change is found for Rc in the range 6 ÷ 14 Å. Furthermore, in the ranges of the Rc values 18 ÷ 26 Å and 38 ÷ 65 Å, calculations show an inversion of the resistance variation, with the active state becoming less resistive than the native state. In terms of the electrical network, such an inversion is interpreted as a more parallel nature with respect to series connections of the active link resistances.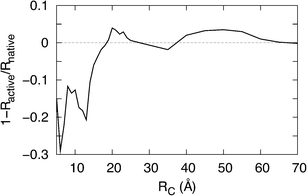 | ||
| Fig. 3 Variation in the relative resistance of human OR 17-40 as function of the interacting radius Rc. | ||
Recent advances on the activation mechanism of these proteins22 depict their dynamics in terms of a complex series of intermediate conformational transitions (that involve the disruption of non covalent intramolecular interactions) rather than in terms of a simple on/off switch. These interactions stabilize the protein state in a specific equilibrium condition, which depends on the ligand concentration. An increasing concentration of ligands induces the disruption of stabilizing interactions, enabling the receptor to evolve toward a more active state.
In our model, we conjecture that the disruption of stabilizing interactions is related to the reduction of the interaction radius Rc, which corresponds to a decrease in the connections between amino acids. Accordingly, we assume the existence of a correlation between the interacting radius, Rc, and the concentration of a specific odorant, Λ. In this way, the change of the single protein resistance vs. Rc (see Fig.3) is correlated to the analogue quantity measured for different ligand concentrations.14 In establishing this relationship we assume that the peak of the electrical response of human OR 17-40 (occurring at Λ = 10−10 M) corresponds to Rc= 52 Å, as shown by Fig. 3. Furthermore, in this perspective, Fig. 3 gives the evolution of the relative resistance variation at different ligand concentrations. Starting from very large Rc, where there is no difference between state responses (small Λ values in our conjecture), at smaller Rc the resolution of the electrical response evolves toward larger values (large Λ values). In doing so, the resolution exhibits at least two bumps.
The functional dependence of Rc on Λ is found to follow a power law, as evidenced by the dashed line in Fig. 3. To enforce the above conjecture, Fig. 4 reports Rc as a function of a specific odorant concentration. Here, the data is obtained by comparing the experimental response for different helional concentrations14 with the theoretical relative resistance variation of the single protein at different Rc values, as reported in Fig. 3.
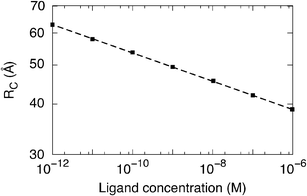 | ||
| Fig. 4 Interacting radius (Rc) as a function of the specific ligand helional concentration, Λ. The dashed line is a guide to the eye. | ||
Fig. 5 reports the polarization resistance variation as a function of the odorant concentration, as measured for the specific cases of heptanal and helional.14 The theoretical results (dashed curve) are found to reproduce qualitatively well the experiments (symbols), which evidence a typical bell-shaped behaviour with a maximum sensitivity for the case of helional at a molar concentration of 10−10 M. By construction, the quantitative comparison between theory and experiments cannot discriminate the different sensitivity to different odorants of the OR. In any case, at this stage of investigation we believe that the overall agreement between theory and experiments is satisfactory enough to further support our conjecture.
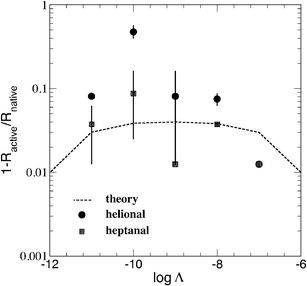 | ||
| Fig. 5 Per cent change of the polarization resistance at increasing concentration of specific odorants for human OR 17-40 at room temperature. Symbols refer to experiments, with bars giving the estimated uncertainty,14,15 dashed line refer to theoretical expectations. | ||
Finally, we notice that the dose-response depicted in Fig. 5 departs from the saturation behaviour observed for other receptors (like rat OR I7) where an increasing concentration of the specific ligand produces a systematic increase in the protein response.15 According to our conjecture, the origin of this difference should be found in the peculiar modification of the topology undergone by human OR17-40.
Protein impedance spectrum
The impedance spectrum of the single protein is explored over a wide range of frequencies and the results are given by means of the associated Nyquist plot. This plot is obtained by drawing the negative imaginary part versus the real part of the global impedance, within a given frequency range (typically from 1 mHz to 100 kHz, as in experiments14). Fig. 6 reports the Nyquist plots of human OR 17-40 with the impedance normalized to the static value of the native state. Symbols pertain to experiments, with crosses referring to the absence of a specific odorant, full (empty) squares to the presence of the specific odorant helional (heptanal) at the concentration reported in the figure. Curves pertain to theoretical results where the single protein is taken to be representative of the entire sample, and with continuous (dashed) lines referring to the native (active) state. Within our model, the Nyquist plots are obtained by using, as input data, the networks corresponding to the native and active states at the cut-off radius which, according to Fig. 5, gives the maximum resolution. The agreement between theory and experiments is found to be satisfactory from a qualitative point of view and, apart for a significant underestimation of the maximum experimental value, acceptable from a quantitative point of view. We note that the near ideal semicircle shape of the experimental Nyquist plot is well reproduced, thus confirming that the network impedance model behaves in a similar manner to a single RC circuit as expected by the presence of a rather uniform distribution of time constants associated with the different values of the resistance and capacitance of the links.17 The scarcity of experimental data and the lack of well certified knowledge for the 3D structures of the considered proteins lead us to consider these results as a first but significant step towards the microscopic modeling of the electrical properties of this olfactory receptor.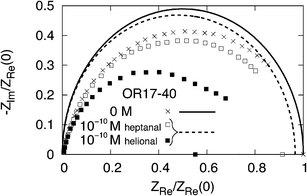 | ||
| Fig. 6 Nyquist plot of human OR 17-40 in the absence and presence of a specific ligand (heptanal, helional). The impedances are normalized to the static value of the native state, stack ZnatRe(0) = 33 KΩ cm2. Symbols pertain to experiments with: crosses referring to no odorant, empty (full) squares to an heptanal (helional) concentration of 10−10 M at room temperature.14,15 Curves pertain to theoretical results with: the continuous curve referring to the native state configuration as input data with Rc = 70 Å and the dashed line referring to the activate state configuration with Rc = 46 Å. | ||
Conclusions and perspectives
Recent EIS experiments on human OR 17-40 showed that the mechanism of odorant capture can be monitored by means of the modification of the impedance spectra.14 These results are generally confirmed by surface plasmon resonance and the bioluminescence response of appropriately prepared OR 17-40 samples.14,18 The EIS results are here microscopically interpreted on the basis of the conformational change of the protein tertiary structure, induced by the sensing action. Accordingly, the conformational change induces a variation of the protein electrical response that is detectable with the EIS technique and can be reproduced by means of the INPA modeling. In particular, a possible correlation between the interaction radius, Rc, at the basis of charge transfer between amino acids, and the odorant concentration, Λ, is inferred by comparing theory with experiments.From one side, the present INPA approach is rather essential and the qualitative agreement with available experiments is used as a proof of concept that is promising for the realization of an electronic nose based on an array of nanobiosensors. Furthermore, the narrow window of sensitivity of human OR 17-40 to the odorant concentration poses potential limitations in the advantages of receptor based biosensors in respect of traditional sensors. These limitations should be overcome by investigating similar ORs which are, like rat OR I7,17 potentially free from these drawbacks.
From another side, relevant information on the protein tertiary structure and the mechanisms of charge transfer can be extracted from the microscopic interpretation of experiments. The next step is the production of newly identified ORs in an efficient heterologous systems (mammalians or yeast cells) to evaluate their functional response. In parallel, improvements to the theoretical model should take into account the role of temperature, hydration, and other details.
Acknowledgements
This research is carried out within the bioelectronic olfactory neuron device (BOND) project sponsored by the CE within the 7th Program, grant agreement: 228685-2. Dr V. Akimov and the INRA UR1077 MIG, Jouy-en-Josas, France are gratefully acknowledged for providing the 3D structures of the OR 17-40. Dr E. Pajot (INRA UR1197 NOeMI, Jouy-en-Josas, France) is thanked for useful discussions on the subject.References
- W. Göpel, Sens. Actuators, B, 1998, 52, 125–142 CrossRef.
- Q. Liu, Biosens. Bioelectron., 2006, 22, 318 CrossRef CAS , and references therein.
- P. Duchamp-Viret, M. A. Chaput and A. Duchamp, Science, 1999, 284, 2171–2174 CrossRef CAS.
- Olfaction and Electronic Nose: Proc. 13 Int. Symposium. American Institute of Physics 978-0-7354-0674-2/09/S25.00, ed. M. Pardo and G. Sberveglieri, 2009pp. 115–118.
- (a) V. Jacquier, H. Pick and H. Vogel, J. Neurochem., 2006, 97, 537–544 CrossRef CAS; (b) C. H. Wetzel, J. Neurosci., 1999, 19, 7426–7433 CAS.
- T. D. Jones and R. R. Reed, Science, 1989, 244, 790–795 Search PubMed.
- (a) A. Triller, Chem. Biodiversity, 2008, 5, 862–886 CrossRef CAS; (b) R. C. Araneda, Nat. Neurosci., 2000, 3, 1248–1255 CrossRef CAS; (c) S. Katada, J. Neurosci., 2005, 25, 1806–1815 CrossRef CAS.
- BOND-Bioelectronic Olfactory Neuron Device, Collaborative project FP7-NMP-2008-SMALL-2, GA number 228685, http://bondproject.org/.
- E. Alfinito, C. Pennetta and L. Reggiani, Sens. Actuators, B, 2010, 142, 554–558 CrossRef.
- E. Alfinito and L. Reggiani, Phys. Rev., 2010, E 81, 032902 Search PubMed.
- E. Alfinito and L. Reggiani, Europhys. Lett., 2009, 85, 68002(1–6) CrossRef.
- M. Vestergaard, K. Kerman and E. Tamiya, Sensors, 2007, 7, 3442 CrossRef CAS.
- J. W. Gardner and P. N. BartlettSensor and Sensory systems of an electronic nose. Nato ASI Series 1991p. 212.
- I. V. Benilova, Materials Science & Engineering, 2008, C 28, 633–639 Search PubMed.
- Y. Hou, Biosens. Bioelectron., 2007, 22, 1550–1555 CrossRef CAS.
- M. Marrakchi, Eur. Biophys. J., 2007, 36, 1015–1018 CrossRef CAS.
- E. Alfinito, C. Pennetta and L. Reggiani, J. Appl. Phys., 2009, 105, 084703-1-6 CrossRef.
- J. Vidic, Lab Chip, 2006, 6, 1026–1032 RSC.
- G. Levasseur, Eur. J. Biochem., 2003, 270, 2905–2912 CrossRef CAS.
- H. M. Berman, Nucleic Acids Res., 2000, 28, 235 CrossRef CAS.
- S. E. Hall, Chem. Senses, 2004, 29, 595–616 CrossRef CAS.
- (a) B. K. Kolbika and X. Deupi, Trends Pharmacol. Sci., 2007, 28, 397–406 CrossRef; (b) O. Miyashita, P. G. Wolynes and J. N. Onuchic, J. Phys. Chem. B, 2005, 109, 1959–1969 CrossRef CAS.
| This journal is © The Royal Society of Chemistry 2011 |
