Enhanced stabilization of vesicles formed in mixed cationic and anionic surfactant systems by compressed gases†
Wei
Li
,
Jianling
Zhang
*,
Buxing
Han
* and
Yueju
Zhao
Beijing National Laboratory for Molecular Sciences, Key Laboratory of Colloid and Interface and Thermodynamics, Institute of Chemistry, Chinese Academy of Sciences, China. E-mail: zhangjl@iccas.ac.cn; hanbx@iccas.ac.cn; Fax: 86-10-62559373; Tel: 86-10-62562821
First published on 24th August 2011
Abstract
Herein we investigated the effects of six hydrocarbon gases (methane, ethane, propane, ethylene, propylene and isobutene) on mixed cationic–anionic surfactant solutions by phase behavior observation, turbidity, conductivity, and fluorescence spectra. It was found that all these gases could enhance the stability of vesicles formed in the mixed surfactant solutions. The pressure for the stable vesicle formation is decreased with the increasing gas molecular chain length. The possible mechanism for the enhanced vesicle stability by compressed gases was discussed.
1. Introduction
Vesicles in aqueous solutions can be defined as supramolecular self-assembled aggregates of nanoscale dimensions, which have a lipid bilayer membranous structure with an inner aqueous phase. For a long time, the formation of vesicles required the input of considerable mechanical energy, elaborate chemical treatments, and the use of specifically designed surfactants. In 1989, Kaler et al. gave the first example of spontaneous vesicle formation from mixed cationic and anionic single chain surfactants.1 Since then, catanionic vesicles, i.e., vesicles formed by mixed cationic and anionic amphiphiles, have been extensively investigated in the last twenty years due to their interest from a fundamental point of view2–12 and great potential in several applications, such as drug and gene delivery,13,14 templating nanomaterials,15–17 and gelation.18–21 To enhance the vesicle stability, some additives such as organic cosolvents or cosurfactants have been used.22–24 However, the addition of these solid or liquid additives to surfactant solutions usually suffers from economic and environmental costs, and makes the post treatment much more difficult.25 To develop effective and convenient methods for creating and stabilizing vesicles formed from cheap cationic–anionic surfactant mixtures is very interesting and challenging.In a previous work, we studied the effect of compressed CO2 on the stability of vesicles formed in a dodecyltrimethylammonium bromide (DTAB)/sodium dodecyl sulfate (SDS) mixed surfactant system.26 It was discovered that compressed CO2 could enhance the stability of vesicles significantly.26 A presumed mechanism was proposed that CO2 molecules could penetrate into the vesicle membrane formed by the mixed surfactant. Herein we further studied the effects of some hydrocarbon gases, methane, ethane, propane, ethylene, propylene and isobutene, on the mixed surfactant solutions. It was found that all these hydrocarbon gases could enhance the stability of vesicles formed in the mixed surfactant solutions, indicating this method is versatile. Moreover, the results provide more detailed information on the mechanism of enhanced vesicle stability by compressed gases.
2. Experimental section
2.1 Materials
DTAB (A. R. Grade) and SDS (A. R. Grade) were purchased from Shanghai Shanpu Chemical Corporation and Tianjin Jinke Fine Chemical Institute, respectively. They were recrystallized five times from ethanol–acetone mixed solvent before use. The fluorescent probes of 2-(p-toluidino) naphthalene-6-sulfonate (TNS, A. R. Grade) and 6-propionyl-2-(dimethylamino)-naphthalene (prodan, A. R. Grade) were purchased from Sigma and Fluka, respectively. Ethylene, methane, ethane, and propane (>99.9% purity) were provided by Beijing Analytical Instrument Factory. Propylene and isobutane (>99.9% purity) were provided by Beijing Zhaoge gases technologies Co., Ltd. Double-distilled water was used throughout the experiments.2.2 Phase behavior observation
The apparatus and procedures to study the phase behavior of the mixed surfactant system were the same as those used previously.27 The apparatus consisted mainly of a view cell (34.0 mL) with magnetic stirrer, a high-pressure pump (DB-80), a constant-temperature water bath, and a pressure gauge. The accuracy of the pressure gauge, which was composed of a transducer (FOXBORO/ICT, Model 93) and an indicator, was ±0.025 MPa within the pressure range of 0–20 MPa. The temperature of the water bath was controlled by using an HAAKE D8 temperature controller with an accuracy of ±0.1 °C.In the experiment, the aqueous solutions of DTAB and SDS were first prepared separately, and the surfactant concentration was 10.0 mM. Then, the two surfactant solutions of equal volume were loaded into the view cell, and the stirrer was started. The view cell was placed in a water bath of 30.0 °C. After thermal equilibrium had been reached, the gas was charged into the view cell to a suitable pressure. The surfactant solution was stirred for 30 min, and then the stirrer was stopped. The photograph of the surfactant solution was taken after 10 h when the system was stable.
2.3 Turbidity determination
UV-vis spectroscopy was used to study the turbidity and micropolarity of the mixed surfactant system with and without compressed gas. The apparatus and procedures were similar to those reported previously.28,29 The apparatus consisted mainly of a gas cylinder, a high-pressure pump, a pressure gauge, a UV-vis spectrometer, a temperature-controlled high-pressure UV sample cell. The UV-vis spectrophotometer was produced by Beijing General Instrument Company (Model TU-1201) with a resolution of 0.1 nm. The sample cell was composed mainly of a stainless steel body, two quartz windows, a stirrer, and a temperature-controlling system. The optical path length and the inner volume of the cell were 2.1 cm and 8.8 mL, respectively.To determine the turbidity, the absorbance at the wavelength of 514.5 nm was monitored where no absorbance was observed for the mixed surfactant system.30,31 In the experiment, the two surfactant solutions of equal volume (Ctotal = 10.0 mM) were charged into the sample cell at 30.0 °C and the solution was stirred. The compressed gas was then pumped into the sample cell to the desired pressure. The stirrer was stopped after 1 h, and the UV-vis spectra were recorded at different times.
2.4 Conductivity measurement
The apparatus for conductivity measurements was similar to that for studying the reverse micellar solutions reported previously.32 It consisted mainly of a high-pressure stainless steel vessel, a conductivity cell, a constant temperature water bath, a high pressure syringe pump, a pressure gauge, a magnetic stirrer, and a gas cylinder. The temperature of the water bath was controlled using a Haake-D8 controller. Both the working electrode and counter electrode were made of 0.3 mm thick Pt foil. The conductivity was determined by a conductivity meter with a precision of ±0.5%, which was produced by Shanghai Precision Scientific Instrument Co., Model DDS-307). The cell constant was calibrated with KCl aqueous solutions.In a typical experiment, the suitable amount of DTAB/SDS solution was charged into the high-pressure vessel. The sealed stainless steel vessel was placed in a constant-temperature water bath at 30.0 °C. After thermal equilibrium had been reached, the gas was charged into the system until the suitable pressure was reached. A magnetic stirrer was used to enhance the dissolution of gas in the solution. After the system was stabilized, which was known from the fact that both the pressure and the conductivity were independent of time, the conductivity was recorded.
2.5 Fluorescence spectra study
Steady-state fluorescence spectra experiments were carried out with a HITACHI F-2500 fluorescence spectrophotometer connected to a PC computer, and the high-pressure fluorescence cell was similar to that used previously.33 TNS and prodan were used as the probes. Excitation wavelengths of 330 nm and 340 nm were chosen for TNS and prodan, respectively, and the emission wavelengths for the two probes were varied from 340 and 350 to 600 nm, respectively. In all cases, the excitation and emission slit widths were kept at 2.5 nm and the scan rate was 60 nm min−1. The final concentration of TNS and prodan in the surfactant solution were 10.0 μM and 5.0 μM, respectively.In the experiment, the two surfactant solutions of equal volume (Ctotal = 10.0 mM) were charged into the high-pressure fluorescence cell of 30.0 °C and the solution was stirred. Then gas was pumped into the sample cell to the desired pressure. The stirrer was stopped after 1 h, and the fluorescence spectra were recorded.
The fluorescence spectra were analyzed by deconvolution into overlapping Gaussian curves using the nonlinear least-square-fitting method. An iterative Marquardt-Levenberg fitting algorithm was utilized to obtain the minimum number of reproducible absorbing components, using the adjustable parameters of the center, width, and amplitude of each Gaussian curve. The percent area of each Gaussian curve was also calculated. The square of the multiple correlation coefficient, r2, was better than 0.999 in all the cases.
3. Results and discussion
3.1 Phase behavior
In the absence of gases, the equimolar DTAB/SDS aqueous system is composed of a dispersion of catanionic precipitate.34 The phase behavior of the DTAB/SDS mixed surfactant solution in the presence of the six hydrocarbon gases, methane, ethane, propane, ethylene, propylene and isobutene, was observed. As an example, Fig. 1 shows the photographs of DTAB/SDS mixed surfactant solution with ethylene at different pressures. In the absence of ethylene, phase separation occurred quickly after the two surfactant solutions were mixed, and the DTAB/SDS mixed surfactant system was turbid (photograph a). With the addition of ethylene, the turbid system became more and more transparent (photographs b–e), and became transparent when the pressure was higher than 4.50 MPa (photographs f and g), and they kept their stabilities for more than two months. Similar results were observed for the other five gases of methane, ethane, propane, propylene and isobutene, i.e. the turbid system became clearer and clearer, and finally became transparent as the pressure was higher than a certain value (See Fig. S1, ESI†).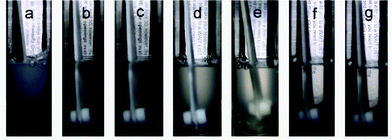 | ||
| Fig. 1 Photographs of DTAB/SDS mixed surfactant solution with ethylene at 0 MPa (a), 2.5 MPa (b), 2.9 MPa (c), 3.5 MPa (d), 4.0 MPa (e), 4.5 MPa (f), and 5.0 MPa (g). | ||
3.2 Turbidities
The turbidity of DTAB/SDS mixed surfactant solution with compressed ethylene at different pressures was measured by UV-vis absorbance spectra and the results are shown in Fig. 2. Clearly, the turbidity is decreased with the increasing pressure. As the pressure is higher than 4.50 MPa, the absorbance drop with the increasing pressure is small. This is consistent with the results of phase behavior investigation. Herein we define the pressure at which the mixed surfactant solution keeps clear (i.e., no precipitation in the system) as the critical vesicle pressure (PV). The critical vesicle pressures of the six gases of methane, ethane, propane, ethylene, propylene and isobutene were determined to be 11.75 MPa, 3.20 MPa, 0.68 MPa, 4.50 MPa, 1.07 MPa, and 0.22 MPa, respectively. Evidently, the critical vesicle pressure is decreased with the increasing gas molecular chain length.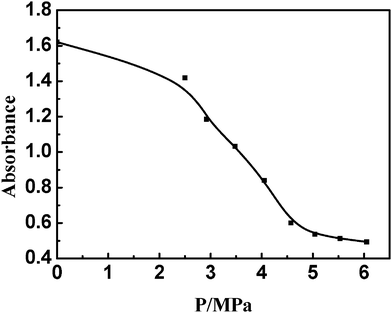 | ||
| Fig. 2 Dependence of turbidity variations in DTAB/SDS mixed surfactant solution on the ethylene pressure. | ||
3.3 Conductivities
Conductivity determination is one of the most useful techniques to provide the information on microstructures of micelles.35,36 Herein it was employed to determine the ion variation of the mixed surfactant solutions in the presence of compressed gas. As an example, Fig. 3 shows the conductivity of the SDS/DTAB solution at different ethylene pressures. The conductivity is decreased gradually with increasing pressure and levels off as the pressure is higher than the critical vesicle pressure (4.50 MPa). This can be explained by the double-layer theory, modeling the catanionic vesicles with the cell geometry.37 The mixed vesicle contains both surfactants and has a net charge equal in sign to that of the surfactant present in excess. The conductivity of the catanionic solution was dominated by the free ions in the solution.37 In the absence of gas, the conductivity was large, because much free ions were formed from precipitation. With the addition of gas, the free ions formed from precipitation were less and more ions were kept in the double layer to form the vesicles in the solution. Therefore, the conductivity decreased, and the vesicles were stabilized by the compressed gas. When the pressure reached the critical vesicle pressure, the vesicles assembled from the mixed surfactants were all stabilized by the gas and there was no precipitate in the solution. So the conductivity reached its minimum, and did not change obviously when the pressure increased. The conductivities of the system stabilized by other compressed gases at their respective critical vesicle pressures were almost the same with that stabilized by ethylene (3505 ± 15 μS cm−1, see Fig. S2, ESI†), which is in agreement with the above results.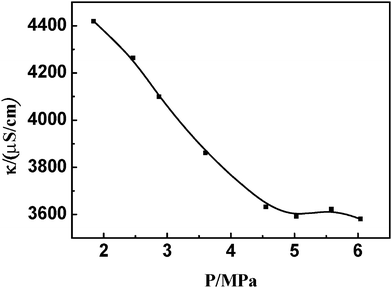 | ||
| Fig. 3 Dependence of conductivity variations in DTAB/SDS mixed surfactant solution with ethylene pressure. | ||
3.4 Fluorescence spectra
The gas-present vesicles were further characterized by steady-state fluorescence spectroscopy. TNS and prodan were used as complementary fluorescent probes, which are quite advantageous in analyzing the surface and interior of mixed aggregates constituted by cationic and anionic components.38–40 Both of them emit weakly in water but exhibit intense fluorescence upon binding to a macromolecule or membrane surface.41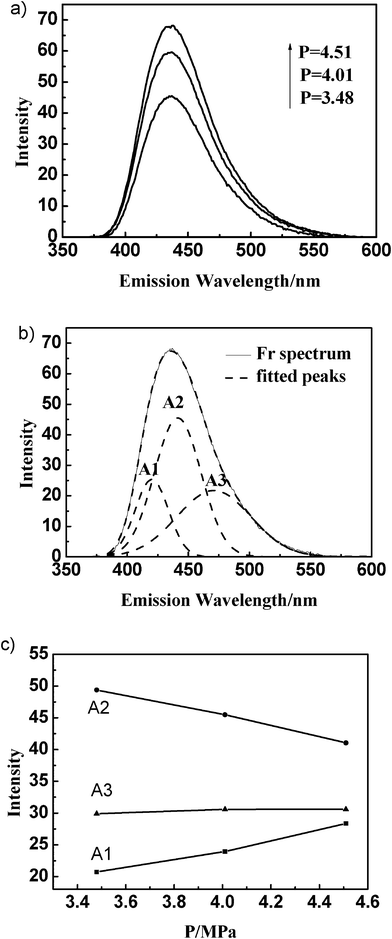 | ||
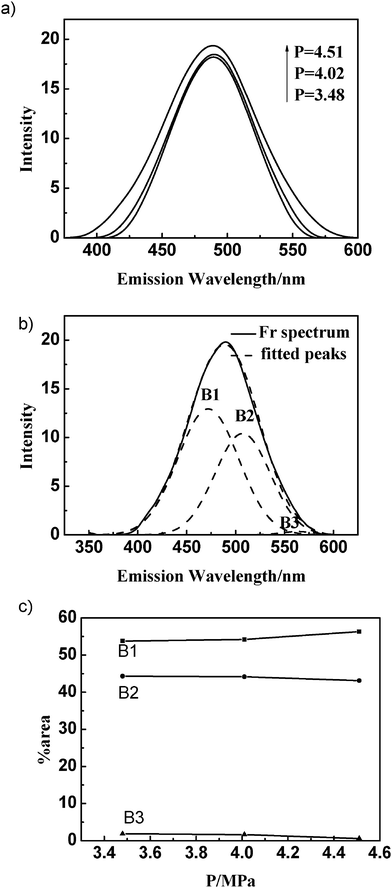
| Fig. 4 Fluorescence spectra of TNS in DTAB/SDS mixed surfactant solution at different ethylene pressures (a); Resolution of TNS fluorescence spectrum (b); Percentage contribution (% area) of Gaussian peaks of TNS fluorescence emission at different ethylene pressures (c). | ||
The fluorescence spectra of TNS in the DTAB/SDS mixed solution with the other five gases were also determined at their respective critical vesicle pressures. The changes of percentage contribution (% area) of the Gaussian components of TNS emission with various gases at their critical pressures are presented in Fig. 5. It was shown clearly that A1 and A2 decreased, while A3 increased with increasing of the gas molecular chain length, indicating that more TNS molecules were situated at the interface of vesicles in the presence of larger gas molecules at the critical vesicle pressure. This may be due to the different penetration capability of gas molecules into the vesicles. The smaller gas molecules can easily penetrate into the bilayer region of vesicles, while the larger gas molecules are more likely to settle at the interface of vesicles.
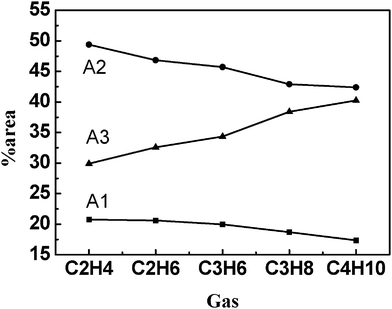 | ||
| Fig. 5 Percentage contribution (% area) of Gaussian peaks of TNS fluorescence emission in DTAB/SDS/gas solutions at their respective critical vesicle pressures. | ||
 | ||
| Fig. 6 Fluorescence spectra of prodan in DTAB/SDS mixed surfactant solutions at different ethylene pressures (a); Resolution of prodan emission spectrum for DTAB/SDS aqueous solutions (b); Percentage contribution (% area) of Gaussian peaks of prodan fluorescence emission at different ethylene pressures (c). | ||
Fig. 7 shows the percentage contribution (% area) of the Gaussian components of prodan emission with various gases at their respective critical vesicle pressures. It was shown clearly that B1 and B3 decreased, while B2 increased with increasing gas molecular size, implying that more prodan molecules were situated at the interface of vesicles in the presence of gas with larger molecular size. The result is similar to that obtained for the TNS emission. The above results also showed that the nonionic probe prodan is located more deeply in the hydrophobic core than the anionic probe TNS, as previously found for other cationic–nonionic mixed vesicles.8
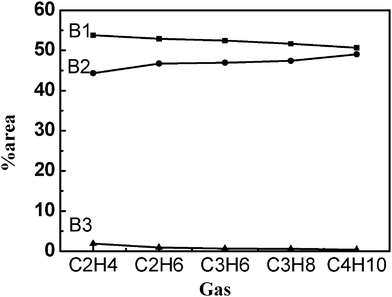 | ||
| Fig. 7 Percentage contribution (% area) of Gaussian peaks of prodan fluorescence emission in DTAB/SDS/gas solutions at their respective critical vesicle pressures. | ||
3.5 Mechanism discussion
To get further information on the mechanism of the compressed gas-enhanced vesicle stability, we investigated the effects of other gases, nitrogen and hydrogen, which are immiscible with the hydrophobic solvent, on the DTAB/SDS mixed surfactant solutions. The phase behavior similar to Fig. 1 was not observed, i.e. no stable vesicles were induced in the mixed surfactant solution by nitrogen or hydrogen. This means that the lipophilic feature of gas is dominant to stabilizing vesicles, in other words, the solubilization of hydrocarbon gases in vesicles plays a significant role in stabilizing the vesicles.As we discussed above, the critical vesicle pressure is an important factor for the mixed system stabilized by the compressed gases. When the pressure of the system was below the critical vesicle pressure, there was a co-existence of precipitates and vesicles. As the critical vesicle pressure was reached, the precipitates disappeared and the amounts of vesicles produced was at a maximum. For different gases, the critical vesicle pressure is decreased with increasing gas molecular chain length, i.e. less gas is needed for the formation of stable vesicles by the larger gas molecules. As revealed by fluorescence spectra, the smaller gas molecules can penetrate the bilayer region of vesicles more easily, while the larger gas molecules are more likely to situate at the interface of vesicles. It seems that the gas molecules at the interface of vesicles plays a more important role in stabilizing the vesicles than those inside the bilayer. Thus it is easily understood that less gas is needed for the formation of stable vesicles by the larger gas molecules. This is consistent with our assumption in previous work that the insertion of CO2 molecules in the vesicle membrane can increase the rigidity of the membrane and the curvature of the outer layer, thus resulting in the formation of stable vesicles.26
Conclusions
It was found that the hydrocarbon gases of methane, ethane, propane, ethylene, propylene and isobutene could enhance the stability of vesicles formed in the SDS/DTAB mixed surfactant solutions. The critical vesicle pressure is decreased with increasing gas molecule size. The smaller gas molecules could penetrate into the inner bilayer of vesicles more easily, while larger gas molecules were likely to accumulate at the interface of the vesicles. We believe this method to stabilize the vesicles by compressed gases can be used in other mixed catanionic systems.Acknowledgements
The authors thank the National Natural Science Foundation of China (20633080, 20873164).References
- E. W. Kaler, A. K. Murthy, B. Rodriguez and J. A. N. Zasadzinski, Science, 1989, 245, 1371 CAS.
- A. K. Murthy, E. K. Kaler and J. A. N. Zasadzinski, J. Colloid Interface Sci., 1991, 145, 598 CrossRef CAS.
- E. W. Kaler, K. L. Herrington, A. K. Murthy and J. A. Zasadzinski, J. Phys. Chem., 1992, 96, 6698 CrossRef CAS.
- S. Chirovulu, J. N. Israelachvili, E. Naranjo, Z. Xu, J. A. Zasadzinski, E. W. Kaler and K. L.Herrington, Langmuir, 1995, 11, 4256 CrossRef.
- M. T. Yatcilla, K. L. Herrington, L. L. Brasher, E. W Kaler, S. Chiruvolu and J. A. Zasadzinski, J. Phys. Chem., 1996, 100, 5874 CrossRef CAS.
- E. F. Marques, O. Regev, A. Khan, M. d. G. Miguel and B. Lindman, J. Phys. Chem. B, 1998, 102, 6746 CrossRef CAS.
- E. F. Marques, O. Regev, A. Khan, M. d. G. Miguel and B. Lindman, J. Phys. Chem. B, 1999, 103, 8353 CrossRef CAS.
- E. Marques, Langmuir, 2000, 16, 4798 CrossRef CAS.
- S. A. Safran, P. Pincus and D. Andelman, Science, 1990, 248, 354 CAS.
- P. K. Yuet and D. Blankschtein, Langmuir, 1996, 12, 3802 CrossRef CAS.
- C. Z. T. Vautrin, M. Schneider and M. Tanaka, J. Phys. Chem. B, 2004, 108, 7986 CrossRef CAS.
- J. Hao, Z. Yuan, W. Liu and H. Hoffmann, J. Phys. Chem. B, 2004, 108, 5105 CrossRef CAS.
- R. S. Dias, B. Lindman and M. G. Miguel, J. Phys. Chem. B, 2002, 106, 12600 CrossRef CAS.
- R. S. Dias, B. Lindman and M. G. Miguel, J. Phys. Chem. B, 2002, 106, 12608 CrossRef CAS.
- H. P. Hentze, S. R. Raghavan, C. A. Mckelvey and E. W. Kaler, Langmuir, 2003, 19, 1069 CrossRef CAS.
- D. Lootens, C. Vautrin, H. Van Damme and T. Zemb, J. Mater. Chem., 2003, 13, 2072 RSC.
- C. A. Mckelvey, E. W. Kaler, J. A. Zasadzinski, B. Coldren and H. T. Jung, Langmuir, 2000, 16, 8285 CrossRef CAS.
- F. E. Antunes, E. F. Marques, R. Gomes, K. Thuresson, B. Lindman and M. G. Miguel, Langmuir, 2004, 20, 4647 CrossRef CAS.
- E. F. Marques, O. Regev, A. Khan, M. G. Miguel and B. Lindman, Macromolecules, 1999, 32, 6626 CrossRef CAS.
- J.-H. Lee, J. P. Gustin, T. H. Chen, G. F. Payne and S. R Raghavan, Langmuir, 2005, 21, 26 CrossRef CAS.
- D. D. Lasic, R. Joannic, B. C. Keller, P. M. Frederik and L. Auvray, Adv. Colloid Interface Sci., 2001, 89–90, 337 CrossRef CAS.
- J. B. Huang, B. Y. Zhu, G. X. Zhao and Z. Y. Zhang, Langmuir, 1997, 13, 5759 CrossRef CAS.
- E. Feitosa, N. M. Bonassi and W. Loh, Langmuir, 2006, 22, 4512 CrossRef CAS.
- R. O. Brito, E. F. Marques, P. Gomes and O. So1derman, J. Phys. Chem. B, 2006, 110, 18158 CrossRef CAS.
- Y. Liu, P. G. Jessop, M. Cunningham, C. A. Eckert and C. L. Liotta, Science, 2006, 313, 958 CrossRef CAS.
- W. Li, J. L. Zhang, B. X. Han, S. Q. Cheng, C. X. Zhang and X. Y. Feng, Langmuir, 2009, 25, 196 CrossRef CAS.
- W. Li, J. L. Zhang, Y. J. Zhao, M. Q. Hou, B. X. Han, C. L. Yu and J. P. Ye, Chem.–Eur. J., 2010, 16, 1296 CrossRef CAS.
- R. Zhang, J. Liu, J. He and B. X. Han, Macromolecules, 2002, 35, 7869 CrossRef CAS.
- J. Lu, B. X. Han and H. K. Yan, Phys. Chem. Chem. Phys., 1999, 1, 3269 RSC.
- H. Q. Yin, J. B. Huang, Y. Y. Lin, Y. Y. Zhang, S. C. Qiu and J. P. Ye, J. Phys. Chem. B, 2005, 109, 4104 CrossRef CAS.
- H. Q. Yin, J. B. Huang, Y. Q. Gao and H. L. Fu, Langmuir, 2005, 21, 2656 CrossRef CAS.
- D. Shen, B. X. Han, Y. Dong, J. W. Chen, T. C. Mu, W. Z. Wu and J. L. Zhang, J. Phys. Chem. B, 2005, 109, 5796 CrossRef CAS.
- D. X. Liu, J. L. Zhang, J. F. Fan, B. X. Han and J. Chen, J. Phys. Chem. B, 2004, 108, 2851 CrossRef CAS.
- K. L. Herrington, E. W. Kaler, D. D. Miller, J. A. Zasadzinski and S. Chiruvolu, J. Phys. Chem., 1993, 97, 13792 CrossRef CAS.
- C. Tondre and C. Caillet, Adv. Colloid Interface Sci., 2001, 93, 115 CrossRef CAS.
- E. F. Marques, O. Regev, A. Khan and B. Lindman, Adv. Colloid Interface Sci., 2003, 100, 103 CrossRef.
- K. Holmberg, D. O. Shah, and M. J. Schwuger. in Handbooks of applied surface and colloid chemistry, (John Wiley & Sons, Ltd.), Vol. 2, pp 45 Search PubMed.
- K. K. Kerry, A. Z. Candace and J. F. Marja, Langmuir, 2003, 19, 10054 CrossRef.
- E. Aicart, P. d. Burgo, O. Llorca and E. Junquera, Langmuir, 2006, 22, 4027 CrossRef CAS.
- E. Junquera, P. d. Burgo, J. Boskovic and E. Aicart, Langmuir, 2005, 21, 7143 CrossRef CAS.
- R. M. Minardi, P. C. Schulz and B. Vuano, Colloids Surf., A, 2002, 197, 167 CrossRef CAS.
Footnote |
| † Electronic Supplementary Information (ESI) available: photographs of mixed surfactant solutions in the presence of methane, ethane, propane, propylene and isobutene. See DOI: 10.1039/c1ra00237f/ |
| This journal is © The Royal Society of Chemistry 2011 |
