Acid-driven, microwave-assisted production of photoluminescent carbon nitride dots from N,N-dimethylformamide†
Sen
Liu
a,
Lei
Wang
a,
Jingqi
Tian
ab,
Junfeng
Zhai
a,
Yonglan
Luo
a,
Wenbo
Lu
a and
Xuping
Sun
*a
aState Key Lab of Electroanalytical Chemistry, Changchun Institute of Applied Chemistry, Chinese Academy of Sciences, Changchun, 130022, Jilin, China. E-mail: sunxp@ciac.jl.cn; Fax: (+86) 431-85262065; Tel: (+86) 431-85262065
bGraduate School of the Chinese Academy of Sciences, Beijing, 100039, China
First published on 16th September 2011
Abstract
In this communication, we report on acid-driven, microwave-assisted production of fluorescent carbon nitride dots (CNDs) on a large scale by microwave irradiation of N,N-dimethylformamide (DMF) solution in the presence of acids including chlorosulfonic acid (CSA), H2SO4, HCl, or HNO3. It suggests these CNDs are well water-soluble and exhibit strong fluorescence.
During the past years, fluorescent semiconductor quantum dots (QDs) have received considerable attention due to their unique optical and biochemical properties, which ensure their significant practical applications in optoelectronic devices, biological labelling and bioimaging etc.1 However, such QDs suffer from some serious health and environment concerns due to the use of heavy metals, which limits their wide applications.2 As a result, much attention has also been paid to developing new nanomaterials with similar optical properties.3 Fluorescent carbon dots (CDs) have recently attracted much interest due to their low toxicity, easy labelling, and high stability and have been widely used for bioimaging and optical imaging.4 Several preparative methods have been developed so far, including laser ablation of graphite or carbon powder,5 carbonizing polymerized resols on silica spheres,6 electrochemical release or exfoliation from a graphite source,7 chemical oxidation of activated carbon or graphite,8 separation combusted carbon soot,9 thermal oxidation of suitable molecular precursors,10 dehydration of carbohydrates,11 hydrothermal route for cutting graphene sheets,12 and proton-beam irradiation of nanodiamonds13etc.
On the other hand, carbon nitride materials have been the focus of materials research because of their unique properties and wide applications in catalysis, sensors, and corrosion protection etc.14 Recently, we have developed a heat-treatment-based strategy for production of fluorescent carbon nitride dots (CNDs) by polymerization of CCl4 and 1,2-ethylenediamine.15 In this communication, we report on acid-driven, microwave-assisted production of fluorescent CNDs on a large scale by microwave irradiation of N,N-dimethylformamide (DMF) solution in the presence of acids including chlorosulfonic acid (CSA), H2SO4, HCl, or HNO3. It is found that CNDs thus obtained are well water-soluble and exhibit strong fluorescence.
DMF, H2SO4, HCl, HNO3 and CSA were purchased from Aladin Ltd. (Shanghai, China). All the chemicals were used as received without further purification. The water used throughout all experiments was purified through a Millipore system. Fluorescent CNDs were prepared by microwave irradiation of DMF solution in the presence of CSA. In a typical synthesis, 0.5 mL of CSA was added into 5 mL of DMF solution. After that, the mixture was directly placed in a domestic microwave oven and irradiated at 700 W for 40 s. The resultant CNDs were dispersed in water for further characterization. CNDs were similarly prepared using other acids such as H2SO4, HCl, HNO3 (designated as CNDs-S, CNDs-C, and CNDs-N, respectively). After microwave heating of the DMF solution in the presence of various acids, the products thus obtained was added into 5 mL of H2O. The excess precursors were removed by dialyzing against water through a dialysis membrane for 1 day.
UV-vis spectra were obtained on a UV5800 Spectrophotometer. Transmission electron microscopy (TEM) measurements were made on a HITACHI H-8100 electron microscopy (Hitachi, Tokyo, Japan) with an accelerating voltage of 200 kV. The sample for TEM characterization was prepared by placing a drop of colloidal solution on carbon-coated copper grid and dried at room temperature. Fluorescent emission spectra were recorded on a RF-5301PC spectrofluorometer (Shimadzu, Japan). X-ray photoelectron spectroscopy (XPS) analysis was measured on an ESCALAB MK II X-ray photoelectron spectrometer using Mg as the exciting source. FT-IR spectrum was performed on an IFS 66V/S (Bruker) IR spectrometer in the range of 400–4000 cm−1.
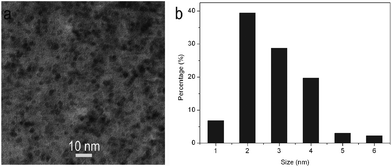
Fig. 1a shows the TEM image of products thus formed, which indicates that the products consist of small particles and are well separated from each other. The corresponding particle size distribution histograms shown in Fig. 1b indicate that these particles have diameters ranging from 1 to 6 nm. All these observations indicate the formation of nanoparticles. It is important to mention that the aqueous dispersion of these nanoparticles can be stable for several weeks. The Zeta potential of such nanoparticles is measured to be about 5.45 mV, indicating they are positively charged in surface. The electrostatic repulsions between them are responsible for the formation of stable dispersion.
 | ||
| Fig. 1 (a) TEM image and (b) the corresponding particles size distribution histograms of the products obtained by microwave irradiation of 5 mL of DMF solution in the presence of 0.5 mL of CSA for 40 s. | ||
The surface composition and element analysis for the overall composition of the resultant nanoparticles were characterized by XPS technique. The XPS spectrum of the nanoparticles shown in Fig. S1† exhibits three peaks at 285.9, 401.8 and 531.0 eV, which are attributed to C1s, N1s, and O1s, respectively.16 Other two peaks at 168.1 and 232.6 eV associated with S2p and S2s are also observed. XPS results show that nanoparticles thus obtained are mainly composed of C, N (the ratio of N to C is 0.61) and limited amount of O and S elements. O atom and S atom may come from the O2, H2O or CO2, and H2SO4 adsorbed on the surface of particles, respectively. Furthermore, the C1sspectrum of these nanoparticles (Fig. S2†) exhibits three peaks at 284.5, 285.7 and 288.4 eV, which are attributed to C–C, C–N(sp2) and C–N(sp3), respectively. The N1sspectrum of such nanoparticles (Fig. S3†) exhibits three peaks at 399.1, 400.2 and 401.2 eV, which are associated with C–N–C, N–(C)3 and N–H groups, respectively.17 The FT-IR spectrum (Fig. S4†) exhibits two strong bands at 1094 and 1506 cm−1, which attributed to the C–N and C![[double bond, length as m-dash]](https://www.rsc.org/images/entities/char_e001.gif) N stretching ring, respectively. Another two bands at 1602 and 2979 cm−1 attributed to N–H groups are also observed. Furthermore, heptazine units at 822 cm−1 are observed in the FT-IR spectrum for the sample, revealing that the local structure of nanoparticles thus obtained is composed of CN units.18 All these observations indicate these particles are carbon nitride nanoparticles.
N stretching ring, respectively. Another two bands at 1602 and 2979 cm−1 attributed to N–H groups are also observed. Furthermore, heptazine units at 822 cm−1 are observed in the FT-IR spectrum for the sample, revealing that the local structure of nanoparticles thus obtained is composed of CN units.18 All these observations indicate these particles are carbon nitride nanoparticles.
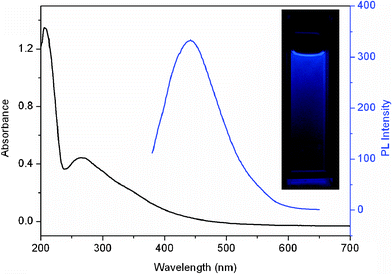
Fig. 2 shows the UV-vis adsorption (black line) and photoluminescence (PL) spectra (blue line) of the CNDs dispersion. It is seen that the UV-vis spectrum shows a strong adsorption peak at 266 nm. Note that a strong PL emission spectrum centered at 443 nm was observed when it was excited at 360 nm, indicating the production of fluorescent CNDs. The photograph of CNDs dispersion under UV light (365 nm) exhibits a obvious blue colour (inset), further revealing that the resultant CNDs exhibit strong blue fluorescence. Compared to the previous methods for preparation of carbon nitride materials with large particle size,14b,hcarbon nitride materials obtained in our present study have small size about 1–6 nm in diameter, and their aqueous dispersion is well stable and exhibits strong photoluminescence.
 | ||
| Fig. 2 UV-vis adsorption (black line) and photoluminescence (PL) spectra (blue line) of the CNDs dispersion. Inset: the photograph of CNDs dispersion under UV light (365 nm). | ||
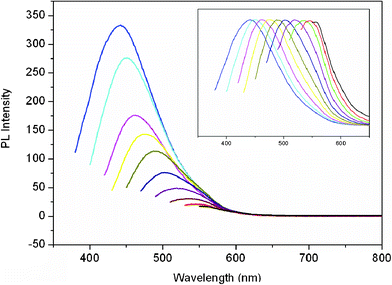
Fig. 3 shows the PL emission spectra of the CNDs dispersion with various excitation wavelengths from 360 to 540 nm. It is seen that the emission spectrum of the CNDs thus obtained changes from violet (∼430 nm) to yellowish-green (∼550 nm), with a dependence on the excitation wavelengths from 360 to 540 nm. The emission peak position shifts to longer wavelengths and the intensity gradually decreases with increased excitation wavelengths. It is found that the full width of a half maximum (FWHM) at 360 nm is about 100 nm, and the quantum yields of CNDs is 9% (ESI†).
 | ||
| Fig. 3 PL emission spectra (with progressively longer excitation wavelengths from 360 nm to 540 nm on the left in 20 nm increment) of the CNDs dispersion. Inset: The normalized PL emission spectra. | ||
We studied the effect of the pH value of the dispersion on the CNDs fluorescence. It is seen that an increase of pH value from 1 to 5 leads to increased fluorescence intensity, but further increase to 13 results in a gradual decrease of fluorescence intensity, indicating the fluorescence intensity of CNDs strongly depends on the pH value (Fig. S5†). Note that the PL intensity of the CNDs exhibits no obvious decrease after 10-h excitation at 365 nm with a UV-lamp (Fig. S6†), indicating the stable PL of the CNDs.
We also examined the effect of microwave irradiation time on the PL emission of the products thus formed. It is seen that the products exhibit no PL by microwave irradiation for 20 s (Fig. S7†). It is also found that products obtained by microwave irradiation for 40 s exhibit stronger PL than that obtained for 30 s irradiation, but the further increase of irradiation time up to 50 s leads to decreased fluorescence. These observations indicate that too short irradiation time is not sufficient for the formation of CNDs but too long irradiation time produces CNDs with weaker PL.
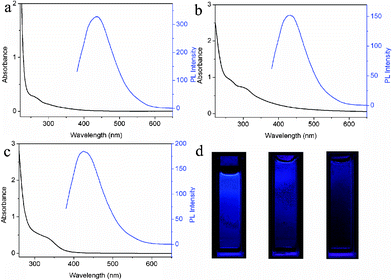
We also performed one control experiment by microwave irradiation of DMF solution in the absence of CSA. It is found that no fluorescent CNDs are formed even with a longer irradiation time of 3 min, indicating that CSA plays an important role in formation of CNDs. It should be pointed out the use of inorganic acids such as H2SO4, HCl, and HNO3 also yields CNDs, under otherwise identical conditions. Fig. 4a–c show the UV-vis adsorption and PL spectra of CNDs-S, CNDs-C, and CNDs-N, respectively, revealing all the CNDs exhibit strong absorption and PL under excitation wavelength at 365 nm. Fig. 4d shows the corresponding photographs. It is well-known that DMF can decompose into CO and dimethylamine under high temperature with the use of acids as catalysts.19 In our present study, the use of acid is key to the formation of fluorescent CNDs, that is, the formation of CNDs from DMF is driven by acids which may serve as catalysts. However, the exact formation mechanism of CNDs is not completely understood at present time and requires further study.
 | ||
| Fig. 4 UV-vis adsorption and PL emission spectra of (a) CNDs-S, (b) CNDs-C, and (c) CNDs-N, respectively. (d) The corresponding photographs in water under UV light (365 nm) of CNDs-S (left), CNDs-C (middle), and CNDs-N (right), respectively. | ||
In summary, fluorescent CNDs have been successfully prepared by microwave irradiation of DMF in the presence of various acids, such as CSA, H2SO4, HCl or HNO3. Our study is important because it provides us a novel, simple method for rapid preparation of fluorescent CNDs on a large scale for applications.
Acknowledgements
This work was supported by National Basic Research Program of China (No. 2011CB935800).References
- (a) X. Peng, L. Manna, W. Yang, J. Wickham, E. Scher, A. Kadavanich and A. P. Alivisatos, Nature, 2000, 404, 59 CrossRef CAS; (b) X. Gao, Y. Cui, R. M. Levenson, L. W. K. Chung and S. Nie, Nat. Biotechnol., 2004, 22, 969 CrossRef CAS; (c) W. W. Yu, L. Qu, W. Guo and X. Peng, Chem. Mater., 2003, 15, 2854 CrossRef CAS.
- (a) A. M. Derfus, W. C. W. Chan and S. N. Bhatia, Nano Lett., 2004, 4, 11 CrossRef CAS; (b) N. Lewinski, V. Colvin and R. Drezek, Small, 2008, 4, 26 CrossRef CAS.
- M. Bottini, F. Cerignoli, D. M. Mills, F. D’Annibale, M. Leone, N. Rosato, A. Magrini, M. Pellecchia, A. Bergamaschi and T. Mustelin, J. Am. Chem. Soc., 2007, 129, 7814 CrossRef CAS.
- (a) S. N. Baker and G. A. Baker, Angew. Chem., Int. Ed., 2010, 49, 6726 CrossRef CAS; (b) L. Cao, X. Wang, M. J. Meziani, F. Lu, H. Wang, P. G. Luo, Y. Lin, B. A. Harruff, L. M. Veca, D. Murray, S.-Y. Xie and Y.-P. Sun, J. Am. Chem. Soc., 2007, 129, 11318 CrossRef CAS; (c) S.-T. Yang, L. Cao, P. G. Luo, F. Lu, X. Wang, H. Wang, M. J. Meziani, Y. Liu, G. Qi and Y.-P. Sun, J. Am. Chem. Soc., 2009, 131, 11308 CrossRef CAS; (d) X. Xu, R. Rey, Y. Gu, H. J. Ploehn, L. Gearheart, K. Raker and W. A. Scrivens, J. Am. Chem. Soc., 2004, 126, 12736 CrossRef CAS.
- (a) Y.-P. Sun, B. Zhou, Y. Lin, W. Wang, K. A. S. Fernando, P. Pathak, M. J. Meziani, B. A. Harruff, X. Wang, H. Wang, P. G. Luo, H. Yang, M. E. Kose, B. Chen, L. M. Veca and S.-Y. Xie, J. Am. Chem. Soc., 2006, 128, 7756 CrossRef CAS; (b) S.-L. Hu, K.-Y. Niu, J. Sun, J. Yang, N.-Q. Zhao and X.-W. Du, J. Mater. Chem., 2009, 19, 484 RSC.
- (a) R. Liu, D. Wu, S. Liu, K. Koynov, W. Knoll and Q. Li, Angew. Chem., Int. Ed., 2009, 48, 4598 CrossRef CAS; (b) A. B. Bourlinos, A. Stassinopoulos, D. Anglos, R. Zboril, V. Georgakilas and E. P. Giannelis, Chem. Mater., 2008, 20, 4539 CrossRef CAS.
- (a) J. Zhou, C. Booker, R. Li, X. Zhou, T.-K. Sham, X. Sun and Z. Ding, J. Am. Chem. Soc., 2007, 129, 744 CrossRef CAS; (b) Y. Li, Y. Hu, Y. Zhao, G. Shi, L. Deng, Y. Hou and L. Qu, Adv. Mater., 2011, 23, 776 CrossRef CAS; (c) L. Zheng, Y. Chi, Y. Dong, J. Lin and B. Wang, J. Am. Chem. Soc., 2009, 131, 4564 CrossRef CAS; (d) Y. Dong, N. Zhou, X. Lin, J. Lin, Y. Cui and G. Chen, Chem. Mater., 2010, 22, 5895 CrossRef CAS; (e) Q.-L. Zhao, Z.-L. Zhang, B.-H. Huang, J. Peng, M. Zhang and D.-W. Pang, Chem. Commun., 2008, 5116 Search PubMed; (f) J. Lu, J.-X. Yang, J. Wang, A. Lim, S. Wang and K. P. Loh, ACS Nano, 2009, 3, 2367 CrossRef CAS.
- (a) Z.-A. Qiao, Y. Wang, Y. Gao, H. Li, T. Dai, Y. Liu and Q. Huo, Chem. Commun., 2010, 46, 8812 RSC; (b) J.-L. Chen and X.-P. Yan, Chem. Commun., 2011, 47, 3135 RSC.
- (a) H. Liu, T. Ye and C. Mao, Angew. Chem., Int. Ed., 2007, 46, 6473 CrossRef CAS; (b) C. Ray, A. Saha, N. R. Jana and R. Sarkar, J. Phys. Chem. C, 2009, 113, 18546 CrossRef; (c) L. Tian, D. Ghosh, W. Chen, S. Pradhan, X. Chang and S. Chen, Chem. Mater., 2009, 21, 2803 CrossRef CAS.
- (a) H. Peng and J. Taravas-Sejdic, Chem. Mater., 2009, 21, 5563 CrossRef CAS; (b) A. B. Bourlinos, A. Stassinopoulos, D. Anglos, R. Zboril, M. Karakassides and E. P. Giannelis, Small, 2008, 4, 455 CrossRef CAS; (c) F. Wang, S. Pang, L. Wang, Q. Li, M. Kreiter and C. Liu, Chem. Mater., 2010, 22, 4528 CrossRef CAS.
- (a) J. Zhang, W. Shen, D. Pan, Z. Zhang, Y. Fang and M. Wu, New J. Chem., 2010, 34, 591 RSC; (b) H. Zhu, X. Wang, Y. Li, Z. Wang, F. Yang and X. Yang, Chem. Commun., 2009, 5118 Search PubMed.
- D. Pan, J. Zhang, Z. Li and M. Wu, Adv. Mater., 2010, 22, 734 CrossRef CAS.
- (a) S. J. Yu, M. W. Kang, H. C. Chang, K. M. Chen and Y. C. Yu, J. Am. Chem. Soc., 2005, 127, 17604 CrossRef CAS; (b) C. C. Fu, H. Y. Lee, K. Chen, T. S. Lim, H. Y. Wu, P. K. Lin, P. K. Wei, P. H. Tsao, H. C. Chang and W. Fann, Proc. Natl. Acad. Sci. U. S. A., 2007, 104, 727 CrossRef CAS.
- (a) L. Liu, D. Ma, H. Zheng, X. Li, M. Cheng and X. Bao, Microporous Mesoporous Mater., 2008, 110, 216 CrossRef CAS; (b) K. K. P. Datta, B. V. S. Reddy, K. Ariga and A. Vinu, Angew. Chem., Int. Ed., 2010, 49, 5961 CrossRef CAS; (c) Y. Qiu and L. Gao, Chem. Commun., 2003, 2378 Search PubMed; (d) A. Liu and M. Cohen, Science, 1989, 245, 841 CAS; (e) G. W. Yang and J. B. Wang, Appl. Phys. A: Mater. Sci. Process., 2000, 71, 343 CrossRef CAS; (f) Y.-J. Bai, B. Lu, Z. Liu, L. Li, D. Cui, X. Xu and Q. Wang, J. Cryst. Growth, 2003, 247, 505 CrossRef CAS; (g) L. Yang, P. W. May, Y. Huang and L. Yin, J. Mater. Chem., 2007, 17, 1255 RSC; (h) K. Ghosh, M. Kumar, H. Wang, T. Maruyama and Y. Ando, J. Phys. Chem. C, 2010, 114, 5107 CrossRef CAS.
- S. Liu, J. Tian, L. Wang, Y. Luo, J. Zhai and X. Sun, J. Mater. Chem., 2011, 21, 11726 RSC.
- S. Liu, J. Tian, L. Wang, H. Li, Y. Zhang and X. Sun, Macromolecules, 2010, 43, 10078 CrossRef CAS.
- X. Zou, G. Li, Y. Wang, J. Zhao, C. Yan, M. Guo, L. Li and J. Chen, Chem. Commun., 2011, 47, 1066 RSC.
- M. J. Bojdys, J.-O. Muller, M. Antonietti and A. Thomas, Chem.–Eur. J., 2008, 14, 8177 CrossRef CAS.
- J. Muzart, Tetrahedron, 2009, 65, 8313 CrossRef CAS.
Footnote |
| † Electronic supplementary information (ESI) available: Quantum Yield Measurements; XPS spectrum; C1sspectrum; N1sspectrum; FT-IR spectrum; emission intensity of CNDs during continuous excitation; the effect of the solution pH value on CNDs fluorescence; the effect of microwave irradiation time on the intensity. See DOI: 10.1039/c1ra00249j |
| This journal is © The Royal Society of Chemistry 2011 |
