A divided potential driving self-discharge process for single-walled carbon nanotube based supercapacitors
Qing
Zhang
,
Jiepeng
Rong
and
Bingqing
Wei
*
Department of Mechanical Engineering, University of Delaware, Newark, Delaware 19716, USA
First published on 14th September 2011
Abstract
Understanding the self-discharge (SDC) mechanism is crucial for obtaining supercapacitors with tunable energy retention. Supercapacitors built with free standing single-walled carbon nanotube (SWNT) macro-films and 1M TEABF4/PC electrolyte exhibit a unique divided potential driving SDC discharge process as demonstrated by the perfect fitting results of the SDC curves under different charge current densities and at different SDC temperatures. The divided potential driving SDC process could be attributed to the existence of various functional groups attached to the SWNT surface from the purification process, through intervening and creating relatively weak bonds between the electrolytic ions and the SWNT electrode surface.
Introduction
Supercapacitors, also known as electro-chemical capacitors, have attracted great interest in recent years, mainly because of their increasing application in smart grids, renewable energy, memory backup devices, electric vehicles, military weapons, space equipment, and in a number of day-to-day electronic devices1,2 that demand much higher power density than lithium-ion batteries and much higher energy density than conventional dielectric capacitors could provide. Supercapacitors have several advantages over secondary batteries, for instance, longer cycle life (fairly small energy degeneration through millions of charge/discharge cycles), a simpler operating principle, a more compact design, and shorter charging time. The most important feature is their high power density compared to lithium-ion batteries.Carbon nanotubes (CNTs), one of the extensively studied electrode materials for supercapacitors,3,4,5 exhibit their own superiority as electrodes in supercapacitors compared to porous carbon materials6 (chemical/physical activated carbon, polymer derived carbon, etc), in terms of their outstanding electrical conductivity7 for fast charge transferring and the availability of free standing macro-films,8,9 which eliminate the need for metal current collectors and coating binders. So far, there have been an extensive number of reports on CNT-based supercapacitors, covering methods to improve the energy density, such as acid treatments,10 particle decoration,11,12,13 and mixing with additive,14,15etc; as well as temperature,9,16 pressure17 and other factors affecting the charge/discharge process. It is worth noting that almost all of the reported work on CNT-based supercapacitors has been focused on the electrochemical characteristics of the charge/discharge process, with little attention on evaluating energy retention capabilities in the post-charge process, i.e., self-discharge (SDC) of the supercapacitors, which is crucial in providing guidance for obtaining advanced supercapacitors with tunable energy retention.
Self-discharge, a thermodynamically spontaneous process of energy fading, obeys different mechanisms with respect to the types of driving forces built up during a charging process. Understanding the SDC mechanisms and associated determinate factors are of the utmost importance in obtaining supercapacitors with tunable energy retention, which can be subsequently applied to practical areas, from small-scaled integrated circuits to large-scaled automobiles. Based on our previous work on the SDC of double-layer supercapacitors assembled with activated carbon materials and organic electrolytes,18 a SDC process could be driven by potential field V, ion concentration variation ∂c/∂x (c is the concentration of an electrolytic ion) or the combination of the two for this type of double-layer supercapacitor, as no chemical reaction occurs during the charging/discharging. Which driving force takes control depends on the competition of their strength. In general, a supercapacitor with a high initial voltage (denoted as Vinitial) and a low specific capacitance C (small ∂c/∂x by Q = C × V) tends to experience an SDC process in a potential-driving way, and vice versa.
In this report, a supercapacitor with free standing SWNT macro-films as the electrodes and 1M TEABF4/PC as the electrolyte (Fig. 1b) was assembled to study the SDC process. By systematically examining SDC processes under different charge current densities and at different SDC temperatures, a divided potential driving (DPD) control model is proposed here, which perfectly fits all the SDC experimental results.
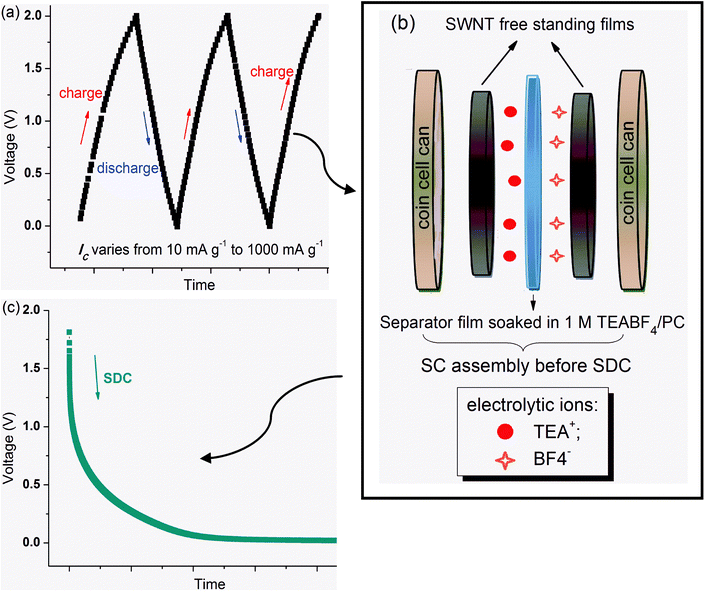 | ||
| Fig. 1 Illustration of the experiment: (a) pre-charge/discharge two and a half cycles before SDC. (b) SC assembly right before SDC. (c) SDC process. | ||
Results and discussion
SDC curves charged with different charge current densities from 10 to 1000 mA g−1 at 25 °C are shown in Fig. 2(a); the higher the charge current density, the faster the SDC process. Compared to supercapacitors using activated carbon fibers (ACF) as the electrode material,18 the supercapacitor with the same electrolyte (1M TEABF4/PC) but different electrodes (free-standing SWNT macro-films here) exhibits a much higher SDC rate for all the charge current densities and SDC temperatures, as evidenced by the disconnected voltage points at the beginning of the SDC (inset of Fig. 2(a), time spacing between two voltage points is 10 s). Specifically, the decrement from the initial voltage to the second voltage point reaches up to 0.1 V when IC = 1000 mA g−1 (Fig. 2(b)), which is ten times that for the ACF–TEABF4 supercapacitor. However, the SWNT–TEABF4 supercapacitor has much less of an initial voltage drop (about 9%) than that of ACF–TEABF4 supercapacitor (up to 35%–40%) as IC increases from 10 to 1000 mA g−1. The fast SDC rate and little loss of initial voltage under a high charge current indicates the exceptionally electrical conductivity and fast charge transfer capability of the SWNT electrodes. The high value of the initial voltage, as in the discussion of the SDC mechanism below, is preferable for the supercapacitor to undergo the SDC process under potential field driving.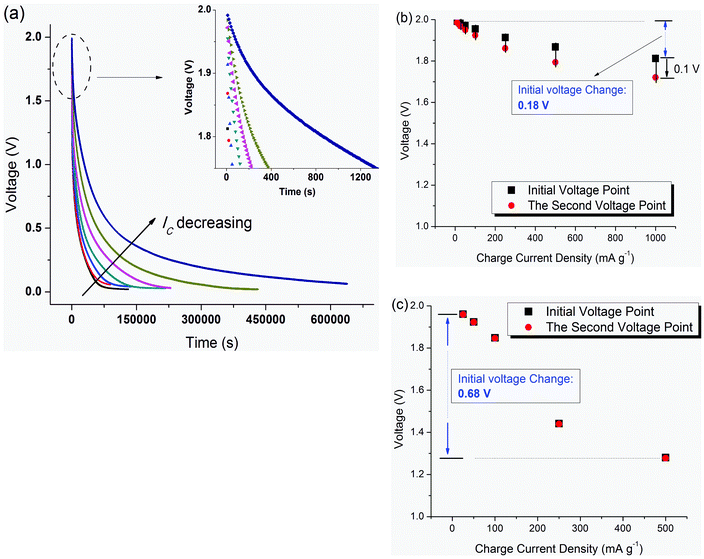 | ||
| Fig. 2 (a) SDC curves after charging with different charge current densities from 10 mA g−1 to 1000 mA g−1 at 25 °C. The voltage reduction from Vinitial at the very beginning of SDC corresponds to various charge current densities, Ic: (b) SC of SWNT–1M TEABF4/PC; (c) SC of ACF–1M TEABF4/PC. | ||
The pure double-layer capacitive behavior of the SWNT–TEABF4 supercapacitor (guaranteed by the 2.0 V operation voltage, which is much less than the voltage window of the organic electrolyte used) narrows the SDC driving forces two-fold: one is caused by the potential field V and the other by the concentration variation ∂c/∂x of the ions (i.e.TEA+ and BF4− in the current case). However, from the curve fitting results, neither the potential driving model (V = Vinitial × e−t/τ) nor the diffusion control model19 (V = Vinitial −mt1/2) can satisfactorily fit the experimental SDC curves. It is also impossible to fit the curves well by applying the dual mechanism model (a linear combination of potential driving mechanism and diffusion control mechanism18), which has been successfully applied to the ACF–TEABF4 supercapacitor system. This is due to the comparable strength between the two driving forces: potential field and concentration variation. Compared with the SDC of the ACF–TEABF4 supercapacitor, the SDC process of the SWNT–TEABF4 supercapacitor starts with a higher initial voltage (Fig. 2) and has a lower specific capacitance C. The SDC process of SWNT–1M TEABF4/PC tends to be primarily driven by the potential field V though a single potential driving model could not be applied well. However, a split potential driving model, termed afterwards as the “divided potential driving” (DPD) model, can perfectly fit the experimental curves (Fig. 3). The physical interpretation is provided below.
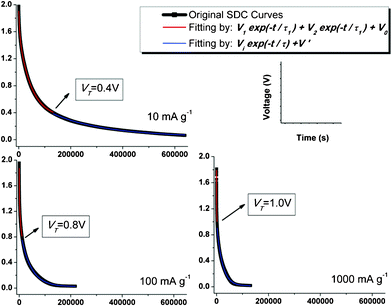 | ||
| Fig. 3 Experimental SDC curves (in black) and the fitting curves with DPD model (in red) and SPD model (in blue). Transition voltage VT under each IC is marked as well. | ||
Fig. 3 illustrates the curve fitting results of the SDC process of SWNT-TABF4 supercapacitor based on the proposed DPD mechanism. As depicted in the figure, the precedent portion of the SDC process is controlled by a mixed mechanism which linearly combines two single potential-driving processes; and then merges into one single potential-driving process as the SDC process is developing. This interesting phenomenon has never been reported before. The SDC process dominated with the formula
| V = V1× e−t/τ1 + V2× e−t/τ2 + V0,τ1 > τ2, | (1) |
For the SPD model V = Vi × e−t/τ + V', which is usually the case for conventional capacitors, time constant τ (τ = RC, where R is the ohmic equivalent load resistance, and C is the capacitance of the capacitor) is a characteristic parameter specifying the SDC rate, and determined by the motility of ions and the magnitude of the potential field. Smaller τ means a faster SDC process and vice versa. In the DPD model, two SPD processes are linearly combined together; hence, the two processes proceed at the same time without affecting each other. FromV2/V1 ratio, the relative amount of ions that contribute to the faster and the slower SDC processes can be estimated based on Q = C × V. The larger time constant τ = τ1 represents the potential-driving SDC part associated with a group of electrolyte ions with a slower SDC rate, and the smaller τ = τ2 represents the group of ions with a faster SDC rate. In a potential driving process, the driving force comes from the force that a potential field exerts on the ions against viscosity and other drags. Since the potential field and the drag of the solvent to ions are equipollent to all ions across the opposing electrodes, they play little role in the division of the potential driving SDC in this SWNT–TEABF4 supercapacitor system.
As discussed above, the built up potential field during charging, i.e. the driving force scaled with V is the same for both groups of ions, so as the electrolyte environment (i.e., ions mobility in viscous organic solvent) across the opposing electrodes, therefore, the most possibly determinate factor leading to the division of potentially driving SDC (i.e., the DPD SDC process) will be the variation in bonding between electrolyte ions and electrodes right before the ions being discharged out of the Helmholtz double layers (H-layers). This bonding variation (will be discussed in details below) separates ions that accumulate into the H-layers at Electrode (SWNTs)/Electrolyte (1M TEABF4/PC) interfaces into two groups, one is the strong-bonded ions (associated with time constant τ1); and the other is the weak-bonded ions (associated with time constant τ2). As an SDC process begins, both strong-bonded and weak-bonded ions start to move out of the H-layers: one governed by V1× e−t/τ1, and the other by V2× e−t/τ2. As the SDC process continues, all weakly bonded ions, which have a faster SDC rate, will be discharged out of the H-layers, the term“V2× e−t/τ2” contributed by them vanishes, resulting in the transition from the DPD model to the SPD model, solely governed by V1× e−t/τ1 as shown in Fig. 3.
As can be seen in Fig. 3, VT, the transition voltage from the DPD to SPD process, holds different values under different charge current densities, and rises up as the charge current density, IC, increases (Fig. 4). Since there is insufficient time available for ions to arrange stably when a supercapacitor is charged with a high IC, the proportion of the stable, strong-bonded ions decreases, which is in good agreement with the fitting results (V1/V2) in Fig. 4. Intuitively, a lower transition voltage VT is expected since the increasing proportion of the weak-bonded ions contributed to the total potential V. However, instead of a falling-off in transition voltage VT as IC increases, a rising-up of VT is presented by the curve fitting which is the result of the gradually increasing SDC rate as explained below.
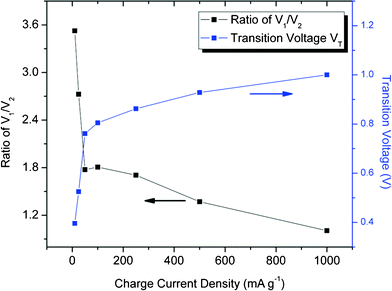 | ||
| Fig. 4 Fitting parameters with the DPD SDC mechanism (SDC at 25 °C): Ratio of V1/V2 and Ttransition voltage VT as a function of charge current density. | ||
When an SDC process begins, both the strong-bonded and weak-bonded ions start to be discharged out of the H-layers. The voltage decrement from the initial voltage is the joint effort of both the fast and the slow SDC processes. When IC increases from 10 to 1000 mA g−1, the time needed to reach the transition voltage VT decreases to a great extent (from 36.7 h to 0.48 h), indicating that the increase in SDC rate remarkably outperforms the increase in the proportion of the weak-bonded ions. Upon reaching VT, all weak-bonded ions will be discharged out of the H-layers, leading to the extinction of V2× e−t/τ2 in the DPD SDC process; meanwhile, the majority of the strong-bonded ions with a much slower SDC rate would be the sole contributors in the H-layers. Therefore, taking the large IC = 1000 mA g−1 as an example, given only 0.48 h before reaching VT, an elevation in VT should be expected as a result of a large portion of strong-bonded ions remaining in H-layers in such a short time.
Curve fitting with the universal DPD model can be applied to a broad range of charge current density from 10 to 1000 mA g−1 (Fig. 3), indicating the intrinsic existence of bonding variation in the SWNT–TEABF4 supercapacitor system, regardless of the charge current density IC though the ratio V1/V2, the transition voltage VT and other fitting parameters vary as a function of IC. The difference between the strong-bonding and the weak-bonding strength could come from different SWNT surfaces, which have been functionalized by various oxygen-containing functional groups6 (such as carboxyl, carbonyl, hydroxyl groups, etc) through nanotube purification processes. Considering the fairly comparable size of the functional groups, such as –COOH (∼0.2 nm in diameter) to the electrolytic ions (such as BF4− 0.33 nm in diameter)20, interference of the functional groups between ions and electrode surface plays an important role in separating ions into two groups: the strong-bonded ions and the weak-bonded ions. The strong bonding comes directly from the electrostatic interaction between the SWNT surface and the ions,21 while the weak bonding is the bonding weakened by the functional groups intervening between, as schematic shown in Fig. 5.
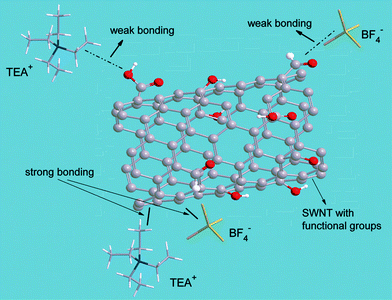 | ||
| Fig. 5 Illustration of the two types of bonding. Strong-bonding (the solid lines) is the electrostatic interaction between the SWNT surface and the electrolytic ions (TEA+, BF4−); whereas, the weak-bonding (the dashed lines) is the electrostatic interaction between the SWNT and TEA+ or BF4−, but with interference of the functional groups attached to the SWNT surface. | ||
This claim can be further verified by the SDC experimental results conducted at a very low temperature (−25 °C), at which the resultant low thermal energy of the ions and the high viscosity of electrolyte solvent make the V1/V2 ratio closer to the actual ratio of ion separation in the charged supercapacitor. As obtained from the SDC process at −25 °C (details given below), the ratio V1/V2 is around 2.1 (Table 1) and consistent with the SWNT surface characterization results, i.e. about 1/3 of SWNT surface covered with functional groups.8
| SDC T/°C | Ratio of V1/V2 | Time constant τ/τ0 | |||||||||||||||||||||||||||||||||||||||||||||||||||||||||||||||||||||||||||||||||||||||||||||||||
|---|---|---|---|---|---|---|---|---|---|---|---|---|---|---|---|---|---|---|---|---|---|---|---|---|---|---|---|---|---|---|---|---|---|---|---|---|---|---|---|---|---|---|---|---|---|---|---|---|---|---|---|---|---|---|---|---|---|---|---|---|---|---|---|---|---|---|---|---|---|---|---|---|---|---|---|---|---|---|---|---|---|---|---|---|---|---|---|---|---|---|---|---|---|---|---|---|---|---|---|
| τ 1 | τ 2 | ||||||||||||||||||||||||||||||||||||||||||||||||||||||||||||||||||||||||||||||||||||||||||||||||||
| a time constant τ1 is given relative to τ10 (∼6097.2 s) and τ2 are given relative to τ20 (∼470.9 s); τ10 and τ20 are the time constants of the slow and fast SDC part at 25 °C. | |||||||||||||||||||||||||||||||||||||||||||||||||||||||||||||||||||||||||||||||||||||||||||||||||||
| 25 | 1.81 | 1 | 1 | ||||||||||||||||||||||||||||||||||||||||||||||||||||||||||||||||||||||||||||||||||||||||||||||||
| −25 | 2.10 | 5.87 | 7.05 | ||||||||||||||||||||||||||||||||||||||||||||||||||||||||||||||||||||||||||||||||||||||||||||||||
| 75 | 1 | 0.07 | 0.96 | ||||||||||||||||||||||||||||||||||||||||||||||||||||||||||||||||||||||||||||||||||||||||||||||||
In addition to the effects of the charge current density on the SDC process at room temperature (25 °C), the SDC process of the SWNT–TEABF4 supercapacitor has also been conducted at −25 °C and 75 °C with IC = 100 mA g−1. The curve fitting results are given in Table 1 and Fig. 6.
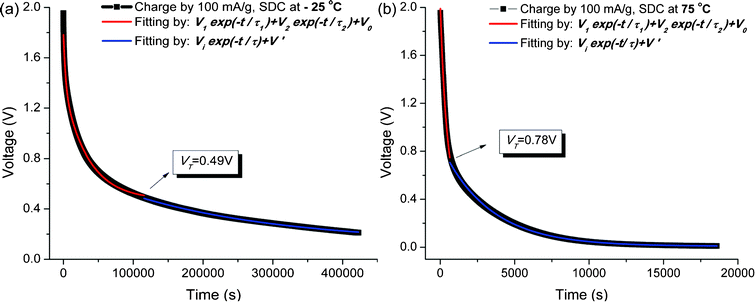 | ||
| Fig. 6 Experimental SDC curves (in black) and the curve fittings with the DPD model (in red) and the SPD model (in blue); (a) at −25 °C and (b) at 75 °C. | ||
The perfect fitting of the curve, as shown in Fig. 6 indicates that the proposed DPD model, as well as its transition to the SPD model, can be extended to a large temperature range −25–75 °C. The SDC rate decreases at low temperature and increases at high temperature. This can be interpreted as the greatly undermined ions mobility at −25 °C, due to the loss in thermal energy and the increase in the eletrolytic viscosity, and the enhanced ion mobility at 75 °C.
More specifically, one can see from Table 1 that both time constants τ1 and τ2 increase at −25 °C. τ1 increases 5.87 times and τ2 increases 7.05 times, indicating that the low temperature has a larger effect upon the SDC process of the weakly-bonded ions. The SDC of both ions proceeds with a slower rate, but that of the weakly-bonded ions proceeds more slower, hence yielding a lower voltage point VT (Fig. 6).
At 75 °C, however, both time constants τ1 and τ2 decrease. τ1 decrease by 99.93% while τ2 decreases only by 4% (see Table 1), indicating that elevating the SDC temperature has a larger effect upon the SDC process of the strongly-bonded ions. As seen in Fig. 6(b), the transition voltage VT = 0.78 V is lower than VT = 0.805 V at 25 °C. The reason of the lower VT is the larger proportion of the weakly-bonded ions (V2/V1 = 1 in Table 1) plus greatly enhanced SDC rate of the strongly-bonded ions. Therefore, the SDC at 75 °C has a lower transition voltage VT = 0.78 V, at which the weakly-bonded ions are discharged out of the H-layers and the SDC mechanism switches from DPD into SPD.
Conclusions
It is of practical significance to understand the SDC mechanism in order to produce supercapacitor systems with tunable energy retention. A DPD model as well as its transition to the SPD model is proposed, which explains the experimental results of the SWNT–1M TEABF4/PC supercapacitor SDC process. The transition from the DPD to the SPD model is ascribed to the intrinsic bonding variation between the electrolyte ions and the electrodes in the charged state due to the interference of functional groups between the ions and electrodes. Moreover, the new “DPD→SPD” SDC model can also be applied to a large temperature range (−25–75 °C). The understanding of the proposed “DPD→SPD” SDC model will provide guidance in selecting a desired charge current density and the SDC temperature in order to tune the energy retention of a supercapacitor.Methods
Fabrication of SWNT macro-films and supercapacitor assembly
Fabrication of the SWNT macro-film was done by CVD, followed by annealing, acid washing and then extensive washing with distilled water until pH reaches 7. 1M TEABF4 (Alfa Aesar) dissolved in battery-graded PC (Alfa Aesar) was used as the electrolyte. The capacitor was then assembled in a standard 2032 coin cell (See Fig. 1(b)).SDC experiments
The experimental details are given in Fig. 1. The galvanostatic charge/discharge tests were carried out using an Arbin battery testing system. The assembled supercapacitor was first charged/discharged with different charge current densities (IC = 1000 mA g−1, 500 mA g−1, 250 mA g−1, 100 mA g−1, 50 mA g−1, 25 mA g−1, and 10 mA g−1) for two and a half cycles (0 to 2.0 V) at 25 °C (Fig. 1(a)). At the point right before SDC, the ions with opposite charges are separated to the two opposing electrodes (Fig. 1(b)), distributed with different levels of stabilization with varying IC. A typical SDC curve is shown in Fig. 1(c). The actual voltage from which the SDC process starts is not nominal 2.0 V as charged to, but associated with the stabilized state of ions arrangement. This voltage point is named the “initial voltage” of a SDC process. Usually, a higher IC results in a lower initial voltage. Moreover, in order to study the temperature effect, SDC processes of the SWNT–1M TEABF4/PC supercapacitor have also been conducted at 75 °C and −25 °C, after charging using IC = 100 mA g−1 at 25 °C.Acknowledgements
This work is financially supported by the US National Science Foundation (NSF) under the contracts of CMMI-0926093.References
- J. R. Miller and P. Simon, Science, 2008, 321, 651–652 CrossRef CAS.
- R. Kotz and M. Carlen, Electrochim. Acta, 2000, 45, 2483–2498 CrossRef CAS.
- E. Frackowiak and F. Beguin, Carbon, 2001, 39, 937–950 CrossRef CAS.
- A. G. Pandolfo and A. F. Hollenkamp, J. Power Sources, 2006, 157, 11–27 CrossRef CAS.
- P. Simon and Y. Gogotsi, Nat. Mater., 2008, 7, 845–854 CrossRef CAS.
- J. Lee, J. Kim and T. Hyeon, Adv. Mater., 2006, 18, 2073–2094 CrossRef CAS.
- B. Q. Wei, R. Vajtai and P. M. Ajayan, Appl. Phys. Lett., 2001, 79(8), 1172–1174 CrossRef CAS.
- H. W. Zhu and B. Q. Wei, Chem. Commun., 2007, 3042–3044 RSC.
- C. Masarapu, H. F. Zeng, K. H. Hung and B. Q. Wei, ACS Nano, 2009, 3(8), 2199–2206 CrossRef CAS.
- X. L. Chen, W. S. Li, C. L. Tan and Y. Z. Wu, J. Power Sources, 2008, 184, 668–674 CrossRef CAS.
- T. C. Hung, C. F. Chen, C. C. Chen and W. T. Whang, J. Nanosci. Nanotechnol., 2010, 10, 4738–4742 CrossRef CAS.
- A. V. Ellis, K. Vijayamohanan, R. Goswami, N. Chakrapani, L. S. Ramanathan, P. M. Ajayan and G. Ramanath, Nano Lett., 2003, 3(3), 279–282 CrossRef CAS.
- A. Carrillo, J. A. Swartz, J. M. Gamba and R. S. Kane, Nano Lett., 2003, 3(10), 1437–1440 CrossRef CAS.
- K. H. An, K. K. Jeon, J. K. Heo, S. C. Lim, D. J. Bae and Y. H. Lee, J. Electrochem. Soc., 2002, 149(8), A1058–A1062 CrossRef CAS.
- S. B. Ma, K. W. Nam, W. S. Yoon, X. Q. Yang, K. Y. Ahn, K. H. Oh and K. B. Kim, J. Power Sources, 2008, 178, 483–489 CrossRef CAS.
- S. Fujita and A. Suzuki, J. Appl. Phys., 2010, 107, 013711 CrossRef.
- X. Li, J. P. Rong and B. Q. Wei, ACS Nano, 2010, 4(10), 6039–6049 CrossRef CAS.
- Q. Zhang, J. P. Rong and B. Q. Wei, Energy Environ. Sci., 2011, 4(6), 2152–2159 CAS.
- B. E. Conway, Electrochemical Supercapacitors: Scientific Fundamental and Technological Application, Kluwer Academic/Plenum Publishers, New York, 2nd edn, 1999, pp. 557–573 Search PubMed.
- J. Chmiola, G. Yushin, Y. Gogotsi, C. Portet, P. Simon and P. L. Taberna, Science, 2006, 313, 1760–1763 CrossRef CAS.
- A. I. Frolov, A. G. Rozhin and M. V. Fedorov, ChemPhysChem, 2010, 11, 2612–2616 CrossRef CAS.
| This journal is © The Royal Society of Chemistry 2011 |
