Isotope effect on ultrafast charge-transfer-to-solvent reaction from I− to water in aqueous NaI solution†
Yoshi-Ichi
Suzuki
abc,
Huan
Shen
ab,
Ying
Tang
abd,
Naoya
Kurahashi
ab,
Kentaro
Sekiguchi
ab,
Tomoya
Mizuno
c and
Toshinori
Suzuki
*abc
aDepartment of Chemistry, Graduate School of Science, Kyoto University, Kyoto, 606-8502, Japan. E-mail: suzuki@kuchem.kyoto-u.ac.jp; Fax: +81-75-753-3974; Tel: +81-75-753-3971
bJapan Science and Technology Agency, CREST, Sanbancho, Chiyoda-ku, Tokyo 102-0075, Japan
cChemical Dynamics Laboratory, RIKEN Advanced Science Institute, Wako 351-0198, Japan
dWuhan Institute of Physics and Mathematic, Chinese Academy of Sciences, Wuhan, People's Republic of China
First published on 24th March 2011
Abstract
A charge-transfer-to-solvent (CTTS) reaction from a photoexcited iodine atomic anion, I− (aq), in bulk water (H2O and D2O) was studied by time-resolved photoelectron spectroscopy using a liquid beam (microjet) of aqueous NaI solution. The 2P3/2 CTTS state of I− (aq) was excited by a 226 nm femtosecond laser pulse and the evolution of the nonstationary electronic state was probed using another ultraviolet femtosecond laser pulse. Global fitting of the observed time-dependent photoelectron kinetic energy distributions provided the time constants of individual reaction steps and the photoelectron spectra from the CTTS state, a contact pair, the solvent-separated state, and a hydrated electron. Most of the elementary reaction steps revealed a strong deuterium isotope effect, indicating coupling of the electron dynamics and the hydrogen atomic motion of solvent water. However, nondiffusive geminate recombination processes from the CTTS state and a contact pair were almost insensitive to deuteration. Consequently, geminate recombination processes from the CTTS state and a contact pair occurs more efficiently in D2O, because the response of water is decelerated in D2O. In contrast, the recombination process from the solvent-separated state in the final step of the CTTS reaction is less efficient in D2O, presumably due to the smaller zero point energy.
1. Introduction
Water is the most important liquid in biological and environmental sciences. Liquid water has tetrahedrally coordinated hydrogen bonds (HBs) as a time-averaged structure.1–4 However, these HBs are continually being distorted and disrupted instantaneously by thermal fluctuation, although the degree of such disorder is still being intensely debated.5–11 The defective HB network plays an important role in electron dynamics in water as it acts as an electron-trapping site. Although a single water molecule cannot capture an excess electron, an electron can be stabilized in liquid water by orienting the OH bonds of the surrounding water molecules towards the center of mass of the electron cloud. This stabilization energy (the electron binding energy of a hydrated electron) amounts to 3.3 eV relative to the vacuum level;12–17 thus, a hydrated electron is considerably lower in energy than the conduction band edge of water, which has been estimated to be within 0.5 eV from the vacuum level.13 Therefore, an electron transfer reaction is possible from a solute to bulk water even below the conduction band. This type of reaction is called a charge-transfer-to-solvent (CTTS) reaction. Since the local structure of the HB network must undergo a drastic change including the reorientation of water molecules to fully accommodate the excess electron, the CTTS reaction involves solvation dynamics as the key element.Halogen atomic anions may be the most suitable solutes for the studies of the CTTS dynamics,18 as they have no internal degrees of freedom other than their electronic motion, which would otherwise complicate the problem considerably. Halogen atomic anions in the gas phase do not have any stable excited state below the photodetachment threshold energy, whereas the anions in water have short-lived (<1 ps) excited states that undergo CTTS reaction. These metastable states supported by solvents are known as CTTS states. The CTTS absorption bands of halogen anions [X− (aq) + hv → X−* (aq)] appear in the deep UV to vacuum UV region depending on the atomic number. The lowest 2P3/2 CTTS band of I− (peak at 225 nm) has been most frequently studied for its long absorption wavelength.18–27
Because the CTTS reaction involves a quantum-mechanical solute (electron) and the dynamics of a large number of solvent molecules, its theoretical simulation is a highly challenging task even in the present day. Sheu and Rossky conducted a mixed quantum-classical simulation of the CTTS reaction from a hydrated iodine anion [I− (aq)] to bulk water using a one-electron wavefunction of an excess electron and an electron-water pseudopotential.26,27 Staib and Borgis reported similar simulations for the CTTS reaction from the lowest excited state of Cl− (aq) to water.28,29 These simulations suggested that the CTTS reaction from higher excited states can occur via the tunneling of an excess electron from an ion to a void in an HB network, while the CTTS reaction from the lowest excited state occurs adiabatically via a transient complex of a neutral halogen atom and an excess electron. The complex predicted for the case of I− (aq) was a contact pair (CP) that consists of a neutral iodine atom and an excess electron caged in the same hydration shell,26,27 while, a solvent-separated (SS) state has been proposed for Cl−, in which an electron and a neutral chlorine atom are separated by a few water molecules.28,29 However, the accuracies of the predicted structures may be limited owing to the approximate nature of electron-water and electron-halogen pseudopotentials and the empirical halogen–water and water–water potentials (SPC in Sheu and Rossky26,27 and pTIP4P in Staib and Borgis28,29) used in these simulations.
In the last decade, transient absorption spectroscopy (TAS) of the CTTS reaction from the lowest (2P3/2) CTTS state of I− (aq) to water has been reported.20–23 The observed time profile of the transient absorption signal could not be explained by the model previously used for two-photon ionization of water.20 In the photoionization of water, an electron is ejected to a distance of more than 1 nm from the ionization point and geminate recombination occurs via mutual diffusion with the ion. Kloepfer et al. found that the 2P3/2 CTTS reaction of I− (aq) was well explained by a model assuming an intermediate complex consisting of an electron and a neutral iodine atom in agreement with the theoretical proposal.20 Iglev et al. proposed a similar model assuming two reaction intermediates of CP and an SS state.23 Despite the difference in the number of reaction intermediates, the overall dynamics proposed by Kloepfer et al. and Iglev et al. were similar. Note that the quantum yield of a free hydrated electron is low in the adiabatic CTTS reaction, since the excess electron remains in the proximity of the neutral atom for at least tens of picoseconds, during which geminate recombination can occur efficiently. TAS studies have identified a single geminate recombination process from the reaction intermediate with a time constant of ca. 30 ps.20–23
Previously, we studied the CTTS dynamics from I− (aq) to H2O14,30 by the time-resolved photoelectron spectroscopy (TRPES16,31) of a liquid beam (a microjet32–38). A pump pulse excited I− (aq) to the CTTS state and a time-delayed probe pulse induced photoemission from the nonstationary state. An electron passing through liquid water generally induces the electronic excitation or ionization of water molecules, which causes an electron flux with a short effective attenuation length (1 nm at 100 eV) of an electron flux. However, when the electron kinetic energy (<5 eV) is lower than the ionization energy (11.2 eV11,38,39) and the electronic energy of the A state of bulk water (ca. 8 eV), ionization and electronic excitation are energetically prohibited. Consequently, the effective attenuation length (the probing depth of PES) is extended. Although the actual attenuation length has not yet been determined for liquid water, it is likely to exceed 5 nm. The time-dependent photoelectron kinetic energy distribution (PKED) observed for the excitation wavelength of 243 nm was best explained by assuming two reaction intermediates.14,30
To gain deeper insights into the CTTS dynamics of this benchmark system, we investigate the solvent deuterium isotope effect at the excitation wavelength of 226 nm in this study. The isotope substitution decelerates the nuclear motion of hydrogen atoms in water molecules. Therefore, comparison of the reaction time constants in H2O and D2O will help elucidate which reaction steps are strongly coupled with the hydrogen atom motion. We perform a global fit of the time-dependent PKED and extract the reaction time constants and photoelectron spectra of four species in the CTTS reactions in H2O and D2O.
2. Methods
Fig. 1 shows the energy diagram of our experiment. NaI solutions (0.14 M) were prepared using deionized and deaerated H2O or deaerated D2O (99.9%, Euriso-top). A laminar flow of one of these sample solutions was introduced into a photoelectron spectrometer from a fused-silica capillary nozzle with an inner diameter of 25 μm. The liquid flow rate was 0.5 mL min−1. The liquid beam injected into the vacuum chamber was trapped with a liquid N2-cooled cold finger placed downstream and the vacuum chamber was pumped with a cryopump (15,000 L s−1) to maintain a pressure of 0.8–1.0 × 10⁻⁴ Torr. A regeneratively amplified Ti:sapphire laser excited two optical parametric amplifiers to generate pump and probe UV pulses at 1 kHz. These pulses were attenuated and focused onto the liquid at a point 1 mm downstream from the nozzle. Typical laser powers were < 70 nJ (pump) and < 200 nJ (probe) and the cross-correlation measured by (1 + 1′) two-photon ionization of NO was 0.31–0.39 ps depending on the wavelength combinations. We have measured the photoelectron kinetic energy distribution for different laser pulse energies, and we maintained the laser pulse energies to be well below the threshold for space-charge effects. The diameter of the focused laser beam at the liquid beam is estimated to be ca. 150 μm. Photoelectrons emitted from the liquid were sampled through a 5-mm-diameter skimmer located 11 mm from the liquid and transferred by electron lenses housed in multiple differential pumping stages for measurement with a hemispherical electron energy analyzer. Both the pump and probe laser pulses were linearly polarized; the probe laser polarization was parallel to the electron flight axis, whereas the pump laser polarization was aligned at the magic angle with respect to the axis. A strong photoelectron signal was detected only when the laser beams overlapped the liquid beam. The temperature reduction of the liquid beam due to evaporative cooling40 1 mm downstream from the nozzle is estimated to be about 8 K.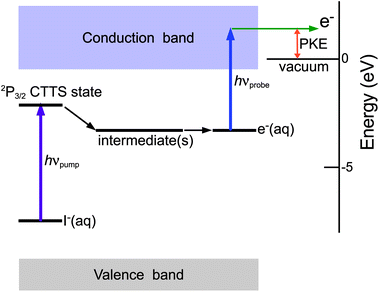 | ||
| Fig. 1 Schematic energy diagram of the CTTS reaction and time-resolved photoelectron spectroscopy. | ||
A photoelectron spectrometer must generally be calibrated by photoionization of a reference sample (a solid or gas) to determine the absolute values of the photoelectron kinetic energies. Calibration is particularly important in photoelectron spectroscopy of a liquid beam since electrokinetic charging of a liquid beam creates a streaming potential that accelerates or decelerates photoelectrons emitted from the liquid surface.41 Electrokinetic charging is caused by disruption of an electrical double layer of the solution around the inner surface of a fused silica capillary, on discharging the solution from the nozzle. Therefore, creation of a streaming potential is inevitable, although its magnitude can be altered by the electrolyte concentrations, the flow rate, and other factors. Thus, the energy of a liquid-beam photoelectron spectrometer must be calibrated with a reference sample while running a liquid beam. Previously, Winter et al. performed photoelectron spectroscopy of liquid water using synchrotron radiation (BESSY) in which they calibrated the absolute values of the electron binding energies of liquid water using the 1b1 photoelectron band of water vapor, which was observed simultaneously.39 They determined the electron binding energy of 1b1(liq) to be 11.16 ± 0.04 eV.39 We recently performed a similar experiment at SPring-8 with a slightly higher spectral resolution and estimated 1b1(liq) to be 11.23 ± 0.01 eV,11 which is in reasonable agreement with the value obtained by Winter et al.39 Thus, the calibration using water vapor has been demonstrated to be reliable. However, in the present study, neither water vapor nor liquid water could be ionized. For the same reason, the electron binding energy of the 5p orbital of hydrated I− (7.7 ± 0.2 eV) cannot be used as a reference.42 (The ambiguity in the binding energy of I− is too large to use it as a reference at our resolution of 40 meV.) Thus, we used NO as a reference gas and ionized it by one-color two-photon ionization via the A state in the presence of a liquid beam. The details of the method to measure a streaming potential of a liquid beam and correct the observed photoelectron kinetic energy (PKE) has been described in our previous papers.14,30,31
3. Results
3.1. Global fitting of 226 nm data
Fig. 2 shows the pump–probe photoelectron signals observed for aqueous NaI solutions in H2O and D2O as a function of delay time at a pump wavelength of 226 nm and a probe wavelength of 260 and 274 nm for H2O and D2O, respectively. Each point indicates the total photoelectron signal integrated over the entire kinetic energy distribution at each delay time. The two time profiles are considerably different from each other: the reduction of the photoelectron intensity in the first few picoseconds is greater in D2O than in H2O, while the opposite trend occurs in the following 30 ps. The result clearly illustrates the presence of a large isotope effect in the CTTS reaction.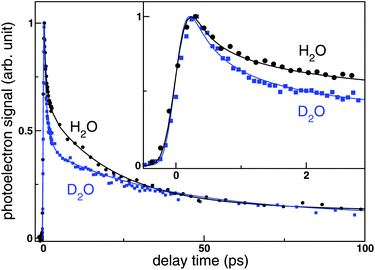 | ||
| Fig. 2 Total photoelectron signal as a function of pump–probe delay observed for the CTTS reaction from I− to H2O (black circles) and D2O (blue squares) at the excitation wavelength of 226 nm. Lines were obtained by global fittings. The inset shows expanded view of the initial region of the time profiles. | ||
Fig. 3a and 3b respectively show the time-dependent PKEDs, I(t,Ek), of the CTTS reactions in H2O and D2O. The horizontal axis has a logarithmic scale to display the rapid change in the PKED within 1 ps. The general features of the PKED are reasonably similar for H2O and D2O; however the PKED is narrower in energy and its intensity decreases faster in D2O than in H2O as shown in Fig. 2. The result indicates that deuteration also affects the photoelectron spectra.
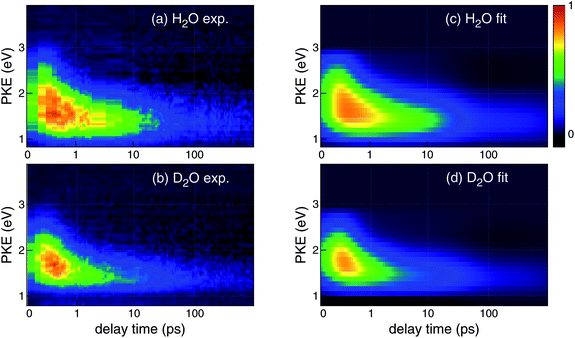 | ||
| Fig. 3 False color maps of photoelectron kinetic energy distributions observed for the CTTS reactions from I− to (a) H2O and (b) D2O. The pump and probe wavelengths were 226 and 260 nm, respectively. The delay time is plotted on a logarithmic scale. A constant has been added to the actual delay (tplot = ttrue + 0.2 ps) to shift the entire distribution to show the data around t = 0. The time labels and grids are presented for ttrue. Corresponding fitted maps are shown for (c) H2O and (d) D2O. See the text for details of the analysis. Intensities were normalized using the maximum value of the distributions. | ||
Similarly with our previous study, the results were analyzed based on the following four-step model of the CTTS reaction:
 | (1) |
The concept of this model is explained as follows. Consider the reverse reaction that starts from a fully hydrated electron (e−aq) and a fully hydrated neutral iodine atom [I(aq)]. When these species approach each other, we conjecture that a weak complex I·e− will form between e−aq and I(aq) as a reaction intermediate without breaking their hydration shells. Thus, we assume I·e− is the SS state that has water molecules separating e−aq and I(aq). The presence of this intermediate has been suggested theoretically for the CTTS reaction from Cl− (aq),28 and experimentally for Br− (aq)24 and I− (aq).23
A further reverse reaction from I·e− to I−* must involve either quantum-mechanical tunneling of an electron between the two shells or the removal of solvent wall separating e−aq and I(aq). Therefore, it seems reasonable to assume that the first intermediate I-e− is CP. The principal difference between I−* and I-e− is whether an excess electron cloud is on-center or off-center with respect to the iodine atom. The initial symmetry-breaking process of an electron wavefunction is presumably related to the anisotropy in the hydration shell; theoretical calculations indicated that the large polarizability of I− (aq) permits asymmetric distortion of the hydration shell without significant energetic penalty.43
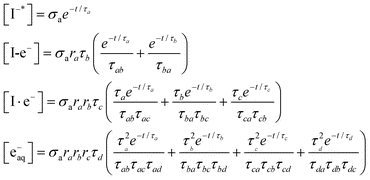
Analytical solutions can be obtained for the kinetic model (1). The populations [X] (X = I−*, I-e−, I·e−, and e−aq) for an impulsive pump pulse are expressed as:
 | (2) |
 τxy = τx − τy(x,y = a,b,c and d) and σa is the CTTS photoabsorption cross section of I− (aq). The branching ratio in each kinetic step is denoted by rx(= τxτ−1x1). The recombination times τx2 are obtained from the fitting parameters of τx and rx as τx2 = τx (1 − rx)−1. We show later that the two recombination times, τa2 and τb2, are important for interpreting the experimental results. An important advantage of TRPES over TAS in studying this reaction is that the entire spectral change can be observed with a subpicosecond time resolution30 with TRPES, whereas the initial absorption spectrum in TAS exceeds the observation wavelength window.22,23 Thus, TRPES provides more accurate branching ratios ra and rb as well as τa2 and τb2.
We assume that all species have identical photodetachment cross sections; consequently, the photoelectron intensity will be proportional to the sum of the populations of these species. The PKED map is thus expressed as:
| I(t,Ek) = σ0(cak[I−*] + cbk[I-e−] + cck[I·e−] + cdk[e−aq])⊗g(t) | (3) |
Each I(t,Ek) for H2O and D2O consists of about 100 photoelectron spectra measured at different time delays, up to 0.4–1.2 ns. We performed nonlinear least-squares fitting of I(t,Ek) using our kinetic model by the Levenberg-Marquardt method. The model neglected any time dependence of the PKED for each species; however, the reduced chi-squares values44 of our fitting were 1.0–1.2, indicating the adequacy of our fitting. Fig. 3c and 3d show reconstructed PKED maps for H2O and D2O, respectively. The observed and calculated I(t,Ek) in Fig. 3 are in excellent agreement. The residuals in our fitting are presented as 2D maps in Fig. S1 in the supplementary information†, and they do not exhibit any structures that might indicate a systematic error in the fitting. Figure S2 in the supplementary information† shows comparison of the raw PKEDs measured at several time delays and those obtained by global fitting.
Fig. 4 shows the time profiles at each PKE obtained from I(t,Ek) (colored dots) along with the fitted curves obtained by our kinetic model. The energy bin was 0.25 eV. Close examination of this figure confirms the presence of different time constants. The individual decay profiles shown in Fig. 4a and 4b exhibit triple exponential decay. Furthermore, examination of the regions where the signal intensity increases, shown in the insets of Fig. 4a and 4b, reveals that the signal at a smaller PKE reaches the maximum later than the signal at a higher PKE. This delayed appearance of the low-PKE component is expressed by another time constant. Note that the comparison of the profiles in Fig. 4a and 4b should be made cautiously; the profiles with the same colors cannot be directly compared, since the peak energy and width of the PKEDs are different for H2O and D2O.
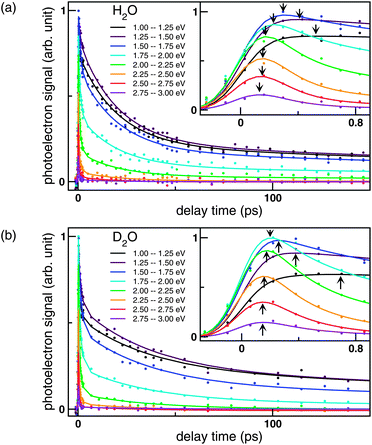 | ||
| Fig. 4 Time evolutions of the photoelectron signal intensities at different kinetic energies for (a) NaI/H2O probed at 260 nm and (b) NaI/D2O probed at 274 nm. Dots represent the observed signal intensities averaged for photoelectron kinetic energy distribution at a width of 0.25 eV. The curves are least-squares fits based on our kinetic model. The insets show expanded views of the initial region of the time profiles. Arrows indicate the peaks of the photoelectron signal at each PKE. Intensities were normalized using the maximum value of the data. | ||
Fig. 5 shows the PKEDs [cx,k(x = a,b,c,d)] of each species determined by global fitting. The distributions in thick lines were obtained using 0.25 eV energy bins. To confirm that the result is independent of the PKE bin, analysis was also performed with a narrower PKE bin of 0.1 eV. The results indicated by the thin lines in Fig. 5 are in excellent agreement with those obtained using 0.25 eV bin, which illustrates the stability of our solution. In these panels, the area of each spectrum is set equal to the quantum yield of the species. The first and the second intermediates are denoted as CP and SS owing to their assignments discussed below, while a free hydrated electron is denoted as HE. It is also noted that the PKED of a hydrated electron in bulk water exhibits a rather symmetric band shape in contrast with the asymmetric band shapes observed for water cluster anions.13
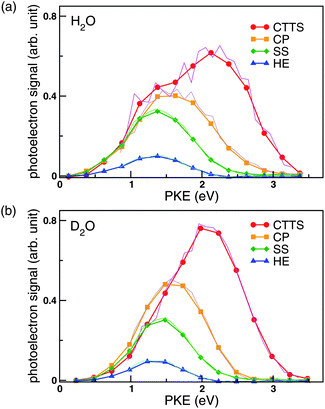 | ||
| Fig. 5 Photoelectron kinetic energy distributions from the CTTS state (red circles), the first intermediate (orange squares; CP), the second intermediate (green diamonds; SS), and hydrated electrons (blue triangles) in (a) NaI/H2O probed at 260 nm and (b) NaI/D2O probed at 274 nm. These data were obtained by global fitting the time-dependent photoelectron kinetic energy distributions. Symbols connected by thick lines represent the results obtained using 0.25 eV energy bins (ΔE) between 0 and 3.5 eV. Thin lines are the corresponding results obtained using 0.1 eV bins between 0.8 and 3.2 eV. There is excellent agreement between the two analyses. The distributions were normalized so that the integrated areas ΣkcxkΔE are proportional to the branching ratios, 1, ra, rarb, and rarbrc for the CTTS state, the first and second intermediates, and the hydrated electron, respectively. | ||
Table 1 summarizes the time constants determined by global fitting. The lifetime (τd) of a free hydrated electron is quite long and could not be accurately determined due to the insufficiently short pump–probe time delay used in this study; however, we confirmed that this uncertainty does not significantly alter the other fitting parameters.
| NaI/H2Oa | NaI/D2Oa | τ D2O x /τH2Oxa | |
|---|---|---|---|
| a The standard deviations of the mean were derived from measurements on different days at 260 nm (probe) for H2O; and on different days and by different probe wavelengths (260 and 274 nm) for D2O. | |||
| τ a1 | 0.4 ± 0.1 | 0.6 ± 0.1 | 1.5 ± 0.2 |
| τ a2 | 0.6 ± 0.1 | 0.7 ± 0.1 | 1.1 ± 0.3 |
| τ b1 | 1.7 ± 0.3 | 2.5 ± 0.3 | 1.5 ± 0.3 |
| τ b2 | 3.5 ± 0.5 | 2.9 ± 0.4 | 0.8 ± 0.2 |
| τ c1 | 84 ± 10 | 128 ± 20 | 1.5 ± 0.2 |
| τ c2 | 28 ± 2 | 52 ± 5 | 1.9 ± 0.2 |
| τ d | 300–1600 | 400–1400 | |
| r a | 0.60 ± 0.05 | 0.54 ± 0.04 | |
| r b | 0.67 ± 0.01 | 0.53 ± 0.01 | |
| r c | 0.25 ± 0.01 | 0.29 ± 0.02 |
4. Discussion
4.1. Deuterium isotope effect on kinetics and implications
Fig. 2 illustrates an important result regarding the geminate recombination of an excess electron with a neutral iodine atom. In the first 2 ps where the photoelectron signals decrease, the CTTS state barely evolves into the second reaction intermediate I·e−. Previously, geminate recombination with estimated time constants of ca. 30 ps was identified for a reaction intermediate (I·e− in our model) of this reaction; however, this recombination reaction does not occur within a 2 ps time range. Therefore, the ultrafast decay must be attributed to other sources. In general, a reduction in the photoelectron intensity during the reaction A → B implies that either the population is not completely transferred from A to B or that B has a smaller photodetachment cross section than A. If geminate recombination does not occur from the CTTS state or I-e−, the population in the CTTS state must be completely transferred to I·e−. Then, since the photoelectron intensity decreases by a greater amount for D2O than for H2O, we must assume different photodetachment cross sections for the reaction intermediates in H2O and D2O. This assumption is not supported theoretically, since the Born–Oppenheimer separation of the electronic and nuclear motions well describes the photodetachment process; the photodetachment cross sections should be similar for H2O and D2O. Thus, we conclude that geminate recombination occurs from the CTTS state and I-e− prior to the formation of I·e− as proposed in our kinetic model [eqn (1)].Although the photoelectron intensity decreases more rapidly for D2O than for H2O in the first several picoseconds, Table 1 shows that both τa1 and τa2 are larger for D2O than for H2O. These two findings may appear contradictory; however, they are not. Note that the photoelectron intensity decreases owing to geminate recombination of the excess electron with the iodine atom. In this sense, the observed photoelectron intensity approximately corresponds to the survival probability of the excess electron against geminate recombination. The recombination time constant from the CTTS state (τa2) has almost no isotope effect (τD2Oa2/τH2Oa2 = 1.1 ± 0.3), and recombination from the first reaction intermediate has no or a slightly negative isotope effect (τD2Oa2/τH2Oa2 = 0.8 ± 0.2). Because of these isotope-insensitive recombination time constants, the CTTS state and I-e− are more efficiently quenched by geminate recombination in D2O. The quantum yields in the first two steps of the CTTS reactions, i.e., ra and rb, are 0.60 and 0.67 for H2O and 0.54 and 0.53 for D2O, respectively. Thus, the slow response of water molecules in D2O to the electronic excitation of I− (aq) results in a higher yield of nondiffusive geminate recombination than that in H2O, which causes the faster decay of the photoelectron signal for D2O.
It is expected that the photoexcitation of I− (aq) induces the spatial expansion of the excess electron cloud, leading to Pauli repulsion with the surrounding water molecules. If the expansion of the hydration shell is the predominant response of the water molecules, the isotope effect may not be large because the total mass of water molecules is similar between H2O (18) and D2O (20). The observed isotope effect on τa1 is as large as a factor of 1.5, which suggests that the motion of hydrogen atoms is involved in the solvent response. Since the hydrogen atoms in water are partially positively charged, their locations greatly affect the electronic energy of the system. The hydrogen atoms are attracted by the excess electron cloud, which induces the reorientation of water molecules in the CTTS reaction.
In the first approximation of the CTTS reaction and a hydrated electron, water molecules may be regarded as nonpenetrable rigid objects. Then, reorientation and translation are the only possible responses of the water molecules. However, it is possible that intramolecular vibrations of water are involved in the dynamics. Resonance Raman spectroscopy of a hydrated electron revealed that the intra- and intermolecular vibrational frequencies of water in the first hydration shell are lower than those of pure liquid water,45–48 implying that an excess electron interacts with unoccupied σ* orbitals of water molecules and reduces their intra- and intermolecular vibrational frequency. Shkrob and co-workers performed quantum chemical calculations and estimated that about 18% of the charge density of the hydrated electron is distributed over the oxygen 2p orbital of water molecules in the first hydration shell.49,50 More recently, Larsenet al. proposed the even stronger penetration of the excess electron wavefunction into the water molecules.51 From these results, we anticipate that the excess electron wavefunction of the CTTS state partially penetrates into the unoccupied orbitals of the surrounding water molecules, which would induce the intramolecular vibrational dynamics of the water molecules. Considering the masses of the oxygen and hydrogen atoms, such motion is primarily that of hydrogen atoms with respect to the center of mass, which is close to the oxygen atom in a water molecule. The isotope effects observed for τa1 and τb1 may include such dynamics. Theoretical analysis by the quantum mechanical treatment of water molecules in the first hydration shell is expected to shed light on these microscopic details of the CTTS dynamics.
The values of τc1 and τc2 determined for both H2O and D2O are consistent with those obtained by TAS18,20–22,52,53 (i.e., τc1 of 56–70 and 90 ps and τc2 of 33 and 60 ps for H2O and D2O, respectively).20,52,53 Vilchiz et al. measured τc1 for various solvents including H2O and D2O and found that τ−1c1 is proportional to the diffusion coefficient of hydrated electrons in these solvents.52 The deuterium isotope effect on τc1 (1.5 ± 0.2) is consistent with the 1.3-factor difference (at 298 K) between the diffusion coefficients of hydrated electrons in H2O and D2O.54 The large isotope effect of τc2 is interesting, since Bradforth and coworkers found no correlation between τc2 and the diffusion coefficients of H2O, D2O, and other solvents.52,53 We speculate that the deuterium isotope effect on τc2 arises in part from the zero-point energy difference between I·e− in H2O and D2O, which changes the effective potential barrier for geminate recombination.
Table 1 shows that the geminate recombination time constants (τb2 and τc2) differ by an order of magnitude between the first and second intermediates in agreement with our previous study using excitation at 243 nm. This large difference in the geminate recombination time constant suggests that the first intermediate is a CP and the second intermediate is an SS state, since the geminate recombination in the SS state must be subjected to interference by water molecules, which separate the excess electron and the iodine atom. The overall results are graphically summarized in Fig. 6.
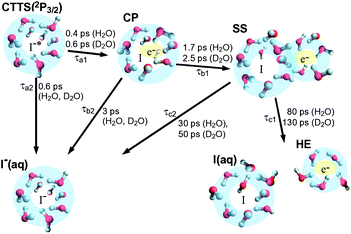 | ||
| Fig. 6 Graphical representation of the CTTS dynamics from I− (aq) to water after excitation at 226 nm. | ||
4.2. Deuterium isotope effect on PKED
All transient species exhibit PKEDs that are 10–20% (0.1–0.3 eV) narrower in D2O than in H2O (Fig. 5 and Table 2). For all chemical species involved in the CTTS reaction, instantaneous removal of the excess charge on photodetachment destabilizes their solvation structure. Therefore, the photodetachment transition occurs toward the repulsive slope of the potential energy surface along the solvation coordinate and the width of PKED on photodetachment is primarily determined by the spatial width of the wavefunction prior to photodetachment, which is smaller in D2O than in H2O for a reduced zero-point energy. Thus, narrower PKEDs from the SS state and hydrated electron are primarily ascribed to a zero-point energy difference in H2O and D2O. Furthermore, as described earlier, resonance Raman spectroscopy has shown that the vibrational frequencies of water in the first hydration shell decrease with respect to those of bulk water.45–48 Therefore, photodetachment from the SS state and hydrated electron may be associated with excitation of intramolecular bending and stretching vibrations of water molecules in the first hydration shell. Such an effect, if present, will result in a narrower PKED for D2O because of its lower intramolecular vibrational frequencies.| λ pump | NaI/H2Oa | NaI/H2Ob | NaI/D2Ob |
|---|---|---|---|
| 243 nm | 226 nm | 226 nm | |
| a Unpublished result. b The standard deviations of the mean for H2O were derived from measurements on different days at 260 nm (probe); and on different days and at different probe wavelengths (260 and 274 nm) for D2O. | |||
| CTTS | 1.59 | 1.53 ± 0.08 | 1.27 ± 0.04 |
| CP | 1.12 | 1.14 ± 0.04 | 1.01 ± 0.06 |
| SS | 0.93 | 0.95 ± 0.04 | 0.86 ± 0.04 |
| HE | 0.93 | 0.86 ± 0.03 | 0.76 ± 0.05 |
4.3. Similarity between spectra of SS state and hydrated electron
The spectrum of the SS state is virtually identical with that of a free hydrated electron. These two species are regarded as different regions on a free energy surface, in which the SS state is at the minimum and a hydrated electron is in the asymptotic region. The depth has been experimentally estimated by Iglev et al.23 to be 850 cm−1 and to be temperature independent. Then, the question arises as to whether PKE is expected to shift upon dissociation of the SS state into a hydrated electron and an iodine atom. Notice that a hydrated electron and a void (after photodetachment) have different electrostatic interaction energies with a neutral iodine atom. As indicated by the large dielectric constant of water, the Coulomb potential created by the negatively charged electron is screened by orientation and polarization of water molecules in the hydration shell. When the excess electron is instantaneously removed, this balance is destroyed and there remains a large Coulomb potential created by this hydration shell. However, the electronic states of the solvent molecules respond to the electron removal (macroscopically through the optical dielectric constant). The electric fields before and after the removal of an excess electron can be written as | (4) |
 | (5) |
where α is the dipole polarizability of the iodine atom. The electric field strength of the void [eqn (5)] is much greater than that of the hydrated electron because of the static dielectric constant (εs ≈ 80) is much larger than the optical dielectric constant (εop ≈ 1.8). However, using the value given in Ref. 55 (α ≈ 5.35 × 10⁻²⁴cm3), the interaction energies are estimated to be only |Vind| = 0.04 and 70 cm−1 for Fe and Fvoid, respectively at r = R0, where R0 (≈ 0.61 nm) is the estimated distance between the iodine atom and the hydrated electron in I·e−.23 The above consideration indicates that PKE does not vary more than 0.01 eV upon dissociation of the SS state into e−aq and I(aq), which is consistent with the absence of a large shift of PKE observed.
Previously, Staib and Borgis showed that the absorption spectrum of the SS state between Cl(aq) and e−aq and that of a free e−aq are indistinguishable (Fig. 7 of Ref. 29). Although the principle of TRPES differs from that of TAS, the inability to discriminate the SS state and the free e−aq is similar for the two methods.
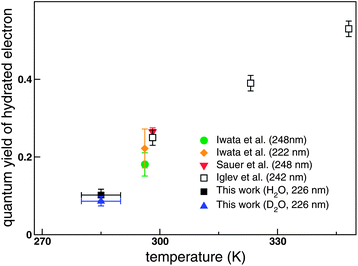 | ||
| Fig. 7 Quantum yield of a free hydrated electron as a function of temperature. The yields obtained by Iwata et al.56 and Sauer et al.57 were reduced by 18 and 9%, respectively, using the extinction coefficient of the hydrated electron determined by Hare et al.58 | ||
4.4. Temperature dependence of quantum yield of hydrated electron
The quantum yield of a hydrated electron in the 2P3/2 CTTS reaction is known to vary with temperature. The quantum yield23,56–58 is plotted against temperature in Fig. 7.The study by Iglev et al.23 investigated the widest temperature range among the previous studies. Also plotted are our values of 0.10 and 0.09 for H2O and D2O, determined by TRPES, respectively; these values were obtained as the product of the branching ratios rarbrc in Table 1. Since the temperature of our liquid beam is reduced by evaporative cooling after ejection into vacuum, the temperature at the sampling point is estimated to be 285 ± 5 K. Thus, the observed low quantum yield is primarily attributed to the lower temperature of our liquid beam. On the other hand, if the integral photodetachment cross section is smaller for a hydrated electron than for the CTTS state, the quantum yield may be underestimated; this possibility cannot yet be completely ruled out. However, even if such a small variation of the photodetachment integral cross section exists, it will affect the H2O and D2O results in the same manner. Therefore, our conclusion for the deuterium isotope effect on the CTTS reaction is unaltered by a small variation of the integral photodetachment cross section.4.5. Comparison with case of 2P1/2
The advantage of using an atomic anion as a solute is the simplification of the dynamics enabling detailed experimental and theoretical investigations. On the other hand, the 2P1/2 CTTS state introduces a slight complication owing to the possibility of a 2P1/2-2P3/2 fine structure transition in a halogen atom. Moskun et al. reported that I(2P1/2) could not be detected by TAS upon the 200 nm photodetachment of I− (aq), which suggests the occurrence of the 2P1/2-2P1/2 fine structure transition of I(aq) in the CTTS dynamics.59 On the other hand, Lübcke et al. performed a TRPES experiment on the 2P1/2 CTTS state of I− (aq).16 Interestingly, the general behavior of the PKED appeared to be consistent with the formation of the 2P1/2 state of I(aq). Lübcke et al. analyzed their experimental data by assuming that a large fraction of cold hydrated electrons are formed instantaneously after photoexcitation. In fact, the entire PKE component appeared simultaneously with the pump pulse, which differs from the case of 2P3/2 studied in this work. The excitation to the 2P1/2 CTTS band is known to result in a higher survival probability for a free hydrated electron and a longer ejection distance for an electron than the 2P3/2 band.18,59 It is still unclear whether there is any difference in the reaction mechanism that leads to the different quantum yields of a hydrated electron in the CTTS reactions from the 2P3/2 and 2P1/2 CTTS state.5. Conclusion
We performed TRPES to investigate the CTTS reaction from I− (aq) to bulk water (H2O and D2O) at an excitation wavelength of 226 nm. The time-dependent PKEDs exhibited a strong deuterium isotope effect in both the temporal evolution and the spectral distribution. The PKEDs were analyzed by global fitting by assuming a four-step kinetic model with two reaction intermediates. This model closely reproduced the observed PKEDs. A comparison of the results for H2O and D2O and the consideration of the Born–Oppenheimer picture of photodetachment suggest the occurrence of nondiffusive geminate recombination from the intermediates. The recombination from the first intermediate is an order of magnitude faster than that from the second intermediate, which is consistent with the first and second intermediates being the contact pair and solvent-separated states, respectively. Most of the elementary reaction steps are decelerated upon the deuteration of water, indicating the strong coupling of the electron dynamics with the motion of hydrogen atoms. On the other hand, geminate recombination from the CTTS state and the contact pair was least affected by deuteration. Consequently, the nondiffusive geminate recombination from these states occurs more efficiently in D2O. The photoelectron spectra of all species were narrower in D2O, which is attributed to a smaller zero point energy and a more confined wavefunction. It has been suggested that relaxation of a solute in water can occur nonexponentially, and that some dynamics could occur within 50 fs.60,61 We intend to perform experiments with an improved time resolution (<50 fs) to explore the ultrafast dynamics of the CTTS state.Acknowledgements
We thank Takuya Horio for assistance with the experiments.References
- R. S. Berry, S. A. Rice and J. Ross, Physical chemistry (second edition), Oxford Univ. Press, New York, 2000 Search PubMed.
- D. Eisenberg and W. J. Kauzmann, The structure and properties of water, Clarendon Press, Oxford, 1969 Search PubMed.
- J. D. Bernal and R. H. Fowler, J. Chem. Phys., 1933, 1, 515–548 CrossRef CAS.
- T. Head-Gordon and G. Hura, Chem. Rev., 2002, 102, 2651–2670 CrossRef CAS.
- J. D. Eaves, J. J. Loparo, C. J. Fecko, S. T. Roberts, A. Tokmakoff and P. L. Geissler, Proc. Natl. Acad. Sci. U. S. A., 2005, 102, 13019–13022 CrossRef CAS.
- P. Wernet, D. Nordlund, U. Bergmann, M. Cavalleri, M. Odelius, H. Ogasawara, L. A. Naslund, T. K. Hirsch, L. Ojamae, P. Glatzel, L. G. M. Pettersson and A. Nilsson, Science, 2004, 304, 995–999 CrossRef CAS.
- J. D. Smith, C. D. Cappa, B. M. Messer, W. S. Drisdell, R. C. Cohen and R. J. Saykally, J. Phys. Chem. B, 2006, 110, 20038–20045 CrossRef CAS.
- T. Tokushima, Y. Harada, O. Takahashi, Y. Senba, H. Ohashi, L. Pettersson, A. Nilsson and S. Shin, Chem. Phys. Lett., 2008, 460, 387–400 CrossRef CAS.
- O. Fuchs, M. Zharnikov, L. Weinhardt, M. Blum, M. Weigand, Y. Zubavichus, M. Bär, F. Maier, J. D. Denlinger, C. Heske, M. Grunze and E. Umbach, Phys. Rev. Lett., 2008, 100, 027801 CrossRef CAS.
- J. Forsberg, J. Gråsjö, B. Brena, J. Nordgren, L.-C. Duda and J.-E. Rubensson, Phys. Rev. B: Condens. Matter Mater. Phys., 2009, 79, 132203 CrossRef.
- K. Nishizawa, N. Kurahashi, K. Sekiguchi, T. Mizuno, Y. Ogi, T. Horio, M. Oura, N. Kosugi and T. Suzuki, Phys. Chem. Chem. Phys., 2011, 13, 413–417 RSC.
- J. V. Coe, G. H. Lee, J. G. Eaton, S. T. Arnold, H. W. Sarkas, K. H. Bowen, C. Ludewigt, H. Haberland and D. R. Worsnop, J. Chem. Phys., 1990, 92, 3980–3982 CrossRef CAS.
- J. V. Coe, S. M. Williams and K. H. Bowen, Int. Rev. Phys. Chem., 2008, 27, 27–51 CrossRef CAS.
- Y. Tang, H. Shen, K. Sekiguchi, N. Kurahashi, T. Mizuno, Y.-I. Suzuki and T. Suzuki, Phys. Chem. Chem. Phys., 2010, 12, 3653–3655 RSC.
- K. R. Siefermann, Y. Liu, E. Lugovoy, O. Link, M. Faubel, U. Buck, B. Winter and B. Abel, Nat. Chem., 2010, 2, 274–279 CrossRef CAS.
- A. Lübcke, F. Buchner, N. Heine, I. V. Hertel and T. Schultz, Phys. Chem. Chem. Phys., 2010, 12, 14629–14634 RSC.
- A. T. Shreve, T. A. Yen and D. M. Neumark, Chem. Phys. Lett., 2010, 493, 216–219 CrossRef CAS.
- X. Chen and S. E. Bradforth, Annu. Rev. Phys. Chem., 2008, 59, 203–231 CrossRef CAS.
- J. A. Kloepfer, V. H. Vilchiz, V. A. Lenchenkov and S. E. Bradforth, Chem. Phys. Lett., 1998, 298, 120–128 CrossRef CAS.
- J. A. Kloepfer, V. H. Vilchiz, V. A. Lenchenkov, A. C. Germaine and S. E. Bradforth, J. Chem. Phys., 2000, 113, 6288–6307 CrossRef CAS.
- J. A. Kloepfer, V. H. Vilchiz, V. A. Lenchenkov, X. Chen and S. E. Bradforth, J. Chem. Phys., 2002, 117, 766–778 CrossRef CAS.
- V. H. Vilchiz, J. A. Kloepfer, A. C. Germaine, V. A. Lenchenkov and S. E. Bradforth, J. Phys. Chem. A, 2001, 105, 1711–1723 CrossRef CAS.
- H. Iglev, A. Trifonov, A. Thaller, I. Buchvarov, T. Fiebig and A. Laubereau, Chem. Phys. Lett., 2005, 403, 198–204 CrossRef CAS.
- M. K. Fischer, A. Laubereau and H. Iglev, Phys. Chem. Chem. Phys., 2009, 11, 10939–10944 RSC.
- S. E. Bradforth and P. Jungwirth, J. Phys. Chem. A, 2002, 106, 1286–1298 CrossRef CAS.
- W.-S. Sheu and P. J. Rossky, J. Phys. Chem., 1996, 100, 1295–1302 CrossRef CAS.
- W.-S. Sheu and P. J. Rossky, J. Am. Chem. Soc., 1993, 115, 7729–7735 CrossRef CAS.
- D. Borgis and A. Staib, J. Chem. Phys., 1996, 104, 4776–4783 CrossRef CAS.
- A. Staib and D. Borgis, J. Chem. Phys., 1996, 104, 9027–9039 CrossRef CAS.
- Y. Tang, Y.-I. Suzuki, H. Shen, K. Sekiguchi, N. Kurahashi, K. Nishizawa, P. Zuo and T. Suzuki, Chem. Phys. Lett., 2010, 494, 111–116 CrossRef CAS.
- H. Shen, N. Kurahashi, T. Horio, K. Sekiguchi and T. Suzuki, Chem. Lett., 2010, 39, 668–670 CrossRef CAS.
- W. Keller, H. Morgner and W. Muller, Mol. Phys., 1986, 58, 1039–1052 CrossRef CAS.
- M. Faubel and T. Kisters, Nature, 1989, 339, 527–529 CrossRef CAS.
- F. Mafuné, Y. Takeda, T. Nagata and T. Kondow, Chem. Phys. Lett., 1992, 199, 615–620 CrossRef CAS.
- W. Kleinekofort, J. Avdiev and B. Brutschy, Int. J. Mass Spectrom. Ion Processes, 1996, 152, 135–142 CrossRef CAS.
- W. L. Holstein, M. R. Hammer, G. F. Metha and M. A. Buntine, Int. J. Mass Spectrom., 2001, 207, 1–12 Search PubMed.
- M. Ukai, A. Yokoya, K. Fujii and Y. Saitoh, Radiat. Phys. Chem., 2008, 77, 1265–1269 CrossRef CAS.
- B. Winter and M. Faubel, Chem. Rev., 2006, 106, 1176–1211 CrossRef CAS.
- B. Winter, R. Weber, W. Widdra, M. Dittmar, M. Faubel and I. V. Hertel, J. Phys. Chem. A, 2004, 108, 2625–2632 CrossRef CAS.
- C. D. Cappa, W. S. Drisdell, J. D. Smith, R. J. Saykally and R. C. Cohen, J. Phys. Chem. B, 2005, 109, 24391–24400 CrossRef CAS.
- M. Faubel, B. Steiner and J. P. Toennies, J. Chem. Phys., 1997, 106, 9013–9031 CrossRef CAS.
- B. Winter, R. Weber, I. V. Hertel, M. Faubel, P. Jungwirth, E. C. Brown and S. E. Bradforth, J. Am. Chem. Soc., 2005, 127, 7203–7214 CrossRef CAS.
- C. D. Wick and S. S. Xantheas, J. Phys. Chem. B, 2009, 113, 4141–4146 CrossRef CAS.
- P. R. Bevington and D. Robinson, Data Reduction and Error Analysis for the Physical Sciences, McGraw-Hill Inc., US, 3rd edn, 2002 Search PubMed.
- M. J. Tauber and R. A. Mathies, J. Phys. Chem. A, 2001, 105, 10952–10960 CrossRef CAS.
- M. Mizuno and T. Tahara, J. Phys. Chem. A, 2001, 105, 8823–8826 CrossRef CAS.
- M. J. Tauber and R. A. Mathies, Chem. Phys. Lett., 2002, 354, 518–526 CrossRef CAS.
- M. J. Tauber and R. A. Mathies, J. Am. Chem. Soc., 2003, 125, 1394–1402 CrossRef CAS.
- I. A. Shkrob, J. Phys. Chem. A, 2007, 111, 5223–5231 CrossRef CAS.
- I. A. Shkrob, W. J. Glover, R. E. Larsen and B. J. Schwartz, J. Phys. Chem. A, 2007, 111, 5232–5243 CrossRef CAS.
- R. E. Larsen, W. J. Glover and B. J. Schwartz, Science, 2010, 329, 65–69 CrossRef CAS.
- V. H. Vilchiz, X. Chen, J. A. Kloepfer and S. E. Bradforth, Radiat. Phys. Chem., 2005, 72, 159–167 CrossRef CAS.
- J. A. Kloepfer, PhD thesis, University of Southern California, Los Angeles, 2002.
- K. H. Schmidt, P. Han and D. M. Bartels, J. Phys. Chem., 1992, 96, 199–206 CrossRef CAS.
- D. R. Lide, CRC Handbook of Chemistry and Physics 2008–2009, Crc Pr I Llc, 89th edn, 2008 Search PubMed.
- A. Iwata, N. Nakashima, M. Kusaba, Y. Izawa and C. Yamanaka, Chem. Phys. Lett., 1993, 207, 137–142 CrossRef CAS.
- M. C. Sauer, R. A. Crowell and I. A. Shkrob, J. Phys. Chem. A, 2004, 108, 5490–5502 CrossRef CAS.
- P. M. Hare, E. A. Price, C. M. Stanisky, I. Janik and D. M. Bartels, J. Phys. Chem. A, 2010, 114, 1766–1775 CrossRef CAS.
- A. C. Moskun, S. E. Bradforth, J. Thøgersen and S. Keiding, J. Phys. Chem. A, 2006, 110, 10947–10955 CrossRef CAS.
- R. Jimenez, G. R. Fleming, P. V. Kumar and M. Maroncelli, Nature, 1994, 369, 471–473 CrossRef CAS.
- S. Roy and B. Bagchi, J. Chem. Phys., 1993, 99, 9938–9943 CrossRef CAS.
Footnote |
| † Electronic Supplementary Information (ESI) available: 2D maps of residuals of the global fit (Fig. S1) and observed and fitted photoelectron spectra (Fig. S2). See DOI: 10.1039/c0sc00650e/ |
| This journal is © The Royal Society of Chemistry 2011 |

