Alkaline phosphatase enzymatic signal amplification for fast, sensitive impedimetric DNA detection†‡
Miriam
Kaatz
ab,
Holger
Schulze
a,
Ilenia
Ciani
b,
Fred
Lisdat
c,
Andrew R.
Mount
*b and
Till T.
Bachmann
*a
aUniversity of Edinburgh, College of Medicine and Veterinary Medicine, Division of Pathway Medicine, 49 Little France Crescent, Edinburgh, UK. E-mail: till.bachmann@ed.ac.uk; Tel: +44 (0)131 242 6278
bEaStCHEM & University of Edinburgh, School of Chemistry, West Mains Road, Edinburgh, UK. E-mail: a.mount@ed.ac.uk; Tel: +44 131 650 4747
cUniversity of Applied Sciences Wildau, Biosystems Technology, Bahnhofstrasse, Wildau, Germany
First published on 19th October 2011
Abstract
Enzymatic signal amplification by the deposition of insoluble product on the electrode surface enhances impedimetric DNA detection sensitivity. This work demonstrates a method which gives the required detection sensitivity at significantly reduced enzyme reaction times, and demonstrates the capability for DNA SNP discrimination of biologically relevant sequences. This opens up the prospect of more rapid and relevant multiparameter impedimetric bioassays.
Single nucleotide mismatch (SNP) detection has been widely reported on surfaces using microarrays with optical readout, most commonly fluorescence.1–3 This is a very sensitive method, but optical detection generally has the disadvantage of requiring fairly complex and fragile equipment, which is not easy to miniaturize, which necessitates great efforts to develop applications beyond clinical laboratories. As an alternative, we propose surface SNP detection using electrochemical impedance spectroscopy (EIS). Label-free EIS sensing of DNA hybridisation events on single stranded DNA (ssDNA)-modified planar gold electrodes4,5 is an attactive method but to achieve sensitivity in the required pico- to low nano-molar range, particularly in biologically relevant samples, signal amplification is often necessary. Label-free detection using hairpin structures has also been successfully employed as an alternative method to achieve the required sensitivity,6,7 but the constraints of hairpin probe design can limit the range of detectable target sequences.
We follow an amplification strategy for linear single-strand probe detection in which two insoluble dyes are generated by enzymatic reaction. These precipitate on the surface thus increasing the impedance signal in the presence of the ferri/ferrocyanide redox couple. Similar assays have been reported in previous studies8,9 and these have also been used for antibody detection;10 however, the time to result was slow, with 20 to 40 min of enzyme reaction being required for sufficient signal enhancement. SNP detection has also been demonstrated using a different amplification strategy,8 but this method is rather complex, requiring the use of polymerase to extend the probe sequence and a biotin-labelled nucleotide to mark SNP presence.
We now address both these issues, first determining that sensitive detection can be carried out on a shorter, more practical timescale for e.g. array detection and producing a model for precipitate layer formation consistent with these findings. Based on these results we develop the method to demonstrate SNP detection in biologically relevant targets coding for Klebsiella pneumonia carbapenemase (KPC). KPC is an enzyme which is able to neutralise a variety of carbapenem antibiotics. This target SNP detection is important as carbapenems are used to treat bacteria which are resistant against penicillin and cyclophan.11,12
Scheme 1 shows the hybridisation assay employed. Before probe immobilisation polycrystalline gold disc electrodes (IJ Cambria Scientific, UK, 2 mm diameter) were polished successively to optical smoothness using Carbimet papers and Al2O3 powder (α-alumina powder; 1 μm, 0.3 μm, and 0.05 μm, IJ Cambria) and cleaned by immersion in hot piranha solution (70% concentrated sulfuric acid, 30% hydrogen peroxide) for 20 min (caution: piranha reacts violently with organic compounds and should not be stored in closed containers). The electrodes were then washed thoroughly with first distilled water, then with absolute ethanol, and blown dry in a stream of nitrogen. All DNA was synthesised by Metabion, Germany. Probe DNA (PM, with sequence from 5′ to 3′ of: HS-TTT TTT TTT TTT TTG TAC GCG ATG GAT ACC GG, where HS = thiol) was immobilised (10 μM DNA in 10 mM Phosphate buffer, 3.7 mM KCl, 137 mM NaCl for 16 h) onto the cleaned electrodesvia chemisorption to give close-packed monolayer coverage, followed by treatment with 6-mercapto-1-hexanol (1 mM in deionised H2O, 30 min), to displace unspecifically bound probe and block any areas which were not covered by DNA.13 Subsequently, hybridisation with the biotinylated complementary target (target, with sequence B-TTG CGC CTG AGC CGG TAT CCA TCG CGT ACA CAC CGA TGG A, where B = biotin) or completely non-complementary target (nc target, sequence B-GCG AAA GGC CTT GTG GTA CTG CCT GAT AGG GTG CTT GCG A) was achieved by immersing the electrodes in the appropriate concentration of the required target in 2 × SSC buffer solution (300 mM NaCl, 300 mM Na-citrate) for 1 h at 55 °C, followed by washing twice with 2 × SSC buffer (55 °C). For the amplification reaction streptavidin-alkaline phosphatase (AP, Sigma, S2890, 20 U and 8 mg ml−1 BSA in ethanolamine buffer, which is 100 mM ethanolamine, 100 mM KCl and 10 mM MgCl2) was conjugated to the biotinylated target sequence and unbound enzyme was then washed away with ethanolamine buffer.
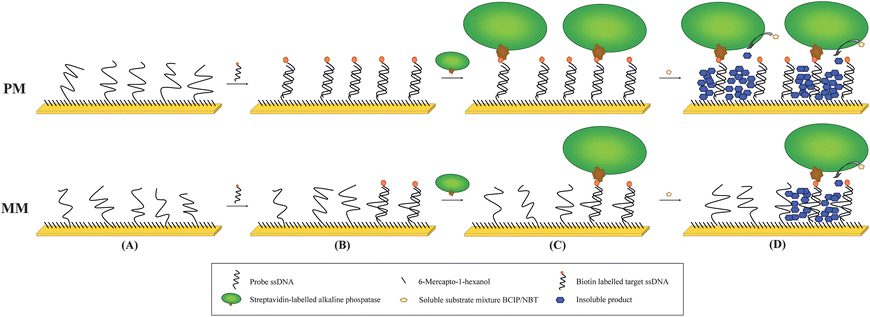 | ||
| Scheme 1 Proposed model for the amplification reaction investigated in this work. A DNA probe (top: perfect match, PM; bottom: single mismatch, MM) is immobilised onto a gold electrode (A) as a near close-packed layer and any remaining surface then blocked with short strands (MCH, 6-mercapo-1-hexanol). In the second step a biotinylated target is hybridised to the probe (B). A streptavidin-alkaline phosphatase (AP) is then coupled to the biotinylated probe (C). This is followed by the amplification reaction, which is started by adding the substrate mixture. The soluble substrates are converted to insoluble products and precipitate on the surface where they accumulate with time (D). | ||
The enzymatic reaction was started by the addition of a disodium 5-Bromo-4-chloro-3-indolyl phosphate/nitro blue tetrazolium (BCIP/NBT, Sigma B6404) substrate mixture. These soluble substrates are converted to insoluble dye products, which precipitate and cause a blocking of the electrode surface (Scheme 2).9,14SNP experiments were carried out using the same method and target, but with single base mismatched probe (MM, the same sequence as PM, but with G replaced by A in the bold position). Blocking was then detected by carrying out Faradaic EIS at a dc potential of +220 mV, corresponding to the measured ferri/ferrocyanide standard reduction potential, with a superimposed root mean squared AC voltage amplitude of 10 mV in the frequency, ω, range between 100 kHz and 0.1 Hz in 1 mM/1 mM ferri/ferrocyanide, 100 mM KCl solution. The three-electrode arrangement used functionalised gold as working electrode (2 mm in diameter), an Ag/AgCl/Cl− (3 M) reference electrode and a platinum wire counter electrode. Spectra were recorded and analysed using a PC-controlled PGSTAT-12 potentiostat (Windsor Scientific) running FRA software, both before (ba) and after (aa) amplification.
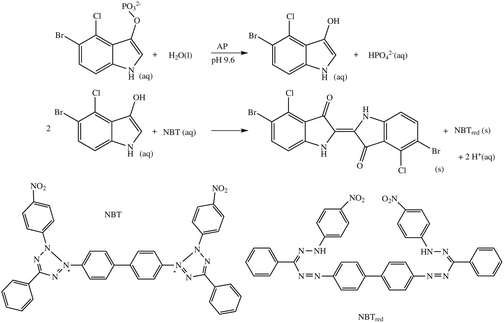 | ||
| Scheme 2 The AP catalysed reaction between 5-bromo-4-chloro-3-indolyl phosphate and the nitroblue tetrazolium ion (NBT). | ||
After 30 mins of amplification reaction a large increase in EIS impedance was obtained for the PM/target complex (Fig. 1), consistent with the observed formation of a dark blocking layer. These impedance data fitted well to an equivalent circuit (Scheme 3), which consists of solution resistance (Rs), charge transfer resistance (Rct) and a constant phase element (CPE) to account for the surface nano-roughness of the covered gold electrode.15 A Warburg impedance was not required in this circuit since no diffusion region was observed in the applied frequency range, which is consistent with a rate limitation caused by charge transfer at a blocking layer, rather than mass transfer, in the frequency range studied.
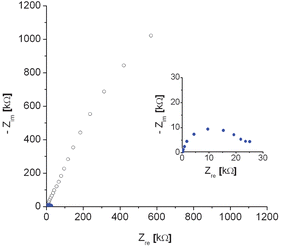 | ||
| Fig. 1 Nyquist EIS plot recorded before (full blue circles) and after 30 min enzymatic amplification reaction (open black circles) for a PM probe modified electrode, hybridised with target (100 nM, 60 min) and subsequent coupling of alkaline phosphatase according to Scheme 1. The inset shows the EIS plot before amplification at enhanced scale. | ||
 | ||
| Scheme 3 Equivalent circuit used for fitting of EIS data. Rs: solution resistance, Rct: charge transfer resistance, CPE: constant phase element. | ||
Typical fitting parameters obtained at different amplification times are shown in Table 1. It is clear that the value of Rs is fixed by the ionic solution resistance, as this does not vary systematically with amplification time; any variation can be attributed to differences in the distance between working and reference electrodes, as this was fixed manually in the measurement cell.
| ba | aa 5 min | aa 30 min | |
|---|---|---|---|
| R s [Ω] | 207 ± 22 | 271 ± 27 | 265 ± 4 |
| R ct [kΩ] | 15.7 ± 4.0 | 2176 ± 257 | 6270 ± 475 |
| Y 0 [μF sn−1] | 0.75 ± 0.29 | 1.61 ± 0.36 | 1.47 ± 0.22 |
| n | 0.91 ± 0.02 | 0.72 ± 0.05 | 0.74 ± 0.05 |
The CPE (Z = Y0−1(jω)−n) models the non-ideal capacitance of the electrode double layer. One model to explain the factor n is that it is due to the roughness of the electrode surface, with n (0.5 < n < 1) accounting for the deviation of the electrode from the ideal capacitive behaviour of a flat surface (n = 1). In this case, n correlates with the dimensionality (D) of the electrode16 as n = (D − 1)−1. In this work, the value of n is seen to decrease significantly after the enzymatic reaction, which is consistent with an electrode of increased dimensionality. This can be explained as the near 2D nature of the coated electrode is made more 3D due to localised precipitation on the electrode surface during amplification. For all data it is comforting that Y0 corresponds to a microFarad capacitance, which is expected for the double layer capacitance of an electrode of this dimension.4,17,18
By contrast, Rct shows a significant increase after amplification which indicates that the precipitation has the biggest effect on the charge transfer reaction; this was therefore chosen as the analytical signal. Significant differences were found between Rct values for single electrodes both before and after amplification, with Rct values before amplification of 15.7 ± 4.0 kΩ for 6 electrodes (i.e. 25% standard deviation, sd). This relatively large sd is likely to reflect film to film variation, which we attribute to differences in the structure of the probe-target film. For close-packed pure MCH films pinholes have been established as determining the charge transfer response19 and in this case, the measured resistance is then proportional to the number of pinholes. This variation could therefore indicate variation in the numbers and/or sizes of pinholes in the layer.
The corresponding Rct values for these PM probe coated electrodes when hybridised with 100 nM target and then incubated with the substrate solution for 30 min, were 6270 ± 475 kΩ (8% sd). This magnitude and the markedly reduced variation is consistent with blocking of the vast majority of pinholes, which reduces the initial variability in film structure. Some layer by layer variation can be offset by calculating amplification factors (the ratio of Rct after amplification (aa) to that before amplification (ba)) for each electrode, which gave an amplification factor of 365 ± 81 (or 22% sd). This is a vast signal amplification, but the time-to-result is relatively long. When the substrate incubation time was decreased to 5 min the amplification factor was still 164 ± 21 (13% sd), which implies that most of the amplification in signal can be achieved within the first few minutes with comparable or even reduced variability. One reason for reduced variability may be that the shorter substrate incubation time gave smaller EIS Rct semicircles for the amplified data, which enabled more accurate data fitting to a larger portion of the semicircle. Therefore, 5 min was chosen for the characterisation of assay sensitivity and selectivity. This was investigated by measuring amplification after hybridisation with varying target concentrations (Fig. 2). The limit of detection (LOD), which was calculated to be when the signal was greater than the mean of the non specific signal in the absence of target (amplification factor 1.03 ± 0.25) plus three times its standard deviation, corresponds in this limited set of data to a concentration of 1 nM target. This is a higher LOD than reported in other studies using enzymatic amplification6,7 but even this limited study produces an LOD sufficient to detect concentrations in the PCR relevant range. Consideration of Langmuir probe target binding thermodynamics indicates that the fraction of probe with bound target is given by KD−1ctarget/(1 + KD−1ctarget) and that the binding fraction will be proportional to target concentration at small target concentrations well below the dissociation constant, KD, where KD−1ctarget ≪ 1. As the amplified Rct value is likely to be proportional to the amount of surface-bound phosphatase, which itself will be proportional to the amount of bound target at these low coverages, this therefore explains the essentially linear increase in Rct with target concentration observed between 1 and 10 nM, and suggests that the PM dissociation constant, KD,PM, is of the order of μM.
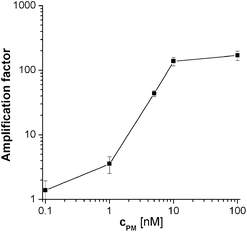 | ||
| Fig. 2 Calibration curve for the PM probe after hybridisation with different target DNA concentrations and 5 min enzymatic amplification. Mean values and standard deviations were calculated from at least 4 different electrodes. 2 × SSC was used as hybridisation buffer. | ||
This is entirely consitent with the dissociation constants previously reported for probe-target complexes of similar length, with similar surface binding chemistry and using film production methods similar to those used in this work, which have been reported to range between hundreds of nanomolar and micromolar4,20,21 with the highest (micromolar) dissociation constants being observed for the highest probe density, close packed films.19 However, above these concentrations, the amplified value of Rct can be seen to rapidly plateau. This can be explained by the fact that the amplified Rct value will depend on the amount of surface-bound phosphatase. As this enzyme is relatively large (Fig. 1(c), with the streptavidin conjugate having a footprint of ∼134 nm222 - compared to a calculated close packed cross sectional area of around 2.8 nm2 for linear DNA23) - it is estimated to occupy of the order of 35 times the surface area of the probe. A close-packed enzyme layer will therefore be expected to form on binding to randomly distributed surface bound biotinylated target at fractional target coverages much lower than 1 (i.e. well below monolayer target binding). Once a close packed enzyme layer has been formed, the further target binding expected at higher target concentrations will not lead to further enzyme binding as the bound biotinylated target will be sterically inaccessible to the enzyme, and hence there will be no further amplification. On considering the relative sizes of enzyme and PM probe-target duplex this is likely to occur at target binding fractions at or below 0.035; as the binding fraction is given at these low fractional coverages by KD,PM−1ctarget the target concentration where the plateau is observed is again consistent with a KD,PM of the order of μM.
Assay selectivity was then investigated by using 100 nM nc target for hybridisation. Given the established sensitivity of the assay to small binding fractions, this relatively high concentration was a real test of selectivity. It is therefore comforting that this gave a statistically insignificant increase in Rct (amplification factor of 1.7 ± 0.4) indicating that non-specific binding is insignificant. Selectivity for a single mismatch sequence was then tested, using MM probe films hybridised with 100 nM target. This is an even more challenging test, as although this mismatch should cause a relative destablisation of the formed duplexes at the hybridisation temperature of 55 °C and an increased dissociation constant for target with MM probe, KD,MM, compared to PM probe, 100 nM is a concentration well into the amplification plateau for PM (Fig. 2), where some MM binding and significant amplification would be expected. Despite this, discrimination between target binding to the PM probe and MM probe was found to be possible (although the observed amplification factor for the MM, 66% of that for PM, was non-optimal under these conditions). As either lower target concentrations or increased stringency would need to be employed for increased SNP discrimination, selectivity was therefore enhanced by decreasing the salt concentration in the hybridisation buffer from 2 × SSC to 0.5 × SSC (Fig. 3).
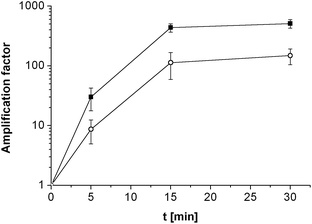 | ||
| Fig. 3 Amplification factor depending on the enzymatic reaction time for PM probe (full square) and MM probe (open circle) films hybridised with 100 nM target using 0.5 × SSC as hybridisation buffer. Mean values and standard deviations were calculated from four electrodes. The lines pass through 1 at 0 min as the amplification factors equal 1 by definition. | ||
Comparing the amplification factors for PM and MM after hybridisation with 0.5 × SSC again showed discrimination after 5 min of enzymatic reaction with a PM/MM amplification factor ratio of 3.5 ± 2.0. Following the reaction with time (Fig. 3) revealed that, although as expected the amplification factors increased significantly with time, the ratio of PM/MM amplification factors remained constant within experimental error even after 30 min (ratio after 15 min, 3.9 ± 1.9 and after 30 min, 3.4 ± 1.2).
It is significant that the maximum amplification factor of MM film does not approach the maximum value of the PM film at this target concentration, even at long times. It therefore appears as if the probe film surface does not ever become completely covered with insoluble product. This is consistent with our model of localised precipitation of product in the vicinity of the enzyme at low bound target coverage, which is inhibited when the access to the enzyme site is blocked. At these very low bound enzyme coverages the resistance at any time appears proportional to the number of enzymes and hence of bound targets. This explains why constant amplification factor ratios are observed, independent of time, and suggests that the ratio of these amplification factors at all the measured times is determined by KD,MM/KD,PM.
In conclusion, these results demonstrate the principle of SNP determination using this amplification assay and suggest that 5 min amplification times, markedly shorter than those employed previously, are sufficient for PM/MM discrimination. Longer times lead to no greater discrimination and the longest times (in this case greater than 15 mins) lead to no further signal amplification with time. The observed variation in these data is likely due to the small size of the data set in these proof-of-principle exepriments, which suggests that measurement at t < 5 min may be feasible, particularly with larger sample data sets; in this case, the lower time limit will be determined by the time required to deposit sufficient insoluble product to ensure reliable and statistically significant measured impedance increases after enzymatic reaction.
Notes and references
- J. Perkel, Nat. Methods, 2008, 5, 447–453 CrossRef CAS
.
- M. Y. Rubtsova, M. M. Ulyashova, T. T. Bachmann, R. D. Schmid and A. M. Egorov, Biochemistry (Moscow), 2011, 75, 1628–1649 CrossRef
.
- D. M. Leinberger, V. Grimm, M. Rubtsova, J. Weile, K. Schroppel, T. A. Wichelhaus, C. Knabbe, R. D. Schmid and T. T. Bachmann, J. Clin. Microbiol., 2010, 48, 460–471 CrossRef CAS
.
- J. Kafka, O. Paenke, B. Abendroth and F. Lisdat, Electrochim. Acta, 2008, 53, 7467–7474 CrossRef CAS
.
- M. Gębala and W. Schuhmann, ChemPhysChem, 2010, 11, 2887–2895 CrossRef
.
- X. Li, J. S. Lee and H. B. Kraatz, Anal. Chem., 2006, 78, 6096–6101 CrossRef CAS
.
- Y. Wang, C. Li, X. Ki, Y. Li and H. B. Kraatz, Anal. Chem., 2008, 80, 2255–2260 CrossRef CAS
.
- F. Patolsky, A. Lichtenstein and I. Willner, Nat. Biotechnol., 2001, 19, 253–257 CrossRef CAS
.
- F. Lucarelli, G. Marrazza and M. Mascini, Biosens. Bioelectron., 2005, 20, 2001–2009 CrossRef CAS
.
- T. Balkenhohl and F. Lisdat, Analyst, 2007, 132, 314–322 RSC
.
- K. Bush, Curr. Opin. Microbiol., 2010, 13, 558–564 CrossRef CAS
.
- T. R. Walsh, Int. J. Antimicrob. Agents, 2010, 36, S8–S14 CrossRef CAS
.
- T. M. Herne and M. J. Tarlov, J. Am. Chem. Soc., 1997, 119, 8916–8920 CrossRef CAS
.
- D. Athey, M. Ball, C. J. McNeil and R. D. Armstrong, Electroanalysis, 1995, 7, 270–273 CrossRef CAS
.
- J. S. Daniels and N. Pourmand, Electroanalysis, 2007, 19, 1239–1257 CrossRef CAS
.
-
M. E. Orazem and B. Tribollet, Electrochemical impedance spectroscopy, Wiley-Interscience, 2008 Search PubMed
.
- C. Witte and F. Lisdat, Electroanalysis, 2011, 23, 339–346 CrossRef CAS
.
- M. Revenga-Parra, Tania García, F. Pariente, E. Lorenzo and C. Alonso, Electroanalysis, 2010, 23, 100–107 CrossRef
.
-
H. O. Finklea, Self-Assembled Monolayers on Electrodes, John Wiley & Sons, Ltd, 2006 Search PubMed
.
- E. L. S. Wong, E. Chow and J. J. Gooding, Langmuir, 2005, 21, 6957–6965 CrossRef CAS
.
- A. W. Peterson, L. K. Wolf and R. M. Georgiadis, J. Am. Chem. Soc., 2002, 124, 14601–14607 CrossRef CAS
.
- H. Mao, T. Yang and P. S. Cremer, Anal. Chem., 2002, 74, 379–385 CrossRef CAS
.
- A. Halperin, A. Buhot and E. B. Zhulina, Biophys. J., 2005, 89, 796–811 CrossRef CAS
.
Footnotes |
| † This article is part of a web theme in Analyst and Analytical Methods on Future Electroanalytical Developments, highlighting important developments and novel applications. Also in this theme is work presented at the Eirelec 2011 meeting, dedicated to Professor Malcolm Smyth on the occasion of his 60th birthday. |
| ‡ The School of Chemistry is part of the EaStCHEM joint Chemistry Research School; we acknowledge the financial support of the Scottish Funding Council. |
| This journal is © The Royal Society of Chemistry 2012 |
