Quality control of routine sampling in chemical analysis
Analytical Methods Committee, AMCTB No 51
First published on 10th May 2012
Abstract
In sampling terminology, the ‘target’ is the mass of material that the customer needs to characterise, usually to support a decision about its acceptability or price. For most such materials there is an established sampling protocol regarded as fit for purpose. This is mainly because all targets are actually or potentially heterogeneous. But even when a protocol is followed exactly, repeat samples differ in composition from each other and from the target. Moreover, there is a distinct possibility that the target may be atypically heterogeneous. These circumstances, particularly the last, mean that a sample may not be fit for purpose, even when the sampling is executed strictly according to the protocol. And, of course, there is always the possibility that the sample was not collected according to the protocol! As either of these conditions might give rise to a suboptimal decision, it would be helpful to know when such an event occurred. That would call for some form of quality control on the sampling process.
Sampling and analytical uncertainties
Consider the uncertainties introduced into the result of a measurement by sampling a target and then analysing the sample. Usually these are independent actions so the combined uncertainty on the final result of an operation in statistical control isbased on sampling and analytical uncertainties described by variances σ2s and σ2a respectively. It is this combined uncertainty that is relevant for the customer in making decisions about the target. It is also relevant to setting action limits for control charts.
An out-of-control event could indicate an abnormally high value of σ2s or σ2a (or both). The ambiguity could be resolved by reanalysis of the two samples in a separate run, although standard analytical QC would also provide relevant information.
Basics
Quality control of sampling differs from the familiar analytical internal quality control (IQC), in which the charted variable is the analytical result on a control material that acts as a surrogate for the test materials. In sampling a surrogate target is not practicable—control has to be exercised by using duplicate results derived from the targets themselves.As always, there are complications. Firstly, the value of σ is likely to depend on the concentration of the analyte. In many industrial products the concentration of the analyte will itself be under good control, so that the concentration dependence of σ can be ignored. In other instances, especially with raw materials and in environmental sampling, analyte concentration, and therefore σ, will vary from target to target, and this variation has to be accommodated. Secondly, sampling uncertainty stems mainly (although not exclusively) from the heterogeneity of the target, and targets are likely to vary among themselves in the degree of heterogeneity and therefore in σs. This means that it would be unsafe to estimate a working value for σ from a single target—we need to establish a ‘typical’ value by considering a number of targets.
Setting up a control chart—uniform concentration
The basic experiment is random duplication of the established sampling procedure. Randomisation may require some ingenuity on the part of the sampler, but some suggestions for several sampling scenarios are available.1,2 For each target the actions shown in Fig 1 are required. | ||
| Fig. 1 Schematic diagram of actions required for quality control of sampling. | ||
The mean (x1 + x2)/2of the two results x1, x2 is the result required for reporting to the customer. The signed difference d = x1 − x2 would be a random value from a zero-centred distribution with standard deviation  . Values of the difference could be collected from successive targets until sufficient had accumulated to make a workably stable estimate sd of standard deviation σd. That will require at least ten targets and possibly robust statistics to accommodate the effect of atypical targets. Moreover the estimate is unlikely to stabilise sufficiently until perhaps 30 values are available, so the initial estimate must be reviewed periodically as data accumulate. A Shewhart control chart could then be set up with warning limits at ±2sd and action limits at ±3sd.
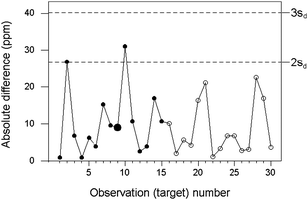
A simpler method is to create a one-sided chart based on absolute differences |d| = |x1 − x2|, with control lines at 2sd and 3sd. This approach obviates the sometimes difficult need to preserve the sign of d. Moreover, a robustified estimate of σd is simply given by 1.482 times the median of the absolute differences when a sufficient number have accumulated. As an example, we consider aluminium in an animal feeding stuff (Fig 2). The concentration of aluminium in successive targets varied between 75 and 125 ppm (mass fraction times 106) and σ was taken as independent of concentration. Control levels were derived from a robust estimate (sd = 13.4 ppm) based on pairs of results from 15 successive targets.
 | ||
| Fig. 2 Internal quality control of sampling and analysis combined, for the determination of aluminium in animal feedstuff, showing differences (circles) and control lines (dashed). The training set is shown by solid circles, with the median larger. | ||
Control chart for a wider concentration range
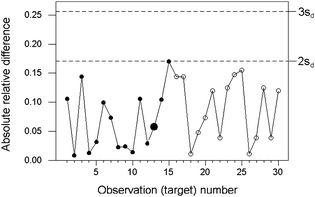
When wide ranges of concentration of the analyte are encountered, the uncertainty of the results will tend to increase with concentration to a degree that cannot be ignored. In such instances, individual observations of absolute difference between duplicated results would have to be scaled relative to the expected uncertainty for the observed concentration. In many instances a constant relative precision prevails and the scaling is simple to effect. Constant relative precision would be in most instances a safe interim assumption for setting up a control chart, subject to contra-indications based on longer-term observation of the system.The example in Fig 3 stems from the analysis of canned tuna for mercury, with concentrations ranging between 10 and 100 ppb (mass fraction times 109). Thirty successive batches were sampled. Inspection of the training data suggested that a constant relative precision (σ/c) would be a reasonable assumption. This was supported by the fact that all of the results were at least ten times greater than the detection limit of the analytical method.
 | ||
| Fig. 3 Internal quality control of sampling and analysis combined, for the determination of mercury in canned tuna, showing relative absolute differences (circles) and control lines (dashed). The training set is shown by solid circles, with the median larger. | ||
An extra twist?
Any tendency towards non-randomness in the duplicate samples (e.g., the submission of two splits of the same sample) would give rise to unduly small differences that could in principle be seen in these control charts, given enough data. This would not provide a sensitive test for non-randomness unless σs > σa and because, in any event, small differences are far more probable than large ones. However, given σs > σa, a sequence of values of |d| centred around σa suggests an unduly low sampling uncertainty that may need investigation.This Technical Brief was prepared for the Analytical Methods Committee by the Sampling Quality Subcommittee (Chair M H Ramsey) and drafted by M Thompson
Further reading
- Eurachem/CITAC Guide: Measurement uncertainty arising from sampling—a guide to methods and approaches ( 2007) 102pp. (Free download available from www.eurachem.org/guides) Search PubMed.
- Uncertainty from sampling, in the context of fitness for purpose. ( 2007) Accred Qual Assur12:503–513. (Easy reading.) Search PubMed.
| This journal is © The Royal Society of Chemistry 2012 |


