Investigation of surface Sr segregation in model thin film solid oxide fuel cell perovskite electrodes
WooChul
Jung†
* and
Harry L.
Tuller
Department of Materials Science and Engineering, Massachusetts Institute of Technology, Cambridge, MA 02139, USA. E-mail: wcjung@mit.edu; Fax: +1-617-258-5749; Tel: +1-617-253-2364
First published on 7th November 2011
Abstract
While SOFC perovskite oxide cathodes have been the subject of numerous studies, the critical factors governing their kinetic behavior have remained poorly understood. This has been due to a number of factors including the morphological complexity of the electrode and the electrode- electrolyte interface as well as the evolution of the surface chemistry with varying operating conditions. In this work, the surface chemical composition of dense thin film SrTi1−xFexO3-δelectrodes, with considerably simplified and well-defined electrode geometry, was investigated by means of XPS, focusing on surface cation segregation. An appreciable degree of Sr-excess was found at the surface of STF specimens over the wide composition range studied. The detailed nature of the Sr-excess is discussed by means of depth and take-off angle dependent XPS spectra, in combination with chemical and thermal treatments. Furthermore, the degree of surface segregation was successfully controlled by etching the films, and/or preparing intentionally Sr deficient films. Electrochemical Impedance Spectroscopy studies, under circumstances where surface chemistry was controlled, were used to examine and characterize the blocking effect of Sr segregation on the surface oxygen exchange rate.
Boarder contextSolid oxide fuel cells (SOFCs) are expected to play a major role in a sustainable energy future given their high potential conversion efficiency. A key challenge hindering SOFC development is the limited degree of understanding regarding the kinetics of the cathode processes and the resultant efficiency loss. Here, concurrent studies of chemical, morphological and electrochemical properties of a model cathode system, with well-defined thin film geometry, revealed the detailed nature of surface chemical segregation and its influence on cathode kinetics, providing guidance for high performance SOFC cathodes. |
1. Introduction
Concerns about the environmental consequences of fossil fuel combustion have stimulated interest in developing alternative environment-friendly energy sources. Amongst the various means for achieving improved energy conversion efficiency, the solid oxide fuel cell (SOFC) has received much attention given its high potential conversion efficiency, the flexibility that it offers with respect to fuel choices (hydrocarbons as well as hydrogen) and the reduced emissions associated with electrochemical energy conversion devices.1While SOFC metal oxide cathodes have been the subject of numerous studies, the mechanisms controlling their behavior have remained poorly understood.2–7 This has been due to a number of factors, including the morphological complexity of the electrode and the electrode- electrolyte interface,8 the evolution of the surface chemistry with varying operating conditions,9,10 and the difficulty in interpreting electrochemical properties with multiple processes involved.11 In this work, dense thin film SrTi1−xFxO3-δ (STF) electrodes, with considerably simplified and well-defined electrode geometry and electrode-electrolyte interface, were chosen as a model, representing mixed ionic electronic conducting (MIEC) perovskite oxide cathodes. The surface chemical composition of the STF thin films is investigated by means of X-ray photoelectron spectroscopy (XPS), focusing on surface cation segregation. The detailed nature of the surface segregation is discussed in terms of layer formation, structure, and possible driving forces. In addition to XPS, morphological and electrochemical properties are examined by Atomic Force Microscopy (AFM) and Electrochemical Impedance Spectroscoty (EIS), respectively, providing improved insight into the role of surface cation segregation on the SOFC cathode reaction rate.
2. Experimental
2.1. Sample preparation
STF thin films were prepared by means of pulsed laser deposition (PLD) from oxide targets of the respective materials and deposited onto (100) oriented single crystal yttria doped zirconia (YSZ) substrates for EIS measurement. One inch diameter oxide targets were prepared by the conventional mixed-oxide technique starting from iron(III) oxide (Alfa Aesar, 99.945%), strontium carbonate (Alfa Aesar, 99.99%), and titanium(IV) oxide (Alfa Aesar, 99.9%) powders. A Coherent (Santa Clara, CA) COMPex Pro 205 KrF eximer laser, emitting at a wavelength of 248 nm, was used for ablation. The deposition parameter configuration was 400 mJ/pulse laser energy, 8 Hz laser repetition rate, and an O2 working pressure of 10 mTorr. Film thicknesses ranging between 100 and 500 nm were determined by surface profilometry (Tencor P-10). Detailed information regarding oxide target preparation and PLD deposition conditions can be found in previous studies.12,132.2. Physical and chemical characterization
X-ray diffraction (XRD) measurements were performed on synthesized powders and deposited films using a Bragg-Brentano diffractometer (Rigaku RU300, Tokyo, Japan, Cu-Kα wavelength (λ = 1.541 Å)), indicating the films to be polycrystalline perovskite phase with highly (110) oriented texture over the whole range of Fe fraction. Limited reflections from (100) or (111) are sometimes observed above background noise level. There is no evidence of amorphous films, or diffraction peaks other than the ones in the cubic perovskite phase.14 The grain size, morphology, and surface roughness of the STF thin films were characterized by a Vecco Metrology (Santa Barbara, CA) D3000 atomic force microscope (AFM) with a Nanoscope IIIa controller. Micrographs were analyzed to determine the root mean square (RMS) surface roughness and grain size using Vecco's Nanoscope software (version 5.12r3). The chemical composition of the sample surfaces were measured in a Kratos Analytical (Manchester, UK) model Axis Ultra X-ray photoelectron spectrometer. A monochromated aluminum X-ray source of 1486.6 eV was used at a power of 150 W. Pass energy of 160 eV and 20 eV were used for survey and high resolution scans, respectively. Binding energy values were calibrated by setting the peak energy of the 1s electron in carbon, found as a surface contaminant in open air, to 285.0 eV. For depth-dependent composition determination, an Ar ion beam of 4 kV was used with 2 × 2 mm2 rastering area.2.3. Electrochemical measurements
A symmetrical structure, with identically sized STF electrodes on both sides of the YSZ electrolyte, was used for EIS measurements. Au mesh and Au paste were placed on each STF electrode surface, serving as current collectors. In order to confirm that any possible interactions between the Au and the oxygen did not influence the impedance spectra, photo-lithographically defined platinum patterns were sometimes fabricated between the YSZ substrate and the STF film, serving as a buried current collector. Both a custom-designed enclosed probe station, manufactured by McAllister Technical Services (Coeur d'Alene, ID) and a tube furnace were used for the EIS measurements at temperatures between 485 °C and 560 °C in air. EIS measurements, covering the frequency range from 7 mHz to 1 MHz, with amplitude of 20 mV, were performed with a Solarton 1260 or 1250 impedance analyzer operated in combination with a Solartron 1286 potentiostat/galvanostat.3. Results
3.1. Surface morphologies of STF thin films
An AFM image of the surface of an as-deposited SrTi0.5Fe0.5O3-δ film, designated as STF50, is shown in Fig. 1a. The lateral dimensions all span 1μm. The vertical dimension for the image is indicated on the z-axis scale as ∼10 nm. The STF film deposited at 700 °C onto a YSZ single crystal substrate (100, MTI Corporation) exhibited grain sizes in the range of 100–200 nm and an RMS surface roughness of less than 1 nm (e.g., 0.75 ± 0.12 nm) for a 500 nm thick layer, indicative of a highly smooth surface.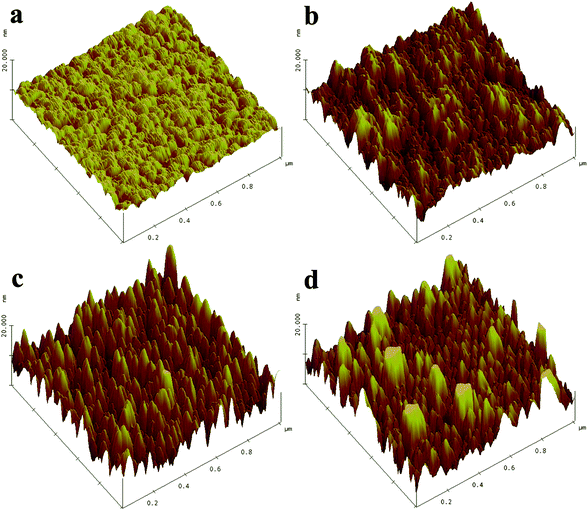 | ||
| Fig. 1 AFM micrograph of STF50 surfaces before (a) and after (b) acid etching, and subsequent annealing at (c) ∼550 °C and (d) 650 °C for 5 h. | ||
Surface morphological changes, induced by chemical and thermal treatments, in the films were also investigated. In this case, the STF film was etched by a 10% diluted buffered HF (NH4F : HF = 7![[thin space (1/6-em)]](https://www.rsc.org/images/entities/char_2009.gif) :
:![[thin space (1/6-em)]](https://www.rsc.org/images/entities/char_2009.gif) 1) solution for 20 s. Etch concentration and time for the etching process were chosen to remove a surface layer thickness between 5 and 10 nm, based on an average etch rate of ∼0.4 nm s−1. Fig. 1a-b provides AFM images of the STF50 film before and after chemical etching with the etching procedure increasing the roughness as illustrated,. However, the change in the total surface area is estimated to change by only a few percent (see Table 1).
1) solution for 20 s. Etch concentration and time for the etching process were chosen to remove a surface layer thickness between 5 and 10 nm, based on an average etch rate of ∼0.4 nm s−1. Fig. 1a-b provides AFM images of the STF50 film before and after chemical etching with the etching procedure increasing the roughness as illustrated,. However, the change in the total surface area is estimated to change by only a few percent (see Table 1).
After etching, the sample was then subsequently annealed during the impedance measurements between 485 and 560 °C in air. Lastly the sample was annealed at high temperature for longer period of time (650 °C for 5 h). The corresponding AFM images are shown in Fig. 1c-d. Following heat-treatment, the surface morphology becomes more rounded with some abnormally large grains developing. In general, surface roughness increases following chemical etching and heat-treatment. The RMS roughness of the film following etching and heat-treatment is calculated to be four times higher than that of the as-deposited film, while the change in the total surface area still falls within only a few percent of the initial value (see Table 1).
3.2. Surface chemical compositions of STF thin films
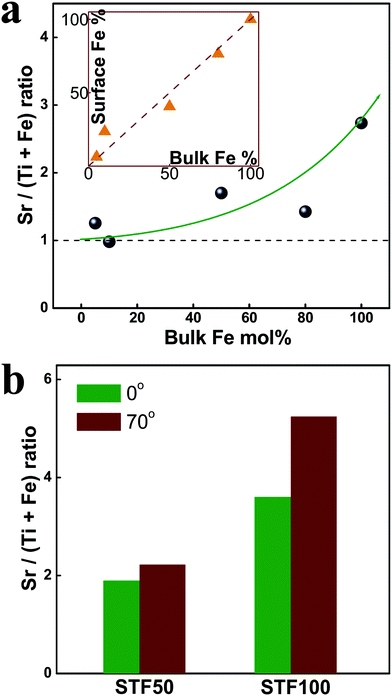 | ||
| Fig. 2 (a) Ratio between A- and B-site cations as a function of Fe fraction, measured by XPS. (Insert) Surface vs. bulk Fe mol fraction with respect to the total B-site cations. (b) Ratio between A- and B-site cations measured at two different take-off angles of 0 and 70° for 50 and 100 mol% Fe. | ||
Angle resolved measurements were also performed to obtain depth dependent information (see Fig. 2b). These spectra were measured at the two different take-off angles of 0 and 70°. The measured level of Sr-excess increases as the take-off angle is increased from 0 to 70 °C. Since higher take-off angle leads to shallower detecting depth, this result is consistent with Sr-excess existing largely very close to the surface.
Fig. 3 shows O1s XPS peaks with an energy range between 536 and 526 eV. There are three different oxygen peaks (oxygen chemistry) observed in Fig. 3a. The main O 1s peak, at a binding energy of 529 eV, is ascribed to the strontium titanate oxygen (SrTiO3), while the other peaks at binding energies of 531.8 and 534 eV correspond to hydroxyl and carbonate species, respectively.15 There was no evidence of metallic Sr at the surface. Following Ar-ion milling of 20 s, corresponding to a removal of a 0.6 nm thick STF layer, both oxygen peaks related to Sr(OH)2 and SrCO3 largely disappear as evident in Fig. 3b.
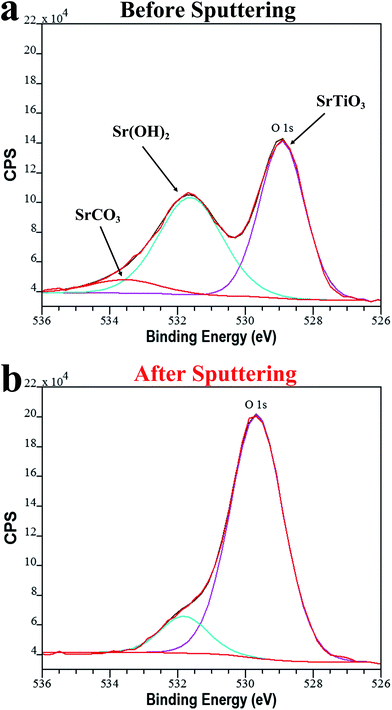 | ||
| Fig. 3 Oxygen 1s spectra for as-deposited STF50 film before (a) and after (b) Ar-ion milling of 20 s. | ||
XPS results as a function of a depth through the STF50 film by Ar-ion milling are shown in Fig. 4. The Sr content with respect to the other cations decreases as a function of depth and reaches nearly the stoichiometric composition, i.e., Sr/(Ti + Fe) = 1, deep within the film. The depth of the heavily Sr enriched region extends to about 10 nm from the surface.
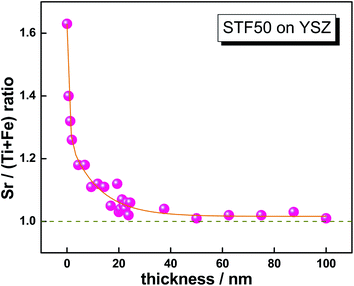 | ||
| Fig. 4 Depth dependent chemical composition obtained for STF50. Ratio between Sr and (Ti + Fe) vs. depth from surface. | ||
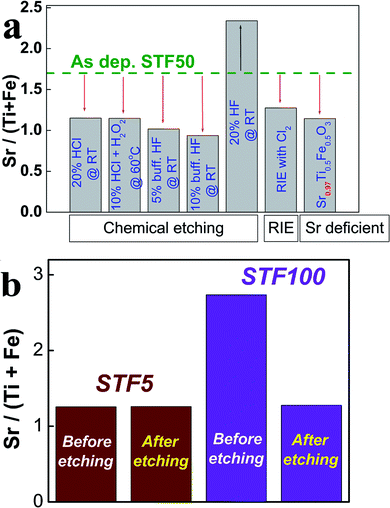 | ||
Fig. 5 (a) Changes in the ratio between A- and B-site cations for STF50 after etching the surface of the films or by preparation of Sr deficient film. (b) Changes in the ratio between A- and B-site cations for STF5 and 100 after etching the surface of the films by a 10% diluted buffered HF (NH4F:HF = 7![[thin space (1/6-em)]](https://www.rsc.org/images/entities/char_2009.gif) : :![[thin space (1/6-em)]](https://www.rsc.org/images/entities/char_2009.gif) 1) solution for 20 s. 1) solution for 20 s. | ||
Re-segregation, induced by post-annealing etched specimens, was also observed. After being etched in diluted HF solution for 20 s, each STF50 sample was rapidly heated to 400 °C, 500 °C, and 650 °C, respectively, and quenched after annealing for two hours at the respective temperature. As shown in Fig. 6, the Sr-to-(Ti + Fe) ratio for the etched specimen maintains nearly the same value up to 500 °C, while it increases again after annealing at 650 °C, indicating that the Sr re-distribution is kinetically hindered at temperatures of less than 500 °C. However, the Sr-to-(Ti +Fe) ratio remains the same even at 650 °C in case of the Sr deficient film, suggesting that the reduced Sr segregation for this material may be thermodynamically stable over the tested temperature range.
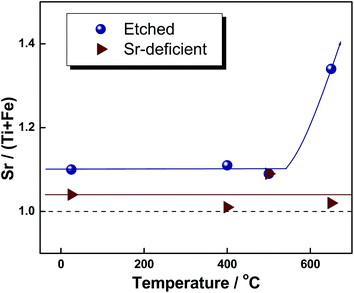 | ||
| Fig. 6 Effect of post-annealing on the chemically etched STF film (circles) and the Sr deficient film (triangles). | ||
3.3. Electrochemical properties of STF thin film electrodes
The area specific electrode resistance RSTF, obtained by EIS measurements in air, was measured before and after etching and is plotted as a function of reciprocal temperature in Fig. 7. Since the STF electrode resistance is governed by the surface oxygen exchange reaction, RSTF is an indicator of how slow or fast oxygen surface exchange takes place on the STF electrode. It turns out that etching reduces the magnitude of RSTF over all Fe compositions studied in this work. In case of SrFeO3-δ, designated as STF100, nearly an order of magnitude decrease in RSTF was obtained (Fig. 7b). To examine the thermal stability of the etched film, the impedance was repeatedly measured over six thermal cycle periods, i.e. one cycle includes heating-up and cooling-down between 485 and 560 °C. No significant differences in the impedance results were observed. However, after subsequent annealing at 650 °C for five hours, the resultant impedance increases, approaching the original un-etched values.
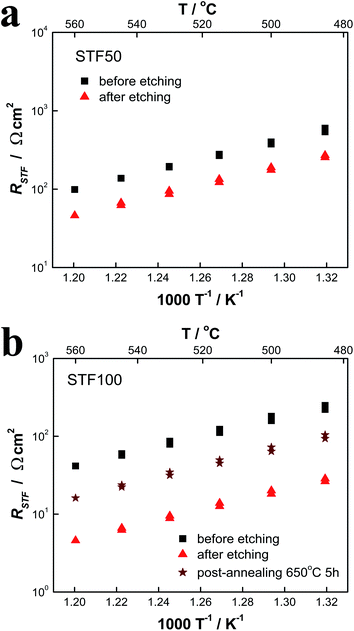 | ||
| Fig. 7 Change in RSTF upon chemical etching. (a) Temperature dependence of RSTF for STF50 before (black square) and after (red triangle) etching with corresponding activation energies of 1.26 ± 0.02 eV and 1.26 ± 0.03 eV, respectively. (b) Temperature dependence of RSTF for STF100 before (black square), after (red triangle) etching, and after subsequent annealing at 650 °C 5h (brown star) with corresponding activation energies of 1.27 ± 0.04 eV, 1.30 ± 0.03 eV, and 1.31 ± 0.04 eV, respectively. | ||
4. Discussion
4.1. Surface Sr segregation
Sr excess on SrTiO3 has been extensively studied with three different species reported: SrO island precipitation,21–23SrO excess in a cubic perovskite phase (SrTiO3),24–27 and a reconstructed Sr excess phase (SrO·n(SrTiO3)).25–29 Except for island formation, the other structures require a certain solubility of SrO in SrTiO3. Both experimental observations and numerical calculations demonstrate that the cubic perovskite structure can accommodate only limited amounts of excess SrO in the form of a solid solution,24–27,30i.e., less than 0.2 mol% SrO in reference 30. Likewise, the majority of literature suggests that the incorporation of planar defects in the form of rock salt structured layers is the likely mechanism for accommodating SrO excess. These planar defects, reflecting the additional SrO interlayers, lead to the formation of a structurally reconstructed Sr excess phase (SrO·n(SrTiO3), often referred to as “Ruddlesden-Popper (RP) phases.” Indeed, RP phases have been found, not only in SrO excess SrTiO3 systems, but also in pure SrTiO3 systems including single crystal SrTiO3. Surface RP phases in SrTiO3, or related doped systems, were observed by several surface characterization techniques including XPS,31STM,32neutron diffraction, TEM,33AFM,28 and combined XRD & SIMS,29 Therefore, given the large Sr excess found in this study, one can assume that the Sr excess is largely accommodated by the formation of RP phases or SrO island precipitates together with some amount of the RP phases.
Furthermore, Sr, large in diameter, is normally surrounded by twelve oxygen atoms in the cubic perovskite lattice, i.e., radius of 0.144 nm (Sr2+ for coordination number of 12) and 0.140 nm (O2− for coordination number of 6),40 and is therefore under high compressive stress. This lattice strain was thought to be the main source for chemical instability of the Sr containing perovskites. For example, the chemical compatibility of these perovskite oxides with YSZ could be significantly enhanced by adding a smaller size A-site cation such as La, or intentionally preparing the oxide with Sr deficiency.41 Similar observation regarding the enhanced chemical compatibility with YSZ has also been reported even in the STF system with Sr0.9Ti0.6Fe0.4O3-δ, Sr0.97Ti0.6Fe0.4O3-δ, and La0.4Sr0.5Ti0.6Fe0.4O3-δ.42
Therefore, kinetic demixing, driven by mechanical strain gradients, may be considered as a relevant driving force for surface SrO segregation. In fact, since the lattice constant of STF decreases with increasing Fe,43 more Fe is expected to create a higher degree of compressive strain on Sr atoms. Therefore, it may explain why higher Fe content in STF results in more Sr segregation. This concept is also supported by the fact that the 3% Sr deficient STF sample demonstrated a significantly reduced degree of Sr segregation in this work (see Fig. 5). Upon post annealing, no additional segregation was found on the Sr deficient STF film, indicating that the strain effect might be a thermodynamic driving force. However, with the limited number of experimental results obtained in this study, it is not possible to make a firm conclusion about the very nature of the Sr excess at the surface of the STF film, and further investigation will be required.
4.2. Role of Sr segregation on the rate of surface oxygen exchange
Surface segregation by A-site cations in perovskite materials has been frequently reported. This has included the SOFC cathode materials such as (La,Sr)MnO3 (LSM),10,31,44,45 although the exact role of surface segregation on cathodic performance has not been fully understood. Surface exchange kinetics of LSM films have been reported to be depressed by Sr segregation due to the insulating nature of the SrO species.44 On the other hand, the addition of SrO to the surface of undoped and lightly-Fe-doped SrTiO3 have been reported to enhance the surface exchange reaction.46 Recently, a small amount of secondary phase on La0.8Sr0.2CoO3 (LSC) surface has been reported to either significantly activate or passivate the exchange rate.47 In this study, the EIS data, under circumstances where a few top atomic layers were removed by chemical etching with dilute HF solution, reveal that the SrO segregated layer has a negative impact on the oxygen exchange rate. Nearly an order of magnitude decrease in RSTF was obtained by etching the surface of STF100, indicating that SrO excess acts as a passivation barrier for the surface oxygen exchange reaction. These findings would be consistent with the poor conducting properties of SrO, a wide bandgap insulator with Eg of ∼ 6 eV. The RP phases (SrO rich), on the other hand are generally not highly insulating.48–50 For example, σel of 9.1 S cm−1 and σion of 5.8 × 10⁻³ S cm−1 are reported for Sr3Fe2O6+δ, compared to 56.5 S cm−1 and 0.5 S cm−1, respectively for its counterpart SrFeO3-δ at 800 °C in air.50 This does not, however, take into account potential barriers which may result from space charge fields generated between the perovskite STF and the additional surface RP phase layers.Since chemical etching also induces changes in the surface morphology of the STF films, i.e. active surface area (see Fig. 1), one should also consider the potential impact of this on the impedance measurements, in addition to the removal of the SrO-rich phase. Based on an AFM analysis, the change in total surface area by etching and post-annealing was found to be only ∼3% (see Table 1). Furthermore, RSTF remained nearly constant upon repeated etching, as well as multiple heating and cooling cycles as long as the maximum temperature was maintained at < 560 °C, suggesting as well, that negligible re-segregation occurred during these subsequent thermal cycles. However, RSTF did increase, following post-annealing at higher temperature (650 °C) for five hours, approaching the original non-etched value (see Fig. 7b). Therefore, one can conclude that RSTF change can be largely attributed to surface segregation with the “SrO” excess layer serving as a barrier for oxygen exchange.
Previously, these authors revealed a strong correlation between the position of the Fermi energy relative to the conduction band edge and the activation energy exhibited by the surface oxygen exchange rate constant in STF thin film electrodes, confirming experimentally, for the first time, the key role that the minority electronic species play in determining the overall reaction kinetics.14 Accordingly, the change in RSTF should be understood in the context of the electron charge transfer efficency from the STF oxide to the adsorbed oxygen species at the surface. Noting further that the activation energy for RSTF remains nearly unchanged, within ± 0.3 eV, upon chemical etching, one can assume two possible situations regarding the role of Sr excess at the surface, as shown in Fig. 8. (1) The “SrO” layer covers nearly the entire STF cathode surface uniformly, leaving only microscopic or nanoscopic porosity enabling oxygen to exchange between the gas phase and the STF electrode, albeit at a markedly decreased effective surface area. Inhomogeneous coverage could result from differences in segregation at grains with differing crystallographic orientation or preferential segregation at grain boundaries. (2) Electron charge transfer takes place through a pin-hole free “SrO” layer by a predominantly non thermally activated tunneling process.
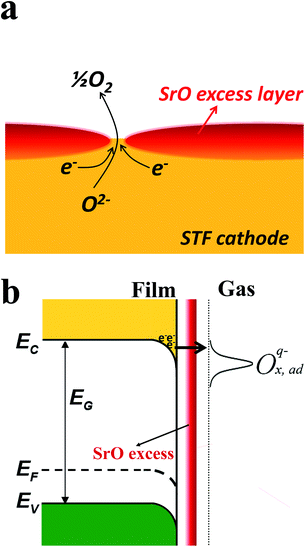 | ||
| Fig. 8 Possible “SrO” passivation mechanisms. (a) “SrO” rich layer acting as blocking barrier to oxygen molecules accessing the active STF surface except via pinholes in the SrO layer. (b) Thin, dense “SrO” rich layer limiting electron transfer to “tunneling” from active STF surface to adsorbed oxygen. | ||
The surface exchange rate was found to be only weakly dependent on Fe fraction in STF, e.g. within a factor of 2, in going from STF35 and STF100.14 This is the case in spite of the fact that STF100 has 100, 20, and 200 times higher σel, σion, minority carrier density (n), respectively, compared with STF35. This relative insensitivity of the surface exchange rate to the Fe fraction may be attributed to the passivation effect of the “SrO” layer. As demonstrated above, the degree of Sr segregation increases with increasing Fe fraction (see Fig. 2a) which would be consistent with either of the two models suggested above for contributing to the reduction in oxygen exchange rate relative to what one could expect, i.e.reduction in porosity or increase in layer thickness. As noted above, both models are consistent with the observation that the “SrO” excess layer has little influence on the activation energy of the surface exchange reaction.
The fact that the segregated “SrO” layer depresses the oxygen exchange rate, suggests that SOFC performance could be improved by removing surface passivation layers or selecting electrode compositions not susceptible to Sr segregation. Controlling the surface chemistry may not be easy, considering the high operating temperatures of conventional SOFC systems and the resultant potential for thermal re-segregation of the passivation layer. However, when it comes to reduced operating temperature SOFCs, such as a micro-SOFC (μSOFC), chemical or mechanical treatments can be expected to enhance cathode performance by kinetically freezing in the modified surface chemistry at reduced temperatures. Furthermore, as demonstrated in this work, Sr segregation can also be controlled by control of the Sr to B site ratio. Therefore, enhancements in k may be possible by carefully controlling etching conditions and/or electrode chemistry.
5. Conclusions
The surface chemical composition of dense thin film SrTi1−xFexO3-δelectrodes, with considerably simplified electrode geometry, was investigated by means of XPS, focusing on surface cation segregation. An appreciable degree of Sr-excess was found at the surface of STF specimens over the wide composition range studied. Films with higher Fe fraction, x, were observed to exhibit considerably stronger Sr segregation. Depth and take-off angle dependent XPS spectra, in combination with chemical and thermal treatments, suggested that the Sr-excess is largely accommodated by the formation of RP phases or SrO island precipitates, possibly driven by mechanical strain gradients.Furthermore, the degree of surface segregation was successfully controlled by etching the films, and/or preparing intentionally Sr deficient films. Studies of EIS measurements, under circumstances where surface chemistry was controlled, revealed the blocking effect of the segregation on the surface oxygen exchange rate. The insensitivity of the activation energy associated with the area specific resistance as measured by the electrode impedance RSTF points to one of two possible compatible models. Either the passivation layer exhibits some porosity or pin-holes enabling oxygen to reach the STF surface unhindered albeit at a considerably reduced active area or that the passivation layer is fully dense but electrons can tunnel from the STF electrode through the layer to the adsorbed oxygen. Further work, including scanning tunneling microscopy, is being initiated by the authors to address this interesting question.51
Acknowledgements
This work was initially supported by the Ceramics Program, Division of Materials Research Directorate for Mathematical & Physical Sciences, National Science Foundation under award DMR-0243993 and continued under the Materials Science and Engineering Division, Office of Basic Energy Sciences, Department of Energy under award DE SC0002633. W.J. Thanks the Samsung Foundation for fellowship support. The authors thank Dr R.A. De Souza and Dr J. Fleig for helpful discussions. The X-ray, XPS and AFM facilities of the Center for Materials Science and Engineering, an NSF MRSEC funded facility were used in this study.Notes and references
- N. Q. Minh, J. Am. Ceram. Soc., 1993, 76, 563–588 CrossRef CAS
.
- S. M. Haile, Acta Mater., 2003, 51, 5981–6000 CrossRef CAS
.
- R. M. Ormerod, Chem. Soc. Rev., 2003, 32, 17–28 RSC
.
- S. B. Adler, Chem. Rev., 2004, 104, 4791–4843 CrossRef CAS
.
- D. J. L. Brett, A. Atkinson, N. P. Brandon and S. J. Skinner, Chem. Soc. Rev., 2008, 37, 1568–1578 RSC
.
- A. J. Jacobson, Chem. Mater., 2010, 22, 660–674 CrossRef CAS
.
- J. Richter, P. Holtappels, T. Graule, T. Nakamura and L. J. Gauckler, Monatsh. Chem., 2009, 140, 985–999 CrossRef CAS
.
- J. Fleig, F. S. Baumann, V. Brichzin, H. R. Kim, J. Jamnik, G. Cristiani, H. U. Habermeier and J. Maier, Fuel Cells, 2006, 6, 284–292 CrossRef CAS
.
- M. Mogensen, K. V. Jensen, M. J. Jørgensen and S. Primdahl, Solid State Ionics, 2002, 150, 123–129 CrossRef CAS
.
- N. Caillol, M. Pijolat and E. Siebert, Appl. Surf. Sci., 2007, 253, 4641–4648 CrossRef CAS
.
- J. Jamnik and J. Maier, Phys. Chem. Chem. Phys., 2001, 3, 1668–1678 RSC
.
- W. Jung and H. L. Tuller, J. Electrochem. Soc., 2008, 155, B1194–B1201 CrossRef CAS
.
- W. Jung and H. L. Tuller, Solid State Ionics, 2009, 180, 843–847 CrossRef CAS
.
- W. Jung and H. L. Tuller, Adv. Energy Mater., 2011 DOI:10.1002/aenm.201100164
.
- P. V. Nagarkar, P. C. Searson and F. D. Gealy Iii, J. Appl. Phys., 1991, 69, 459–462 CrossRef CAS
.
- NIST. Data. Gateway, NIST.
- W. D. Yang, J. Mater. Sci., 1999, 34, 3533–3544 CrossRef CAS
.
- S. Azad, M. H. Engelhard and L.-Q. Wang, J. Phys. Chem. B, 2005, 109, 10327–10331 CrossRef CAS
.
- F. Voigts, C. Argirusis and W. Maus-Friedrichs, Surf. Interface Anal., 2011 DOI:10.1002/sia.3802
.
- F. Voigts, C. Argirusis and W. Maus-Friedrichs, Surf. Interface Anal., 2011, 43, 984–992 CrossRef CAS
.
- E. Heifets, S. Piskunov, E. A. Kotomin, Y. F. Zhukovskii and D. E. Ellis, Phys. Rev. B, 2007, 75, 13 Search PubMed
.
- T. Kubo and H. Nozoye, Surf. Sci., 2003, 542, 177–191 CrossRef CAS
.
- H. Wei, L. Beuermann, J. Helmbold, G. Borchardt, V. Kempter, G. Lilienkamp and W. Maus-Friedrichs, J. Eur. Ceram. Soc., 2001, 21, 1677–1680 CrossRef CAS
.
- N. G. Eror and U. Balachandran, J. Solid State Chem., 1982, 42, 227–241 CrossRef CAS
.
- S. N. Ruddlesden and P. Popper, Acta Crystallogr., 1958, 11, 54–55 CrossRef CAS
.
- S. Sturm, M. Shiojiri and M. Ceh, J. Mater. Res., 2011, 24, 2596–2604 CrossRef
.
- K. R. Udayakumar and A. N. Cormack, J. Phys. Chem. Solids, 1989, 50, 55–60 CrossRef CAS
.
- K. Szot and W. Speier, Phys. Rev. B: Condens. Matter, 1999, 60, 5909 CrossRef CAS
.
- K. Szot, W. Speier, J. Herion and C. Freiburg, Appl. Phys. A: Mater. Sci. Process., 1996, 64, 55–59 CrossRef
.
- S. Witek, D. M. Smyth and H. Pickup, J. Am. Ceram. Soc., 1984, 67, 372–375 CrossRef CAS
.
- H. Dulli, P. A. Dowben, S. H. Liou and E. W. Plummer, Phys. Rev. B: Condens. Matter, 2000, 62, R14629 CrossRef CAS
.
- Y. Liang and D. A. Bonnell, Surf. Sci., 1994, 310, 128–134 CrossRef CAS
.
- K. Hawkins and T. J. White, Philos. Trans. R. Soc. London, Ser. A, 1991, 336, 541–569 CrossRef CAS
.
- R. Courths, J. Noffke, H. Wern and R. Heise, Phys. Rev. B: Condens. Matter, 1990, 42, 9127 CrossRef CAS
.
- G. Horvath, J. Gerblinger, H. Meixner and J. Giber, Sens. Actuators, B, 1996, 32, 93–99 CrossRef
.
- R. Christian and C. J. William, J. Am. Ceram. Soc., 1995, 78, 2593–2602 CrossRef
.
- D. Monceau, C. Petot and G. Petot-Ervas, Solid State Ionics, 1991, 45, 231–237 CrossRef CAS
.
- R. Wang, Y. Zhu and S. M. Shapiro, Phys. Rev. Lett., 1998, 80, 2370 CrossRef CAS
.
- C. Reinke and W. C. Johnson, J. Am. Ceram. Soc., 1995, 78, 2593–2602 CrossRef CAS
.
- R. D. Shannon, Acta Crystallogr., Sect. A: Cryst. Phys., Diffr., Theor. Gen. Crystallogr., 1976, 32, 751 CrossRef
.
- H. Yokokawa, N. Sakai, T. Kawada and M. Dokiya, Solid State Ionics, 1992, 52, 43–56 CrossRef CAS
.
- D. P. Fagg, V. V. Kharton, A. V. Kovalevsky, A. P. Viskup, E. N. Naumovich and J. R. Frade, J. Eur. Ceram. Soc., 2001, 21, 1831–1835 CrossRef CAS
.
- M. Vracar, A. Kuzmin, R. Merkle, J. Purans, E. A. Kotomin, J. Maier and O. Mathon, Phys. Rev. B, 2007, 76 Search PubMed
.
- S. P. Jiang and J. G. Love, Solid State Ionics, 2001, 138, 183–190 CrossRef CAS
.
- G. J. la O', R. F. Savinell and Y. Shao-Horn, J. Electrochem. Soc., 2009, 156, B771–B781 CrossRef CAS
.
-
S. F. Wagner, C. Warnke, W. Menesklou, C. Argirusis, T. Damjanovic, G. Borchardt and E. Ivers-Tifee, 15th International Conference on Solid State Ionics, Baden Baden, Germany, 2006 Search PubMed
.
- E. Mutoro, E. J. Crumlin, M. D. Biegalski, H. M. Christen and Y. Shao-Horn, Energy Environ. Sci., 2011, 4, 3689–3696 CAS
.
- C. A. J. Fisher and M. S. Islam, J. Mater. Chem., 2005, 15, 3200–3207 RSC
.
- C. Navas, H. L. Tuller and H.-C. z. Loye, J. Eur. Ceram. Soc., 1999, 19, 737–740 CrossRef CAS
.
- Y. A. Shilova, M. V. Patrakeev, E. B. Mitberg, I. A. Leonidov, V. L. Kozhevnikov and K. R. Poeppelmeier, J. Solid State Chem., 2002, 168, 275–283 CrossRef CAS
.
- Y. Chan, W. Jung, Y. Kuru, H. L. Tuller and B. Yildiz, ECS Trans., 2011, 35, 2409–16 CrossRef
.
Footnote |
| † Current address: Applied Physics and Materials Sciences, California Institute of Technology, Pasadena, CA 91125, USA. |
| This journal is © The Royal Society of Chemistry 2012 |
