XRF-XANES characterization of deep ice core insoluble dust
Augusto
Marcelli
*a,
Dariush
Hampai
*a,
Francesca
Giannone
b,
Marco
Sala
c,
Valter
Maggi
de,
Federica
Marino
d,
Stefano
Pignotti
f and
Giannantonio
Cibin
g
aINFN—Laboratori Nazionali di Frascati, Via E. Fermi 40, I-00044, Frascati, Italy. E-mail: marcelli@lnf.infn.it; dariush.hampai@lnf.infn.it
bDITS, Università di Roma “Sapienza”, Via Eudossiana 18, I-00184, Roma, Italy
cEarth Science Department, Università di Milano, I-20126, Milano, Italy
dDISAT, University of Milano Bicocca, I-20126, Milan, Italy
eINFN Milano-Bicocca, Piazza della Scienza, 3, I-20126, Milan, Italy
fEnte Italiano della Montagna, Piazza dei Caprettari 70, I-00186, Roma, Italy
gDiamond Light Source, Chilton, Didcot, Oxon OX110DE, UK
First published on 28th October 2011
Abstract
An analytical protocol based on X-ray spectroscopic measurements (XRF and Fe and Ti K-edges XAS) has been applied to evaluate the mineralogical phase composition of dust trapped in deep ice cores. Information on the insoluble dust composition and local and species-selective information as oxidation and coordination states has been obtained to recognize the main mineralogical families of aerosol particles contained in deep ice cores. In this framework we point out the possibility to obtain the mineralogical characterization of dust from deep ice core samples from Antarctica by means of XANES spectroscopy.
1 Introduction
Precise information on ancient variations of Earth's climate can be extracted from deep ice cores. Like marine sediment cores, a vertical timeline of past climate is stored in ice sheets and mountain glaciers. While ocean sediment cores provide records dating back several million years, deep ice cores cover relatively shorter periods, with a high temporal resolution. The longest chronological record from ice cores comes from the EPICA perforation in Antarctica, covering the last 820 ka.1,2 Ice cores can provide information about temperature, precipitation levels, atmospheric composition and volcanic activity. Aeolian mineral dust archived in polar and mid-latitude ice cores represents in particular a precious proxy for assessing environmental and atmospheric circulation variability, with special emphasis to the regional-to-global climate change at different time scales. Results from drilling sites around the world help distinguish local climate (i.e., European Alps, Andes, and Himalayas) from global climate trends (i.e., Antarctica and Greenland). Recognizing the origin of the mineral dust, comparing dust measurements on ice core and possible dust source areas sediments, permit us to evaluate variations of past atmospheric transport to the glaciers. Shifts in the patterns of atmospheric circulation could explain the high variability and magnitude of large, rapid, regional-to-global climate oscillations through most of the last thousands of years.In this contribution we present a mineralogical analysis of low concentration insoluble aeolian dust depositions. The main challenge of this research is represented by the small (<5 μg) or extremely small (<1 μg) amount of materials available in crystalline form. Moreover, the ice core insoluble fraction contains small crystallites that are also poorly crystalline and include often glass and tephra contributions from volcanic events. This makes XRD analysis difficult to be performed. Synchrotron radiation spectroscopic techniques as Total-Reflection X-Ray Fluorescence (TXRF) and X-ray Absorption Near Edge Structure (XANES) analyses should then support the mineralogical analysis of such challenging samples. XANES in particular can complement XRD information, by offering a clear element-specific insight into the local structure of specific fractions of the analyte. The goal of this research is to combine information about the elemental composition coming from XRF analysis and the mineralogical information coming from the iron local structure identified using XANES to support data obtained by conventional techniques such as X-ray diffraction, transmission electron microscopy, etc. A partial characterization of the chemical composition of micro-sized particles has been performed also by Particle Induced X-ray Emission (PIXE) and Particle Induced Gamma-ray Emission (PIGE)3,4 although a detailed crystal chemistry analysis is lacking.
2 Experimental setup
For this experiment we designed and assembled a dedicated experimental set-up installed at SPEAR3 on the beamline 10-2 of the Stanford Synchrotron Radiation Lightsource (SSRL) facility. Both TXRF and XANES experiments were performed in a high vacuum (HV) chamber designed to satisfy grazing incidence experimental requirements, i.e., with a remotely controlled HV manipulator5 having six degrees of freedom and large travel ranges with <1 μm and 50 μrad of translational and angular accuracy, respectively. Detection has been performed with a Ketek Silicon Drift Detector (SDD)5 with a 7 mm2 area and a resolution <149 eV at 5.9 keV for a count rate <10 kcps with a shaping time of 1 μs. Preliminary works showed that dust is qualitatively composed by a mixture of silicates: clays, quartz, and feldspars, with minor contributions of pyroxenes, amphiboles, metal oxides, and volcanic glasses.6 In addition, the continental origin is underlined by the elemental composition characterized by Si, Al, Fe, Ca, Na, Mg, K, and Ti. To achieve a mineralogical characterization of airborne particles we combined on the same sample fraction two methods: XRF elemental composition characterization and XANES spectroscopy. The extremely low amount of dust concentration (ppb range) required the setup of clean procedures to collect, prepare and preserve the samples for the experiments. The method was characterized by X-ray diffraction (XRD)7 and combined with single-particle high-resolution transmission electron microscopy (HR-TEM) analyses of the airborne mineral phases and some PIXE-PIGE experiments.3,4 To compare X-ray absorption and PIXE data we deposited mineral dust on a Nuclepore polycarbonate membrane with 0.45 μm pore size.8 The comparison points out the TXRF advantage in the low energy region because of the absence of the broad PIXE Brehmsstrahlung background. Because during the preparation samples are divided into two equal aliquots, dusts were also evaporated on high purity Si wafer substrates.8 The amount of firn used for the preparation of the samples has been adjusted to give for all samples a total amount of material deposited in the range of 1–10 μg.Tests on samples prepared with this method have been also performed at the beamline B18 at the Diamond Light Source.9 B18 is a new general purpose XAS beamline competitive in terms of flux and flux density over a large energy range. Detection has been performed with a four element Vortex Silicon Drift Detector from SII, highly efficient also in the low energy range. Experiments have been performed at the Fe K edge and at lower energies down to the Ti K edge.
3 Results
To characterize the aerosol and modelling sources and transport mechanisms we started from the evaluation of the nine major elements' concentrations: SiO2, Al2O3, Fe2O3, CaO, Na2O, MgO, K2O, TiO2 and MnO and from the calculation of the Chemical Index of Alteration (CIA). The CIA index is calculated as the ratio| [Al2O3/(Al2O3 + CaO* + K2O) × 100] | (1) |
At the beamline 10-2 at SSRL the energy of the Na fluorescence peak (∼1041 eV) is at the limit of the acquisition electronics and the concentration of Na2O was set constant to the crustal average value of 2%. Moreover, the TXRF evaluation of the Si concentration is critical and the subtraction of the Si substrate contribution is mandatory, it being a critical issue strongly dependent on the grazing angle. Data of silicon have been validated by comparison with Si and Fe relative intensities of TXRF and XRF experiments on Nuclepore membranes so that with our experimental protocol we can recognize iron inclusion mineral fractions on insoluble dust in the 0.4–5 μg range.
Data obtained by TXRF experiments of both Antarctic and Alpine samples are shown in Fig. 1 and are compared to the corresponding values of reference rock compositions and mineral sources from Southern South America (SSA), i.e., Argentinean Loess,13 Patagonian sediments14,15 and Australian sediments.3 Moreover, a group of eight samples from Colle del Lys (Italian Alps) was considered to evaluate the resolution of the method considering a different source and different atmospheric conditions. In Fig. 1 the Alpine samples (blue circles) clearly identify a close group separated from the other datasets.16
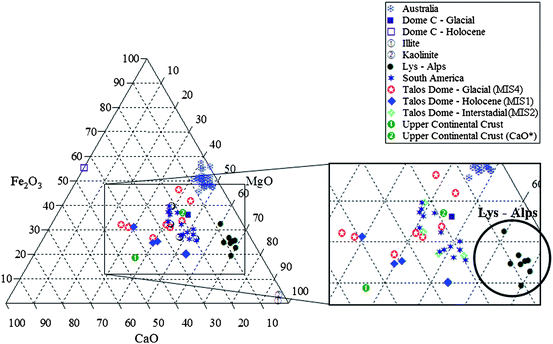 | ||
| Fig. 1 (CaO*%)–(MgO%)–(Fe2O3%) ternary diagram of Talos Dome—Holocene (MIS1), Interstadial (MIS3) and Glacial (MIS4)- and Lys–Alps-ice dusts compared to Dome C compositions3 and to reference rock compositions: Upper Continental Crust,3 South America13–15 and Australian fine sediments.3 Data are expressed in mol/mol%. On the rectangle on the right a zoom of the ternary diagram shows the Colle del Lys data in the circle. | ||
Fig. 2 shows the Fe2O3 concentration vs. the ice core depth for samples collected in the Antarctic site.17 It represents a partial time evolution of the iron oxide contained in mineral dusts, from Holocene to one of the Marine isotope stages (MIS) period: MIS4, and point out the minimum typically observed in the interglacial periods.3,4,7 Due to the lack of MIS2 data, at present we are not able to evaluate the change in dust concentration during the last glacial maximum (LGM). In contrast, the decrease of Fe2O3 concentration between 500 and 700 m depth is correlated with the decrease of the total dust concentration for the same samples, as well as for the increase of the Fe2O3 concentration from 1000 to 1300 m depth, with significant higher values in the immediate aftermath of a volcanic event. A more detailed analysis of the MIS2 period should allow an accurate description of the evolution of the iron oxide concentrations being also an additional test for a precise recognition of source area provenance.
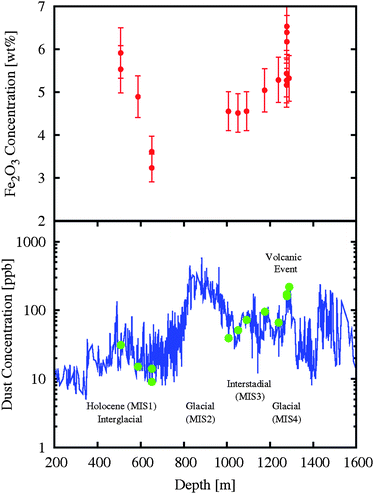 | ||
| Fig. 2 (Top panel) The Fe2O3 concentration as a function of the ice core depth (i.e., vs. time) with a clear minimum in the glacial period. (Bottom panel) Dust concentration (ppb) vs. depth of the TALOS Dome ice core. A correlation is evident between the possible volcanic event and the peak of the Fe2O3 content. | ||
Characteristic Fe K edge XANES spectra of Antarctic samples are shown in Fig. 3 (top panel). They are characterized by a very small pre-peak signal, followed by a single broad main peak at 7135 eV, a shoulder at 7150 eV followed by a deep minimum at 7160 eV and a broad oscillation maximum in the region 7180–7200 eV. The spectral shape is compatible with that exhibited by a clay mineral such as many phyllosilicates where iron is octahedrally coordinated with variable oxidation states and different intermediate coordinations.8 The experimental resolution points out a clear edge shift that can be correlated with the different amounts of Fe3+vs. time (see the bottom panel of Fig. 3). In particular, Fe3+ concentration is higher in the glacial period than in the Holocene, while the samples associated with a volcanic event, despite lying in the MIS4 period, have a spectrum compatible with the highest Fe2+ concentration. The energy and intensity of the data are compatible with Fe in octahedral coordination, or with a combination of octahedral and tetrahedral iron coordination whose lower coordinated component is less than 10%. Indeed, the tetrahedral coordination of Fe with oxygen has a different characteristic spectral signature as it appears in the tetra-ferriphlogopite spectrum.18
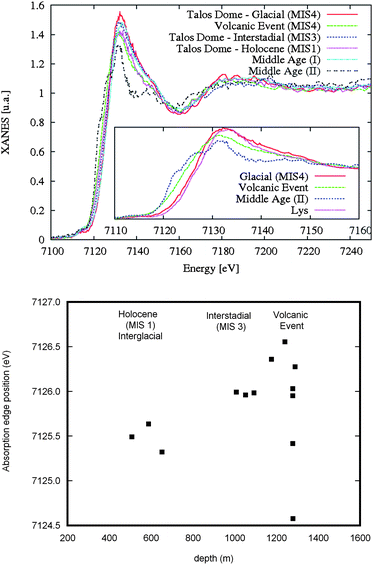 | ||
| Fig. 3 (Top) Comparison of Fe K-edge XANES spectra among samples belonging to the three different periods: MIS1, MIS3, MIS4, the volcanic event and firn cores (Middle Age—I and II—about 250 years ago). In the inset the magnified view of the edge region for Antarctic Glacial (MIS4), volcanic event and Middle Age II and Alpine Lys samples.8 The spectrum of the Middle Age II sample is significantly different and the shift of the edge to low energy points out a not negligible amount of Fe2+. (Bottom) Fe K edge shift measured in the different samples. The behaviour could be correlated with the different amounts of Fe3+ in the dust vs. time. | ||
Fe K edge XANES spectra present also anomalies in certain dust compositions, as demonstrated by the comparison of Antarctic (TDC) and Alpine samples.8 In the inset of Fig. 3 the spectrum of the Lys sample is similar to Antarctic samples (TD05) characterized by the typical octahedral iron coordination of phyllosilicates with Fe3+ and a dioctahedral sheet arrangement. In contrast, one sample (Middle Age II) from Antarctica exhibits a really different behaviour: at the rising edge two well defined components at 7122.6 and 7126.6 eV appear with a well separated single main peak at 7131.4 eV, followed by a shallow minimum and an oscillation rising well before the spectra previously analyzed. The edge position is a characteristic of octahedral coordinated Fe2+ while the other edge structures are compatible with minerals of the phyllosilicate group such as phlogopite, with a low Fe concentration in an octahedral sheet surrounded by a regular arrangement of Mg octahedra. Comparison with spectra of minerals with a higher octahedral Fe2+ concentration suggests that the Fe local structure of this dust is characterized by a strong structural order in the intermediate range.19 For sake of clarity in the left panel in Fig. 4 we report spectra of several iron mineralogical standards that can be used to characterize the detected dust samples.
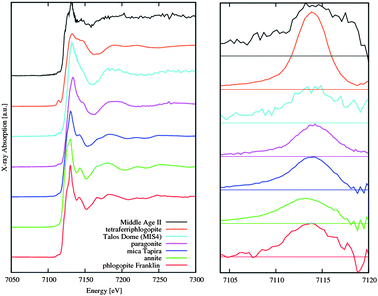 | ||
| Fig. 4 (Left panel) Comparison of Fe K-edge XANES spectra among a representative sample collected in Antarctica and one from Alps (Lys) and Fe K edge spectra collected in several reference mica minerals. (Right panel) Comparison of pre-edge features of the left panel spectra. | ||
Although data of the dust were collected with a limited energy resolution, to emphasize differences or similarities among these samples, an analysis of the pre-edge region has been performed. In the right panel of Fig. 4 we compare the pre-edge structure obtained by subtracting to the experimental data the rising of a Lorentzian curve obtained by fitting the experimental data just before (i.e., −100 eV relative to the edge) and above the pre-edge features up to the energy for which we measure 70% of the intensity of the white line. In the fit we excluded the region between 7100 and 7120 eV that contains the pre-edge features. A clear difference between the dust samples is evident also in the pre-edge region while a relative similarity occurs among the structure of the Talos Dome sample and micas.
Although still limited in terms of absorption edges and the number of samples measured, we may claim that by collecting XANES spectra from different edges it is possible to improve the mineralogical characterization of dust contained in an ice core. Indeed, in addition to iron selecting a second element, e.g., Ti, it is possible to characterize the local structure in a different site of the mineral structure. Different types of minerals are characterized by different ratios among the main elemental components. Combining XANES information with XRF data that offer the possibility to obtain an accurate elemental ratio, a better recognition of minerals present in the dust may certainly occur.
Changes in the ratio of Fe/Si, Ti/Si and Ti/Fe may also point out the change of the mineral concentration present in the dust during cold periods. In addition, the Fe/Ti ratio may also discriminate between continental and oceanic materials.20 This contribution visible only in the fraction of ice dissolved and unfiltered has been already considered and correlated with the soluble Fe.21 Actually, regarding this specific case, because one of the Antarctica drilling sites is considered a pretty coastal site, we may assume that it is not completely sheltered from oceanic contributions and it cannot be then exploited for this analysis. For sake of clarity, we have also to underline that in our preparation procedure the soluble components are lost and the material under investigation contains only the insoluble fraction. Still the analysis of the Ti/Fe ratio and a XANES analysis are a feasible project as the spectra shown in Fig. 5 clearly demonstrate.
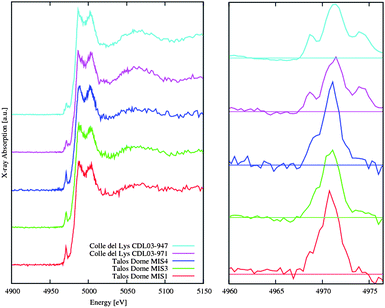 | ||
| Fig. 5 Comparison of Ti K-edge XANES spectra among samples belonging to the different glacial periods collected in Antarctica and in Alps (Lys). Spectra show significant differences in the XANES region (left panel) and in the pre-edge region (right panel). | ||
Comparisons of Ti K-edge XANES spectra in Fig. 5 refer to samples collected in Antarctica belonging to the different glacial periods and in the Alps (Lys). They show significant differences in the XANES region (left panel) and in particular in the pre-edge region (right panel). As for the spectra in Fig. 4, pre-edge structures shown in the right panel of Fig. 5 have been obtained by subtracting to the experimental data, the rising of a Lorentzian curve obtained by fitting the experimental data just before (i.e., −100 eV relative to the edge) and above the pre-edge features up to the energy for which we measure 70% of the intensity of the white line. In this case we excluded in the fit the region between 4965 and 4980 eV. Looking at the curves, discrimination is possible using reference XANES spectra22 and also quantification of differences is possible by an accurate pre-edge analysis as it was already showed at the Ti K edge in Ti–Si binary oxides.23 Although noisy, because of the limited amount of materials contained in the dust, with powerful synchrotron radiation sources reliable data at the Ti K edge can be collected in these samples. Using the bending magnet (BM18) at Diamond spectra can be collected within about 80–90 minutes. Better statistics and improvements are certainly possible in the near future with better samples and optimized detector geometry.
4 Conclusions
TXRF and XAS experiments performed on samples containing mineral particles extracted from deep ice cores allow us to gather unique complementary information on the archived Aeolian mineral dust. The combination of experimental techniques on the same sample fractions is mandatory to reconstruct the extremely variable composition of these challenging samples. Regarding the samples analyzed, XANES spectra point out the presence of clay minerals with a prevalence of Fe3+ in octahedral coordination. The technique identifies large spectral differences in Antarctic samples that we associate with relatively small variations of the local Fe crystalline environment present in the insoluble dust. As a consequence, from XANES spectra the characterization and modelling of dust sources and aerosol transport mechanism appear possible. Actually, although limited in terms of samples analyzed, this research demonstrates for the first time that local and species-selective information such as oxidation and coordination states as given by XANES may identify the mineralogical family of aerosol particles. Moreover, as the analysis at the Ti K edge points out, the analysis at different edges and the determination of relevant ratios among main elements may certainly improve the mineralogical characterization of the dust source areas and possible paleoclimatic evolutions associated with dust depositions. To conclude, if an extensive sampling followed by accurate XANES spectroscopic analysis is performed and data are correlated with the CIA analysis, the dust source area assessment is now feasible using the available X-ray synchrotron radiation sources.This research was carried out in the framework of Proposals 90U5 and 3082M at SSRL, a national user facility operated by Stanford University on behalf of the U.S. Department of Energy, Office of Basic Energy Sciences. We would like to thank the DAΦNE-L technical staff and the entire staff of the SSRL facility for their invaluable technical support and hospitality. Measurements at Diamond have been performed in the framework of the proposal NT1984. We express sincere thanks also to A. Mottana for many precious discussions. This work was partly supported by MNA (Museo Nazionale dell'Antartide), EIM (Ente Italiano della Montagna) and carried out in the framework of the Project on Glaciology of the Programma Nazionale di Ricerche in Antartide (PNRA)-MIUR financially supported through the collaboration with ENEA Roma.
Notes and references
- J. Jouzel, et al. , Science, 2007, 317(5839), 793–797 CrossRef CAS.
- F. Lambert, et al. , Nature, 2008, 452(7187), 616–619 CrossRef CAS.
- F. Marino, et al. , Geochem., Geophys., Geosyst., 2008, 9(10) Search PubMed.
- F. Marino, et al. , Nucl. Instrum. Methods Phys. Res., Sect. B, 2008, 266, 2396–2400 CrossRef CAS.
- A. Marcelli, et al. , Vacuum Int., 2007, 2, 52–58 Search PubMed.
- A. Gaudichet, et al. , J. Atmos. Chem., 1992, 14(1–4), 129–142 CrossRef CAS.
- M. Sala, PhD thesis, Università degli Studi di Milano, 2008.
- G. Cibin, et al. , Spectrochim. Acta, Part B, 2008, 63, 1503–1510.
- A. J. Dent, G. Cibin, S. Ramos, A. D. Smith, S. M. Scott, L. Varandas, M. R. Pearson, N. A. Krumpa, C. P. Jones and P. E. Robbins, J. Phys.: Conf. Ser., 2009, 190, 012039 CrossRef.
- S. Gallet, et al. , Earth Planet. Sci. Lett., 1998, 156, 157–172 CrossRef CAS.
- H. W. Nesbitt and G. M. Young, Nature, 1982, 299, 715–717 CrossRef CAS.
- R. V. Dingle and M. Lavelle, Palaeogeogr., Palaeoclimatol., Palaeoecol,, 1998, 141, 215–232 CrossRef.
- P. L. Smedley, et al. , Appl. Geochem., 2005, 20, 989–1016 CrossRef CAS.
- D. M. Gaiero, Geophys. Res. Lett., 2007, 34, L17707 CrossRef.
- D. M. Gaiero, et al. , Chem. Geol., 2007, 238, 107–120 CrossRef CAS.
- Lys glacier 2003 firn core (CDL03, 45°92′N, 7°86′E, 4248 m a.s.l., Lys glacier, Mt. Rosa, Italy).
- Talos Dome firn core (TDC, 159°04′E, 72°46′S, 2316 m a.s.l.) International Trans Antarctic Scientific Expedition (ITASE).
- F. Tombolini, et al. , Eur. J. Mineral., 2002, 14, 1075–1085 CrossRef CAS.
- A. Mottana, EMU Notes in Mineralogy, ed. A. Beran and E. Libowitzky, 2004, vol. 6, pp. 465–522 Search PubMed.
- P. J. Lam, J. K. B. Bishop, C. C. Henning, M. A. Marcus, G. A. Waychunas and I. Y. Fung, Global Biogeochem. Cycles, 2006, 20, GB1006 CrossRef.
- V. Gaspari, et al. , Geophys. Res. Lett., 2006, 33, L03704 CrossRef.
- F. Farges, G. E. Brown, Jr and J. J. Rehr, Phys. Rev. B, 1997, 56, 1809–1819 CrossRef CAS.
- J. S. Lee, W. B. Kim and S. H. Choi, J. Synchrotron Radiat., 2001, 8, 163–167 CrossRef CAS.
| This journal is © The Royal Society of Chemistry 2012 |
