Peroxidase-modified cup-stacked carbon nanofiber networks for electrochemical biosensing with adjustable dynamic range
Seongjae
Ko
,
Yusuke
Takahashi
,
Hirotaka
Fujita
,
Tetsu
Tatsuma
,
Akiyoshi
Sakoda
and
Kikuo
Komori
*
Institute of Industrial Science, University of Tokyo, Komaba, Megro-ku, Tokyo 153-8505, Japan. E-mail: kkomori@iis.u-tokyo.ac.jp; Fax: +81 3 5452 6349
First published on 15th December 2011
Abstract
Cup-stacked carbon nanofibers (CSCNFs) were treated with ozone to introduce oxygen-containing groups to the edges of the graphene cups. The O/C atomic ratio at the surface was estimated to be 5.3 × 10⁻². The hydrophilic CSCNFs were used for constructing a three-dimensional network that works both as an electrical nanowire and an enzyme support. Horseradish peroxidase (HRP) molecules were immobilized onto the network for amperometric sensing of H2O2 and inhibition-based sensing of cyanide. Both the upper sensing limit of H2O2 and the upper and lower sensing limits of cyanide were controlled by about two orders of magnitude by changing the HRP coverage.
Introduction
Carbon nanotubes (CNTs) and carbon nanofibers (CNFs) have attracted significant attention as novel electric nanowires and electrode materials for electrochemical biosensors because of their high electronic conductivity and minuscule size.1–3 They are classified into two groups:4,5 (i) nanotubes, such as single-walled carbon nanotubes (SWCNTs) and multi-walled carbon nanotubes (MWCNTs), and (ii) nanofibers with stacked graphene, such as platelet carbon nanofibers (PCNFs), herringbone carbon nanofibers (HBCNFs), and cup-stacked carbon nanofibers (CSCNFs). In recent years, it has been reported that the graphene edge of CNTs and CNFs plays an important role in fast electron transfer reactions with redox species, especially redox proteins.In relation to this, it is well known that heterogeneous electron transfer reactions at edge-oriented pyrolytic graphite (EOPG) electrodes are generally faster than those at basal plane pyrolytic graphite (BPG) electrodes.6–9 In particular, direct electrochemistry at EOPG of peroxidase,10,11 hemoglobin,12 glucose oxidase,13 and nitrite reductase14 have been studied and applied to electrochemical biosensing. The edges of CNTs also allow fast electron exchange with redox proteins; their active centers are reported to be accessible by CNTs.15–17 However, the walls of CNTs are less active than the edges, similar to BPG.17 Therefore, CNTs must be oriented vertically to expose their edges. On the other hand, CNFs with stacked graphene provide a high density of graphene edges without control of their orientation. Noda et al. have developed hydrogene peroxide sensors based on CSCNF and horseradish peroxidase (HRP).18 However, the nature of the CSCNF used and kinetics of the electrochemical reactions have not yet been studied extensively.
Recently, we have successfully synthesized CSCNF (20 and 30 nm in inner and outer diameters, respectively, and several micrometres in length) using a chemical vapor deposition (CVD) method based on the thermal decomposition of poly(ethylene glycol) (PEG) in the presence of Ni.19 This method requires no explosive or flammable gases and the treatment temperature is 750 °C, whereas conventional catalytic thermal CVD methods require hydrocarbon or hydrogen and thermal treatment at around a 1000 °C.20–22 Here we treated the CSCNF with ozone to introduce oxygen-containing groups to the graphene edges to make the CSCNF water soluble and adsorptive to proteins. Although strong acids, such as nitric acid, are widely used for the surface treatment of CNTs and CNFs,23,24 it takes a long time for the washing and filtration processes to eliminate the acids completely. In comparison, the ozone treatment requires no time-consuming post-treatments. We characterized the CSCNF before and after the treatment in detail. CSCNF provides a three dimensional network to which HRP molecules are adsorbed and through which electrons are transported. The HRP/CSCNF-modified electrodes were examined as H2O2 sensors, and their upper sensing limit was controlled by changing the amount of HRP molecules. Kinetics of HRP oxidation by H2O2 from the Fe(III) to Fe(IV) state and direct electrochemical reduction from Fe(IV) to Fe(III) were studied by amperometry, which is suitable to the sensitive analysis of irreversible reactions. The electrodes were also applied as cyanide sensors based on inhibition of the enzymatic activity. In this case, the dynamic range of the cyanide sensing was controlled by regulating the HRP amount. The three dimensional network allows the control of overall enzymatic activity and regulation of the sensor performances.
Experimental section
Synthesis and characterization of CSCNF
CSCNF was synthesized according to our previous report.19 The aqueous solution containing 7.5 mM NiCl2 and 8 M PEG (monomer unit, Mw = 8 000, Wako Pure Chemicals, Japan) was stirred for 30 min at 60 °C and then coated on a silicon wafer (150 mg cm−2) uniformly. The silicon wafer was placed on a hot plate for 1 h at 60 °C, followed by cooling at room temperature for 2 h, resulting in formation of a composite PEG–Ni membrane on the silicon wafer. The PEG–Ni membrane-coated silicon wafer was placed in a quartz pipe (7.5 cm in diameter and 85 cm in length) and heated to 750 °C in an electric oven at a heating rate of 15 °C min−1 under an argon atmosphere. The temperature was maintained at 400, 500, and 750 °C for 1 h each to obtain CSCNF.About 100 mg of the synthesized CSCNF were placed in a glass tube. Air containing 820 ppm ozone generated by an ozone generator POX-10 (Fuji Electric Co. Ltd., Japan) was flushed into the glass tube at a flow rate of 800 mL min−1 for 2 h at room temperature. The surface functional groups of the ozone-treated CSCNF were analyzed by a temperature programmed desorption (TPD) method. A stainless steel tube filled with 100 mg of the ozone-treated CSCNF was heated from 25 to 900 °C at the heating rate of 5 °C min−1 in an electric oven, where argon gas was continuously run into the tube and amounts of CO and CO2 desorbed from the CSCNF surface were monitored. The surface area of CSCNF was determined by the Brunauer–Emmett–Teller (BET) method based on N2 adsorption25,26 onto the CSCNF surface by use of BELSORP 36 apparatus. Graphite structures of the ozone-treated CSCNF were analyzed by Raman spectroscopy (T-640000, Horiba Jobin Yvon Co. Ltd.).
Preparation of HRP/CSCNF-modified electrodes
Ozone-treated CSCNF and HRP (Sigma-Aldrich) were entrapped in a polyion complex membrane formed from poly(L-lysine) (PLL) (Sigma-Aldrich, Mw = 100![[thin space (1/6-em)]](https://www.rsc.org/images/entities/char_2009.gif) 000) as a polycation and polystyrene sulfonic acid (PSS) (Sigma-Aldrich, Mw = 1
000) as a polycation and polystyrene sulfonic acid (PSS) (Sigma-Aldrich, Mw = 1![[thin space (1/6-em)]](https://www.rsc.org/images/entities/char_2009.gif) 000
000![[thin space (1/6-em)]](https://www.rsc.org/images/entities/char_2009.gif) 000) as a polyanion and directly immobilized on a transparent indium tin oxide (ITO) electrode. Fig. 1 shows a schematic illustration for the entrapment of CSCNF and HRP. An ITO-coated glass plate (area ∼0.09 cm2) was treated with a 1.0 M sodium hydroxide aqueous solution for 24 h to provide a negatively charged surface, followed by further treatment with 50 mM PLL (monomer unit) aqueous solution for 1 h. After each treatment, the electrode was thoroughly rinsed with distilled water. A 6 μL aliquot of 5 mg mL−1 CSCNF aqueous dispersion was cast onto the PLL-coated electrode surface, followed by further casting of a 6 μL aliquot of 5–500 μM HRP aqueous solution after drying for 1 h at room temperature. HRP molecules are adsorbed onto CSCNF likely due to electrostatic interaction and hydrogen bonding. After rinsing with distilled water to remove excess HRP molecules, a 6 μL aliquot of 50 mM PLL (monomer unit) aqueous solution was cast onto the electrode surface, followed by further casting of a 6 μL aliquot of 50 mM PSS (monomer unit) aqueous solution to form a polyion complex layer, which protects HRP from desorption. The obtained HRP/CSCNF electrode was subjected to morphological observation by a field emission scanning electron microscopy (FE-SEM, S–4500, Hitachi High-Technologies Co. Ltd., Japan). Surface coverage of HRP was determined by spectrophotometric measurements (MCPD-3000 and MC2530, Otsuka Electronics Co. Ltd., Japan) with maximum mole extinction coefficient of ε = 102 mM−1 cm−1.27 All other reagents were at least analytical grade and used without further purification.
000) as a polyanion and directly immobilized on a transparent indium tin oxide (ITO) electrode. Fig. 1 shows a schematic illustration for the entrapment of CSCNF and HRP. An ITO-coated glass plate (area ∼0.09 cm2) was treated with a 1.0 M sodium hydroxide aqueous solution for 24 h to provide a negatively charged surface, followed by further treatment with 50 mM PLL (monomer unit) aqueous solution for 1 h. After each treatment, the electrode was thoroughly rinsed with distilled water. A 6 μL aliquot of 5 mg mL−1 CSCNF aqueous dispersion was cast onto the PLL-coated electrode surface, followed by further casting of a 6 μL aliquot of 5–500 μM HRP aqueous solution after drying for 1 h at room temperature. HRP molecules are adsorbed onto CSCNF likely due to electrostatic interaction and hydrogen bonding. After rinsing with distilled water to remove excess HRP molecules, a 6 μL aliquot of 50 mM PLL (monomer unit) aqueous solution was cast onto the electrode surface, followed by further casting of a 6 μL aliquot of 50 mM PSS (monomer unit) aqueous solution to form a polyion complex layer, which protects HRP from desorption. The obtained HRP/CSCNF electrode was subjected to morphological observation by a field emission scanning electron microscopy (FE-SEM, S–4500, Hitachi High-Technologies Co. Ltd., Japan). Surface coverage of HRP was determined by spectrophotometric measurements (MCPD-3000 and MC2530, Otsuka Electronics Co. Ltd., Japan) with maximum mole extinction coefficient of ε = 102 mM−1 cm−1.27 All other reagents were at least analytical grade and used without further purification.
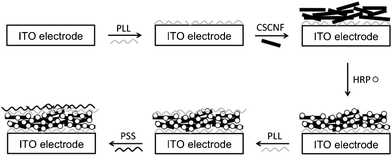 | ||
| Fig. 1 Schematic illustrations of preparation process of the HRP/CSCNF-modified electrode. | ||
Electrochemical measurements
Electrochemical measurements were performed in a 67 mM phosphate buffer solution (pH 6.4) with a batch system. An Ag|AgCl|KCl sat. and a coiled platinum wire were used as the reference and counter electrodes, respectively. The catalytic activity of the HRP/CSCNF-modified electrode toward H2O2 reduction was evaluated by amperometry with a potentiostat LC-4C (BAS). After the working electrode was polarized at +0.150 V, at which H2O2 oxidation and reduction currents were almost negligible at the bare ITO electrode, and a steady-state current was obtained, H2O2 solution was added into the electrolyte solution, and the steady-state current was recorded. Note that in our previous work, we applied the same potential to the HRP-modified graphite electrode.28 An inhibition effect of CN− on the HRP/CSCNF-modified electrode was measured as follows. After the working electrode was polarized at +0.150 V, H2O2 solution was added into the electrolyte solution (final concentration, 1 μM), followed by the addition of NaCN solution. The inhibition ratio of the H2O2 reduction current was recorded.Results and discussion
Characterization of ozone-treated CSCNF
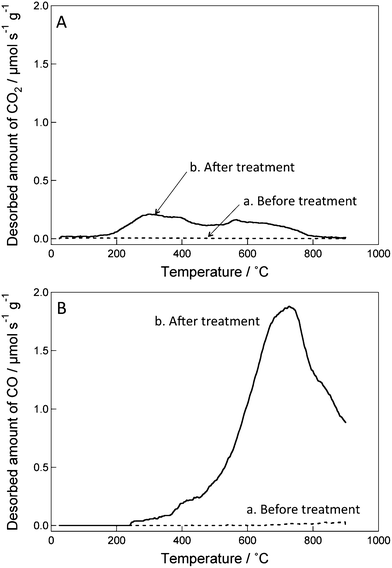
We initially examined the water dispersibility of ozone-treated CSCNF. Water containing 5 mg mL−1 ozone-treated CSCNF after an ultrasonic treatment for 1 h exhibited a uniform dark color, indicating a good dispersibility. In contrast, untreated CSCNF was poorly dispersed in water even after the ultrasonic treatment. These results suggest that hydrophilic groups are introduced to the CSCNF surface by ozone treatment.The hydrophilic groups were therefore analyzed by the TPD method. If oxygen-containing groups such as carboxyl, anhydrides, and phenol are present on a surface of a carbon material, CO and CO2 gases are released by thermal desorption during thermal treatment under an inert gas.29 By monitoring the amounts of released CO and CO2 and their thermal desorption temperatures, the surface coverage and types of oxygen-containing functional groups on the carbon material can be estimated.29Fig. 2 shows TPD charts of ozone-treated and untreated CSCNF. It is clear that CO and CO2 are released from the ozone-treated CSCNF surface, whereas desorption from the untreated one is almost negligible. The desorption of CO is attributed to anhydrides (> 400 °C), phenol (> 600 °C), ether, carbonyl, and quinone groups (> 700 °C).29 CO2 released at 200–400 °C is attributed to carboxyl groups and that released above 400 °C is ascribed to lactone groups and/or anhydrides.29 We therefore conclude that some of those oxygen-containing groups form on the CSCNF surface in the ozone treatment. Since the total amounts of CO and CO2 released from the ozone-treated CSCNF are 2.10 and 0.35 mmol g−1, respectively, the total amount of oxygen atoms introduced to CSCNF by the ozone treatment is ≥2.80 (= 2.10 + 0.35 × 2) mmol g−1. Since some oxygen atoms such as those of phenol and carbonyl groups could have desorbed as H2O30 and we cannot accurately separate H2O molecules desorbed from CSCNF from those released from the substrate and the glass vessel used, it is difficult to determine the total amount of oxygen atoms precisely. On the other hand, the net surface area of the treated CSCNF was determined by the BET method based on N2 adsorption to be approximately 2.3 × 106 cm2 g−1. The surface coverage of oxygen atoms on the ozone-treated CSCNF surface is therefore estimated to be ≥1.2 × 10⁻⁹ mol cm−2. Considering the typical structure of our CSCNF,19 the atomic ratio of carbon atoms at the outer surface to the overall carbon atoms is about 2.6 × 10⁻². Therefore, we estimate the atomic ratio of the oxygen atoms to the outer edge carbon atoms to be 5.3 × 10⁻².
Next, CSCNF was characterized by Raman spectroscopy before and after the ozone treatment. It is known that sp2 carbon atoms give rise to Raman peaks at around 1350 or 1580 cm−1.31 Carbon atoms consisting the well-ordered graphene structure give a G band signal at 1580 cm−1. On the other hand, carbon atoms adjacent to a defect or a graphene edge give a D band signal at 1350 cm−1. For example, a strong acid treatment of SWCNT and MWCNT disrupts their structures and increases their D/G ratios.32–34 Also, treatment of SWCNT with 200 ppm ozone for 1 h increases its D/G ratio from 0.12 to 0.74.35 This suggests that some of the C–C bonds in the graphene structure are broken by the ozone treatment. However, in the present case the D/G ratio of CSCNF increased only slightly (Fig. 3A), from 0.63 to 0.66, even under much more severe conditions (800 ppm for 2 h). Since only a few percent of the graphene structure of CSCNF is exposed and the other parts of the cup are covered with another cup, the graphene structure is protected from severe damages.
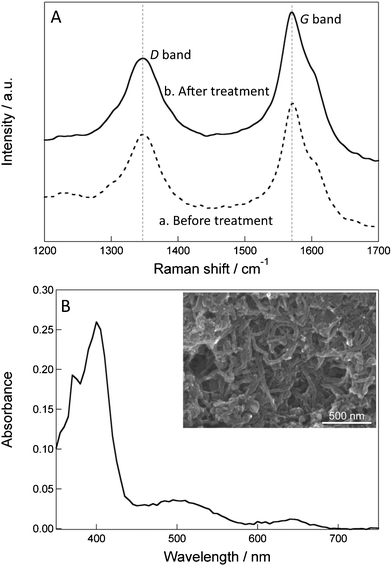 | ||
| Fig. 3 (A) Raman spectra of CSCNF (a) before and (b) after the ozone treatment. (B) Visible spectrum of the high HRP/CSCNF-modified electrode. The spectrum of the CSCNF-modified electrode is subtracted. Inset shows a typical SEM image of the surface of the high HRP/CSCNF-modified electrode. | ||
Response of HRP/CSCNF-modified electrode to H2O2
We prepared the HRP/CSCNF–modified electrode using the ozone-treated CSCNF. The SEM image of the electrode surface is shown in Fig. 3B (inset). Three dimensional networks of CSCNF with the diameter of 20–50 nm are obvious.Cathodic current responses of the HRP/CSCNF-modified electrode to H2O2 were measured at +0.150 V (vs. Ag|AgCl) in an air saturated 67 mM phosphate buffer solution (pH 6.4). After the back-ground current stabilized, H2O2 was injected to the solution and a steady-state cathodic current was observed. This current is likely due to electron transfer from the electrode to HRP via CSCNF. The reaction mechanisms are as follows.28,36
| ferric HRP + H2O2 → compound I + H2O | (1) |
| compound I + e− + H+ → compound II | (2) |
| compound II + e− + H+ → ferric HRP + H2O | (3) |
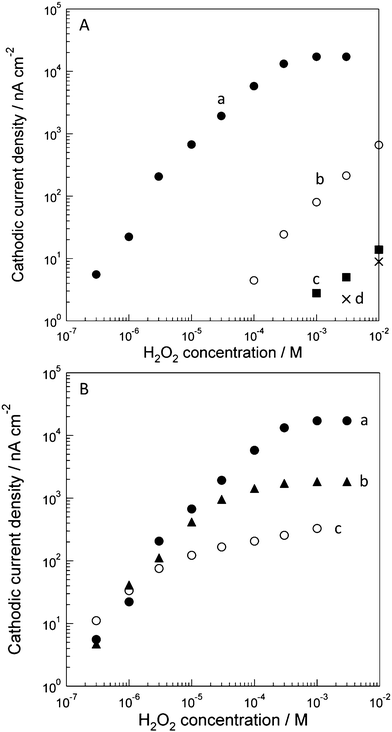 | ||
| Fig. 4 (A) Cathodic current densities of H2O2 reduction at (a) the HRP/CSCNF-modified electrode, (b) the CSCNF-modified electrode, (c) the HRP-modified electrode, and (d) bare electrode in an air-saturated 67 mM phosphate buffer solution (pH 6.4) at +0.150 V vs. Ag|AgCl. Cast amount of HRP was 3.3 × 10⁻⁸ mol cm−2 and that of CSCNF was 0.33 mg cm−2. (B) Dependence of cathodic current responses to H2O2 at (a) the high, (b) middle, and (c) low HRP/CSCNF-modified electrodes in an air-saturated 67 mM phosphate buffer solution (pH 6.4) at +0.150 V vs. Ag|AgCl. Cast amounts of HRP were (a) 3.3 × 10⁻⁸, (b) 3.3 × 10⁻⁹, and (c) 3.3 × 10⁻¹⁰ mol cm−2 and that of CSCNF was 0.33 mg cm−2, respectively. | ||
We also examined the dependence of the cathodic current responses to H2O2 on the surface coverage of HRP (Fig. 4B). The cast amounts of HRP were 3.3 × 10⁻¹⁰, 3.3 × 10⁻⁹, and 3.3 × 10⁻⁸ mol cm−2 (low, middle, and high HRP/CSCNF-modified electrodes, respectively) and that of CSCNF was 0.33 mg cm−2. As a result, approximately the same sensitivity (current/H2O2 concentration) was obtained in the low H2O2 concentration region (≤3 × 10⁻⁶ M). These results indicate that the rate of H2O2 reduction by HRP (eqn 1) is faster than that of H2O2 diffusion from the bulk solution to HRP; the system is diffusion-controlled. If the rate of H2O2 reduction is slower than that of the H2O2 diffusion, the current response should increase as the HRP coverage on the electrode increases. This is also supported by the transient response to H2O2; the current decreased gradually after addition of H2O2. In contrast, saturation currents in the higher H2O2 concentration region increased as the cast amount of HRP increased. These results indicate that the electron transfer reactions (eqn 2 and 3) are not limited by diffusion of H+; the system is kinetically controlled. This is supported by the transient response; a current decrease, which is observed in a diffusion-controlled system, was not observed and the current was almost constant after immediate increase of the current in response to addition of H2O2. We can therefore estimate the kinetics of the electron transfer reactions if we know the amount of HRP.
We therefore subjected the low, middle, and high HRP/CSCNF-modified electrodes to spectrophotometric measurements. As a result, only the high HRP/CSCNF-modified electrode exhibited a spectrum attributed to HRP (Fig. 3B, the spectrum of CSCNF-modified electrode is subtracted). On the basis of the spectrum, we determined the minimum surface coverage of HRP. Assuming that the molar extinction coefficient ε of the immobilized HRP at the peak wavelength is equal to that of dissolved HRP (ε = 102 mM−1 cm−1),27 the minimum surface coverage of the high HRP/CSCNF-modified electrode is estimated to be 2.6 ± 0.7 × 10⁻⁹ mol cm−2 (mean ± SE, n = 4). This value is one order of magnitude lower than the cast amount (3.3 × 10⁻⁸ mol cm−2). This is likely due to the shielding of light by CSCNF and/or detachment of cast HRP molecules before overcoating HRP and CSCNF with PLL and PSS. Since the surface area of CSCNF is about 2.3 × 106 cm2 g−1, the surface area of CSCNF immobilized on the electrode surface was roughly calculated to be about 7.5 × 102 cm2. Hence, the minimum surface coverage of HRP on the CSCNF surface is estimated to be 3.4 × 10⁻¹² mol cm−2. This value is close to the spectroscopically determined surface coverage of a HRP monolayer on a fluorine-doped tin oxide (FTO) electrode, 7.0 × 10⁻¹² mol cm−2,37 suggesting that HRP molecules adsorb onto CSCNF as a monolayer.
Kinetic analysis of the HRP reactions
Kinetics of the reactions were analyzed on the basis of the observed currents (Fig. 4B, plot a) and the HRP coverage (ca. 2.6 × 10⁻⁹ mol cm−2). As mentioned above, the current response in the low H2O2 concentration range (≤1.0 × 10⁻⁵ M) is determined by the rate of reaction 1. If reaction 1 is not diffusion-controlled but kinetically controlled, the cathodic current i1 is given by eqn 4.28,38,39
| i 1 = 2Fk1ΓCS | (4) |
| i 23 = 2FΓCHk2k3/(k2 + k3) | (5) |
Since the current in the low H2O2 concentration range is limited by diffusion, we can only estimated the minimum k1 value from eqn 4. The value was estimated to be 88 M−1 s−1 from the i1/CS value (4.4 × 10⁻² A cm−2 M−1 at 3.0 × 10⁻⁶ to 1.0 × 10⁻⁵ M H2O2 for the high HRP/CSCNF-modified electrode, Fig. 4B) and the Γ value (2.6 × 10⁻⁹ mol cm−2). The minimum k1 value is actually lower than those obtained for HRP-adsorbed graphite electrodes by Ruzgas et al. (3.9 × 10⁴ M−1 s−1)40 and Tatsuma et al. (3.1 × 10⁴ M−1 s−1).28
We also estimated the k2k3/(k2 + k3) value on the basis of eqn 5 from the i23 value of 1.7 × 10⁻⁵ A cm−2 at 1.0 × 10⁻³ M H2O2 for the high HRP/CSCNF-modified electrode, the Γ value, and the CH value of 4.0 × 10⁻⁷ M to be about 8.5 × 10⁴ M−1 s−1. This value is about two orders of magnitude lower than that at pH 7.0 of the HRP-adsorbed graphite electrode reported by Ruzgas et al. (6.6 × 10⁶ M−1 s−1).40 This difference may be explained in terms of the coexising polymers (i.e., PLL and PSS), which may interfere with the direct electrochemistry of HRP.28 Local pH around HRP molecules may also be high (i.e., the CH value may be low) in the present system because of PLL.
Application to inhibitor sensing
The reduction of H2O2 catalyzed by HRP (eqn 1–3) is suppressed when an inhibitor such as cyanide is added to the system, because the inhibitor coordinates to the sixth coordination site of ferric HRP, which is the reaction site of H2O2. The concentration of the inhibitor can be evaluated from the current decrease.36,41 From the current response to H2O2 before and after addition of an inhibitor, a %inhibition value R is determined.
| R = 100 × (i0 − i)/i0 | (6) |
| R = 100/(1/KappCi + 1) | (7) |
| K app = K/(1 + k1Γd/D) | (8) |
Fig. 5 shows dependence of the %inhibition value for the low and high HRP/CSCNF-modified electrodes on the cyanide concentration. Here the H2O2 concentration was 1.0 μM, where the eqn 1 is the rate-determining step. The inhibition curve for the high HRP/CSCNF-modified electrode apparently shifts towards the higher concentration region compared to that for the low HRP/CSCNF-modified electrode. From the inhibition curves, the Kapp values were determined to be 1.5 ± 0.5 × 10⁵ M−1 (n = 3) and 3.1 ± 1.2 × 10³ M−1 (n = 4) for the low and high HRP/CSCNF-modified electrodes, respectively. In a previous report regarding a similar cyanide sensing by a pyrolytic graphite electrode with adsorbed HRP (HRP/PG), the Kapp value was regulated between 1.3 × 10⁵ M−1 and 1.7 × 10⁴ M−1.36 The control of the dynamic range was over about one order of magnitude for the previous HRP/PG electrode with a two dimensional surface geometry. In the present work, the three dimensional network of CSCNF allowed control of the HRP amount and the dynamic range over about two orders of magnitude. In addition to cyanide, it is expected to tune the dynamic range for other inhibitors, such as azide, thiourea, and dichromate.43,44
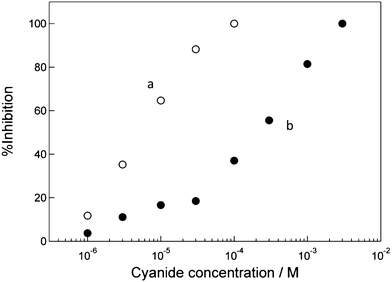 | ||
| Fig. 5 Dependence of the inhibition ratio of (a) the low and (b) high HRP/CSCNF–modified electrodes on the cyanide concentration in an air-saturated 67 mM phosphate buffer solution (pH 6.4) containing 1.0 μM H2O2 at +0.150 V vs. Ag|AgCl. | ||
Conclusion
CSCNF was treated with ozone to introduce oxygen-containing groups onto the edges of the graphene cups. The hydrophilic CSCNF was used to construct a three-dimensional network that works both as an electrical nanowire and an enzyme support. By taking advantage of the network, we developed biosensors for H2O2 and cyanide, and regulated their sensing limits. Future improvement in the contact between the graphene edges and the enzymes would facilitate the direct electrochemistry of enzymes.Acknowledgements
We are grateful to Dr Y. Kato for help with the Raman spectroscopy measurement. This work was supported by an International cooperative program of the Japan Science and Technology Agency (JST, Japan).References
- J. Wang, Electroanalysis, 2005, 17, 7–14 CrossRef CAS.
- B. Mahar, C. Laslau, R. Yip and Y. Sun, IEEE Sens. J., 2007, 7, 266–284 CrossRef CAS.
- J. Wang and Y. Lin, TrAC, Trends Anal. Chem., 2008, 27, 619–626 CrossRef CAS.
- J. J. Gooding, Electrochim. Acta, 2005, 50, 3049–3060 CrossRef CAS.
- P. Serp, M. Corrias and P. Kalck, Appl. Catal., A, 2003, 253, 337–358 CrossRef CAS.
- R. M. Wightman, M. R. Deakin, P. M. Kovach, W. G. Kuhr and K. J. Stutts, J. Electrochem. Soc., 1984, 131, 1578–1583 CrossRef CAS.
- R. J. Bowling, R. T. Packard and R. L. McCreery, J. Am. Chem. Soc., 1989, 111, 1217–1223 CrossRef CAS.
- C. E. Banks, R. R. Moore, T. J. Davies and R. G. Compton, Chem. Commun., 2004, 1804–1805 RSC.
- M. Pacios, M. del Valle, J. Bartroli and M. J. Esplandiu, J. Electroanal. Chem., 2008, 619–620, 117–124 CrossRef CAS.
- G. Jönsson and L. Gorton, Electroanalysis, 1989, 1, 465–468 CrossRef.
- Y. Xu, W. Peng, X. Liu and G. Li, Biosens. Bioelectron., 2004, 20, 533–537 CrossRef CAS.
- J. Pang, C. Fan, X. Liu, T. Chen and G. Li, Biosens. Bioelectron., 2003, 19, 441–445 CrossRef CAS.
- G. Wang, N. M. Thai and S.-T. Yau, Electrochem. Commun., 2006, 8, 987–992 CrossRef CAS.
- C. M. Silveira, S. P. Gomes, A. N. Araújo, M. C. B. S. M. Montenegro, S. Todorovic, A. S. Viana, R. J. C. Silva, J. J. G. Moura and M. G. Almeida, Biosens. Bioelectron., 2010, 25, 2026–2032 CrossRef CAS.
- J. J. Gooding, R. Wibowo, J. Liu, W. Yang, D. Losic, S. Orbons, F. J. Mearns, J. G. Shapter and D. B. Hibbert, J. Am. Chem. Soc., 2003, 125, 9006–9007 CrossRef CAS.
- F. Patolsky, Y. Weizmann and I. Willner, Angew. Chem., Int. Ed., 2004, 43, 2113–2117 CrossRef CAS.
- J. Liu, A. Chou, R. Rahmat, M. N. Paddon-Row and J. J. Gooding, Electroanalysis, 2005, 17, 38–46 CrossRef CAS.
- T. Noda, T. Ukai and T. Yao, Anal. Sci., 2010, 26, 675–679 CrossRef CAS.
- Y. Takahashi, H. Fujita, W.-H. Lin, Y.-Y. Li, T. Fujii and A. Sakoda, Adsorption, 2010, 16, 57–68 CrossRef CAS.
- J. Kong, A. M. Cassel and H. Dai, Chem. Phys. Lett., 1998, 292, 567–574 CrossRef CAS.
- G. Che, B. B. Lakshmi, C. R. Martin, E. R. Fisher and R. S. Ruoff, Chem. Mater., 1998, 10, 260–267 CrossRef CAS.
- C. L. Cheung, A. Kurtz, H. Park and C. M. Lieber, J. Phys. Chem. B, 2002, 106, 2429–2433 CrossRef CAS.
- S. Nagasawa, M. Yudasaka, K. Hirahara, T. Ichihashi and S. Iijima, Chem. Phys. Lett., 2000, 328, 374–380 CrossRef CAS.
- H. Hu, B. Zhao, M. E. Itkis and R. C. Haddon, J. Phys. Chem. B, 2003, 107, 13838–13842 CrossRef CAS.
- M. Eswaramoorthy, R. Sen and C. N. R. Rao, Chem. Phys. Lett., 1999, 304, 207–210 CrossRef CAS.
- H. P. Boehm, Carbon, 1994, 32, 759–769 CrossRef CAS.
- P. J. Ohlsson, Acta Chem. Scand., Ser. B, 1976, 30b, 373–375 CrossRef.
- T. Tatsuma, K. Ariyama and N. Oyama, J. Electroanal. Chem., 1998, 446, 205–209 CrossRef CAS.
- J. L. Figueiredo, M. F. R. Pereira, M. M. A. Freitas and J. J. M. Órfão, Carbon, 1999, 37, 1379–1389 CrossRef CAS.
- S. Haydar, C. Moreno-Castilla, M. A. Ferro-García, F. Carrasco-Marín, J. Rivera-Utrilla, A. Perrard and J. P. Joly, Carbon, 2000, 38, 1297–1308 CrossRef CAS.
- M. S. Dresselhaus, A. Jorio, M. Hofmann, G. Dresselhaus and R. Saito, Nano Lett., 2010, 10, 751–758 CrossRef CAS.
- K. C. Park, T. Hayashi, H. Tomiyasu, M. Endo and M. S. Dresselhaus, J. Mater. Chem., 2005, 15, 407–411 RSC.
- M. T. Martínez, M. A. Callejas, A. M. Benito, M. Cochet, T. Seeger, A. Ansón, J. Schreiber, C. Gordon, C. Marhic, O. Chauvet, J. L. G. Fierro and W. K. Maser, Carbon, 2003, 41, 2247–2256 CrossRef.
- S. Costa and E. B. Palen, Acta Phys. Pol. A, 2009, 116, 32–35 CAS.
- W. Sun, U. Khaled, H. Tomita, Z. Li, K. Imasaka and J. Suehiro, Jpn. J. Appl. Phys., 2010, 49, 055002 CrossRef.
- T. Tatsuma and N. Oyama, Anal. Chem., 1996, 68, 1612–1615 CrossRef CAS.
- T. Tatsuma, Y. Okawa and T. Watanabe, Anal. Chem., 1989, 61, 2352–2355 CrossRef CAS.
- T. Tatsuma, M. Gondaira and T. Watanabe, Anal. Chem., 1992, 64, 1183–1187 CrossRef CAS.
- T. Tatsuma and T. Watanabe, Anal. Chem., 1992, 64, 625–630 CrossRef CAS.
- T. Ruzgas, L. Gorton, J. Emnéus and G. Marko-Varga, J. Electroanal. Chem., 1995, 391, 41–49 CrossRef.
- M. H. Smit and A. E. G. Cass, Anal. Chem., 1990, 62, 2429–2436 CrossRef CAS.
- K. Komori, K. Takada and T. Tatsuma, J. Electroanal. Chem., 2005, 585, 89–96 CrossRef CAS.
- H. Zollner, Handbook of enzyme inhibitors part A, 2nd Ed., VCH Verlagagesellschaft GmbH, Germany, 1993, 367–368 Search PubMed.
- J. Zhao, R. W. Henkens and A. L. Crumbliss, Biotechnol. Prog., 1996, 12, 703–708 CrossRef CAS.
| This journal is © The Royal Society of Chemistry 2012 |

