Sensitive metal ion sensors based on fibrous polystyrene membranes modified by polyethyleneimine
Min
Sun
abc,
Bin
Ding
*ab and
Jianyong
Yu
*b
aState Key Laboratory for Modification of Chemical Fibers and Polymer Materials, College of Materials Science and Engineering, Donghua University, Shanghai, 201620, China. E-mail: binding@dhu.edu.cn; Fax: +86-21-62378202; Tel: +86-21-62378202
bNanomaterials Research Center, Research Institute of Donghua University, Shanghai, 200051, China. E-mail: Yujy@dhu.edu.cn
cCollege of Textiles, Donghua University, Shanghai, 20051, China
First published on 15th December 2011
Abstract
The primary goal of the present study is to develop a quartz crystal microbalance (QCM) sensor functionalized by three-dimensional sensing membranes for heavy metal ion detection. The fibrous polystyrene (PS) membranes were stabilized on the QCM electrode and modified with subsequent gold sputtering, followed by the functionalization of the sensing polyethyleneimine. The morphology and specific surface area (SSA) of the PS membranes were controllable by adjusting the weight ratios of the blend solvents of tetrafuran, N,N-dimethylformamide. The resultant sensors with optimal structure showed excellent selectivity for Cr3+ with a detection limit of 5 ppb. Sensor sensitivity increased concurrently with both increasing PS loading and SSA on the electrode of QCM. The sensor responses showed good linearity in the 5–200 ppb concentration range. The results suggest that the fibrous membrane QCM sensors have potential for further applications in other sensors.
Introduction
Pollution of heavy metals poses a threat to living systems because of the ability of heavy metals to accumulate in the food chain.1 Therefore, the detection and assessment of heavy metal ions in solutions are important tasks. Currently, although there are several methods used in heavy metal ion detection, such as neutron activation analysis, atomic absorption spectroscopy, and inductively coupled plasma-mass spectroscopy,2–4 these techniques are time consuming and require complex instruments and sample manipulation.5 Accordingly, developing simple, rapid, and economically viable methods with low detection limits and high sensitivity is urgent.Electrospinning is a versatile and efficient method to produce polymer or composite fibers, with diameters from tens of nanometres to several micrometres, by applying a high voltage on the polymer solution. The morphologies, structures, and properties of fibers are controllable by adjusting the solution properties and processing parameters.6–12 These three-dimensional electrospun fibrous mats with high specific surface area (SSA) and high surface roughness have demonstrated potential applications in surface super-hydrophobicity,13–15 sensors,16filtration,17 tissue engineering,18 biocatalysts,19dye-sensitized solar cells,20etc.
The theory of piezoelectricity was first postulated by the Curie brothers in 1880.21 Its potential as a sensor was first developed by Sauerbrey, who realized the relationship between the frequency shift and the mass of the thin film deposited on the electrode.22
| Δf = −2f2Δm/A(μρ)1/2 |
Since then, quartz crystal microbalance (QCM), as a sensitive piezoelectricity sensor, has been widely used for the measurements of mass changes in a variety of studies. Various sensing coatings have been used to bind agents onto the surface of QCM electrodes, including peptide,23silanization,24protein G,25morpholine,26 and polyethyleneimine (PEI).27 The sensitivity of QCM-based sensors has been shown to be positively influenced by the SSA of the sensing coatings.28 To increase sensitivity, an increasing number of attempts have been reported to develop nanostructured coatings on the electrode of QCM to achieve the designed functions, including nano-assembled thin films,29nanotube,30,31 and nanofibers.32Polyelectrolytes deposited as fibrous membranes on the electrode of QCM through electrospinning have shown higher sensitivities in detecting vapors (formaldehyde and moisture) than as cast films.32,33 However, the water solubility of these polyelectrolytes limits their application in aqueous environments.
Thermoplastic polystyrene (PS), a transparent and stiff material with a high electrical resistance and low dielectric loss, has been widely studied as a typical hydrophobic polymer for super-hydrophobic electrospun mat surfaces. The present paper is a preliminary report describing a chemical sensor based on QCMs deposited with electrospun PS membranes functionalized by PEI for the detection of heavy metal ions in solution. The emphasis of the paper is on the sensitivity of resultant sensors. The effects of PS membrane loading and SSA on the metal ion sensing properties are also investigated in detail.
Experimental
Materials
PS (Mn 170![[thin space (1/6-em)]](https://www.rsc.org/images/entities/char_2009.gif) 000) was purchased from Sigma-Aldrich and PEI (Mw 70
000) was purchased from Sigma-Aldrich and PEI (Mw 70![[thin space (1/6-em)]](https://www.rsc.org/images/entities/char_2009.gif) 000) was from Alfa Aesar Co., Ltd. Tetrahydrofuran (THF), N,N-dimethylformamide (DMF) and ethanol were from Shanghai Chemical Regents Co., Ltd The metal salts Cu(NO3)2·2H2O, MnSO4·H2O, FeCl2, Cr(NO3)3·9H2O, Cd(NO3)2·4H2O, Pb(NO3)2, NiSO4·6H2O and CoSO4·7H2O used as analytes were of analytical grade (Aladdin-reagent). Ultra-pure water from the Heal Force SNW Water System with a resistance of 18.2 MΩ was used throughout this research.
000) was from Alfa Aesar Co., Ltd. Tetrahydrofuran (THF), N,N-dimethylformamide (DMF) and ethanol were from Shanghai Chemical Regents Co., Ltd The metal salts Cu(NO3)2·2H2O, MnSO4·H2O, FeCl2, Cr(NO3)3·9H2O, Cd(NO3)2·4H2O, Pb(NO3)2, NiSO4·6H2O and CoSO4·7H2O used as analytes were of analytical grade (Aladdin-reagent). Ultra-pure water from the Heal Force SNW Water System with a resistance of 18.2 MΩ was used throughout this research.
Electrospinning
PS solutions was prepared at a 10 wt% concentration in DMF–THF mixtures at 0![[thin space (1/6-em)]](https://www.rsc.org/images/entities/char_2009.gif) :
:![[thin space (1/6-em)]](https://www.rsc.org/images/entities/char_2009.gif) 4, 1
4, 1![[thin space (1/6-em)]](https://www.rsc.org/images/entities/char_2009.gif) :
:![[thin space (1/6-em)]](https://www.rsc.org/images/entities/char_2009.gif) 3, 2
3, 2![[thin space (1/6-em)]](https://www.rsc.org/images/entities/char_2009.gif) :
:![[thin space (1/6-em)]](https://www.rsc.org/images/entities/char_2009.gif) 2, 3
2, 3![[thin space (1/6-em)]](https://www.rsc.org/images/entities/char_2009.gif) :
:![[thin space (1/6-em)]](https://www.rsc.org/images/entities/char_2009.gif) 1, and 4
1, and 4![[thin space (1/6-em)]](https://www.rsc.org/images/entities/char_2009.gif) :
:![[thin space (1/6-em)]](https://www.rsc.org/images/entities/char_2009.gif) 0 weight ratios, respectively. The schematic of the electrospinning process is shown in Fig. 1. Polymer solutions were placed in a 10 mL syringe and fed with a syringe pump (LSP02-1B, Baoding Longer Precision Pump Co., Ltd., China). The positive electrode of a high-voltage power supply (DW-P303-1ACD8, Tianjin Dongwen High Voltage Co., China) was clamped to the metal needle tip which was connected to a plastic syringe. The feeding rate of solutions was 4 mL h−1 and the applied voltage was 20 kV. The PS membranes were continuously collected on the grounded electrode of QCM (5 MHz, AT-cut quartz crystal with Au electrodes, 1 Hz = 17.67 ng) at a 15 cm tip-to-collector distance. All fabrication processes were carried out in a constant environment of 22 °C and 45%. The fibrous-membranes coated QCMs were dried for 30 min at 22 °C under vacuum prior to characterization.
0 weight ratios, respectively. The schematic of the electrospinning process is shown in Fig. 1. Polymer solutions were placed in a 10 mL syringe and fed with a syringe pump (LSP02-1B, Baoding Longer Precision Pump Co., Ltd., China). The positive electrode of a high-voltage power supply (DW-P303-1ACD8, Tianjin Dongwen High Voltage Co., China) was clamped to the metal needle tip which was connected to a plastic syringe. The feeding rate of solutions was 4 mL h−1 and the applied voltage was 20 kV. The PS membranes were continuously collected on the grounded electrode of QCM (5 MHz, AT-cut quartz crystal with Au electrodes, 1 Hz = 17.67 ng) at a 15 cm tip-to-collector distance. All fabrication processes were carried out in a constant environment of 22 °C and 45%. The fibrous-membranes coated QCMs were dried for 30 min at 22 °C under vacuum prior to characterization.
 | ||
| Fig. 1 Schematic diagram showing the electrospinning deposition of fibrous PS membranes onto the QCM electrode. | ||
Characterization
The morphology of the PS fibers was examined using field emission scanning electron microscopy (FE-SEM) (S-4800, Hitachi Ltd., Japan). Fiber samples were sputter-coated with a 4 nm layer of gold by a sputter. The diameter of the fibers was measured using an image analyser (Adobe Photoshop 9.0). The Brunauer–Emmett–Teller (BET) SSA, total pore volume and pore size distribution of the fibrous mats were characterizedd by nitrogen adsorption using a surface area and porosity analyzer (Micromeritics, ASAP 2020).Modification of the PS membranes
The PS membranes were coated with gold (99.999% purity) for 60 s using a JPGF-400B-G Sputter (BEI YI Ltd.). A 10 μL aliquot of an ethanol solution containing 2% (v/v) PEI was dispersed onto the electrode of QCM and the electrodes were air-dried.Metal-ion testing
The experimental setup for measuring the sensing properties of the sensors is shown in Fig. 2. The QCM sensing unit was put into a beaker with 200 mL ultra-pure water under vigorous stirring. The whole setup was fixed in a relatively closed chamber with a constant air temperature of 22 °C. After the stabilization of the QCM frequency, various concentrations of heavy metal-ion solutions were injected into the beaker. The time for each adsorption was 4 min. Frequency shifts of QCM was measured by the QCM digital controller and recorded by a personal computer.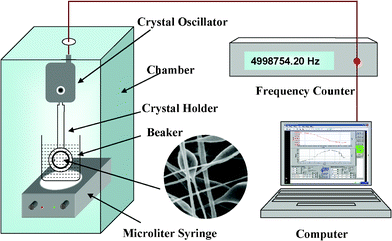 | ||
| Fig. 2 Schematic diagram of a testing system for metal ions. | ||
Results and discussion
Morphology and structure of the electrospun PS membranes
Fig. 3 shows the FE-SEM micrograph of electrospun fibers formed with various weight ratios of THF–DMF in the solvent. The FE-SEM images exhibited a beads-on-string morphology in all the samples. The presence of beads in electrospun fibers is a common phenomenon, which may be caused by Taylor cone-shaped oscillates and become asymmetrical in the jet resulting from the low viscosity of the polymer solution.34 For a given polymer and solvent, the viscosity of the polymer is mainly determined by the concentration. The FE-SEM images also showed that there was a well-developed rough nanotexture structure on the fiber surface and nanopores on the bead surface. The mechanism of unique structure formation in electrospun fibers is very complex. It can be attributed to the rapid phase separation and solidification because of the simultaneous diffusion process of solvent evaporation in the electrospinning process.35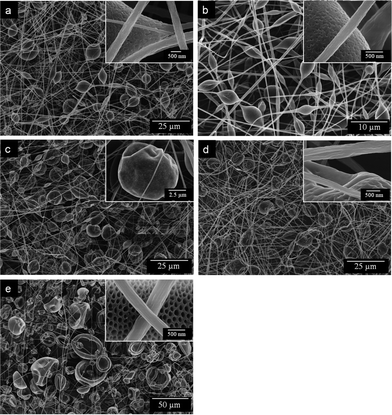 | ||
Fig. 3
FE-SEM images of electrospun PS membranes formed with various weight ratios of THF–DMF in the solvent: (a) 0![[thin space (1/6-em)]](https://www.rsc.org/images/entities/char_2009.gif) : :![[thin space (1/6-em)]](https://www.rsc.org/images/entities/char_2009.gif) 4, (b) 1 4, (b) 1![[thin space (1/6-em)]](https://www.rsc.org/images/entities/char_2009.gif) : :![[thin space (1/6-em)]](https://www.rsc.org/images/entities/char_2009.gif) 3, (c) 2 3, (c) 2![[thin space (1/6-em)]](https://www.rsc.org/images/entities/char_2009.gif) : :![[thin space (1/6-em)]](https://www.rsc.org/images/entities/char_2009.gif) 2, (d) 3 2, (d) 3![[thin space (1/6-em)]](https://www.rsc.org/images/entities/char_2009.gif) : :![[thin space (1/6-em)]](https://www.rsc.org/images/entities/char_2009.gif) 1, and (e) 4 1, and (e) 4![[thin space (1/6-em)]](https://www.rsc.org/images/entities/char_2009.gif) : :![[thin space (1/6-em)]](https://www.rsc.org/images/entities/char_2009.gif) 0. 0. | ||
With DMF, spindle-like beads with surface nanopores and fibers with wrinkled surfaces formed. The average fiber diameter was 0.73 μm, and the average bead diameter was 5.96 μm, with the sample showing an SSA of 40.0 m2 g−1 (Fig. 4 and 5). By increasing the THF contents in the solvent mixtures, the average fiber diameters decreased from 0.73 to 0.56 μm, with an increase in the THF–DMF ratios from 0![[thin space (1/6-em)]](https://www.rsc.org/images/entities/char_2009.gif) :
:![[thin space (1/6-em)]](https://www.rsc.org/images/entities/char_2009.gif) 4 to 3
4 to 3![[thin space (1/6-em)]](https://www.rsc.org/images/entities/char_2009.gif) :
:![[thin space (1/6-em)]](https://www.rsc.org/images/entities/char_2009.gif) 1. The average bead diameters decreased to 3.33 μm, the highest SSA of 43.0 m2 g−1 was achieved at a 1
1. The average bead diameters decreased to 3.33 μm, the highest SSA of 43.0 m2 g−1 was achieved at a 1![[thin space (1/6-em)]](https://www.rsc.org/images/entities/char_2009.gif) :
:![[thin space (1/6-em)]](https://www.rsc.org/images/entities/char_2009.gif) 3 THF–DMF solvent composition. The average bead diameters increased from 3.33 to 11.46 μm, with an increase in the THF–DMF ratios from 1
3 THF–DMF solvent composition. The average bead diameters increased from 3.33 to 11.46 μm, with an increase in the THF–DMF ratios from 1![[thin space (1/6-em)]](https://www.rsc.org/images/entities/char_2009.gif) :
:![[thin space (1/6-em)]](https://www.rsc.org/images/entities/char_2009.gif) 3 to 4
3 to 4![[thin space (1/6-em)]](https://www.rsc.org/images/entities/char_2009.gif) :
:![[thin space (1/6-em)]](https://www.rsc.org/images/entities/char_2009.gif) 0. The SSA of the sample decreased from 43.0 to 2.5 m2 g−1 simultaneously. Particularly, the sample formed from 1
0. The SSA of the sample decreased from 43.0 to 2.5 m2 g−1 simultaneously. Particularly, the sample formed from 1![[thin space (1/6-em)]](https://www.rsc.org/images/entities/char_2009.gif) :
:![[thin space (1/6-em)]](https://www.rsc.org/images/entities/char_2009.gif) 3 THF–DMF showed nearly an 18-fold increase in SSA than that from THF alone. Note that the shape of the beads also changed from spindle-like to spherical when the THF increased.
3 THF–DMF showed nearly an 18-fold increase in SSA than that from THF alone. Note that the shape of the beads also changed from spindle-like to spherical when the THF increased.
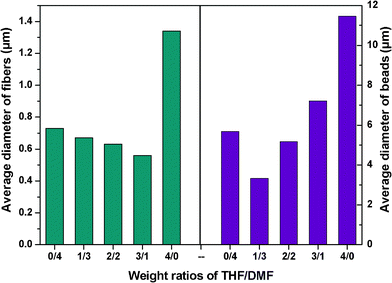 | ||
| Fig. 4 Average diameter of fibers and beads formed with various weight ratios of THF–DMF in the solvent. | ||
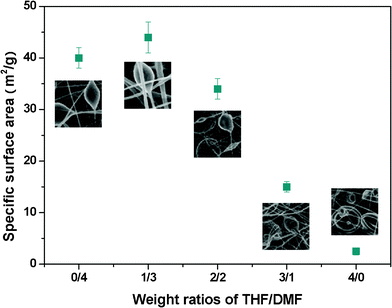 | ||
| Fig. 5 SSA of the electrospun PS membranes formed with various weight ratios of THF–DMF in the solvent. Error bars are the standard deviation of three replicates. | ||
The N2 physisorption (adsorption–desorption) isotherm and the pore size distribution curves are shown in Fig. 6. According to the International Union of Pure and Applied Chemistry (IUPAC) isotherm classification, the resultant isotherms can be categorized as type II with a distinct hysteresis loop, indicating that the electrospun PS fibers are typical mesoporous materials. Increasing the relative pressure increased the quantity of N2 adsorbed, which is slightly less than 0.8 P/P0 of the relative pressure region. However, it sharply increased to greater than 0.8 P/P0 in the three samples with THF–DMF weight ratios of 2![[thin space (1/6-em)]](https://www.rsc.org/images/entities/char_2009.gif) :
:![[thin space (1/6-em)]](https://www.rsc.org/images/entities/char_2009.gif) 2, 1
2, 1![[thin space (1/6-em)]](https://www.rsc.org/images/entities/char_2009.gif) :
:![[thin space (1/6-em)]](https://www.rsc.org/images/entities/char_2009.gif) 3, and 0
3, and 0![[thin space (1/6-em)]](https://www.rsc.org/images/entities/char_2009.gif) :
:![[thin space (1/6-em)]](https://www.rsc.org/images/entities/char_2009.gif) 4. The pore size was investigated in detail based on the pore volume distribution in Fig. 6. The image shows that the pore width is mainly distributed within the range of 40–70 nm. The pore width of the THF–DMF weight ratios of 3
4. The pore size was investigated in detail based on the pore volume distribution in Fig. 6. The image shows that the pore width is mainly distributed within the range of 40–70 nm. The pore width of the THF–DMF weight ratios of 3![[thin space (1/6-em)]](https://www.rsc.org/images/entities/char_2009.gif) :
:![[thin space (1/6-em)]](https://www.rsc.org/images/entities/char_2009.gif) 1 and 4
1 and 4![[thin space (1/6-em)]](https://www.rsc.org/images/entities/char_2009.gif) :
:![[thin space (1/6-em)]](https://www.rsc.org/images/entities/char_2009.gif) 0 PS fibers is relatively non-uniform in comparison with that of the other three samples. The SSA showed a very close relationship with pore volume. The pore volume of THF–DMF weight ratios of 3
0 PS fibers is relatively non-uniform in comparison with that of the other three samples. The SSA showed a very close relationship with pore volume. The pore volume of THF–DMF weight ratios of 3![[thin space (1/6-em)]](https://www.rsc.org/images/entities/char_2009.gif) :
:![[thin space (1/6-em)]](https://www.rsc.org/images/entities/char_2009.gif) 1 and 4
1 and 4![[thin space (1/6-em)]](https://www.rsc.org/images/entities/char_2009.gif) :
:![[thin space (1/6-em)]](https://www.rsc.org/images/entities/char_2009.gif) 0 fibers was much smaller than that of the others.
0 fibers was much smaller than that of the others.
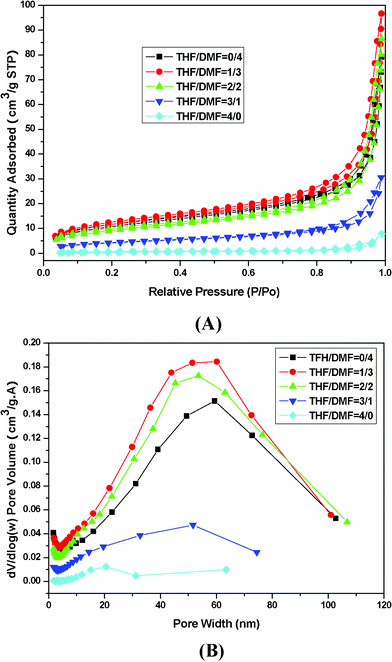 | ||
| Fig. 6 Nitrogen adsorption and desorption isotherm of PS membranes (A) and pore size distribution (B). | ||
Detection of heavy metal ions
Several heavy metal ions, including Cu2+, Mn2+, Fe2+, Cr3+, Cd2+, Pb2+, Ni2+, and Co2+, at various concentrations were injected into a beaker and monitored by resonant frequency in real time (Fig. 7). With the same concentrations of metal ions, frequency shifts of QCM sensors were higher for Cr3+ than for other metal ions. In particular, Cr3+ sensors exhibited a sensitivity of 0.41 Hz ppb−1, with a detection limit of 5 ppb. Cd2+ and Pb2+ showed considerable interference, which is presumably due to its similar structure. When exposed to Cu2+, Mn2+, Fe2+, and Ni2+, the sensors exhibited a much lower sensitivity.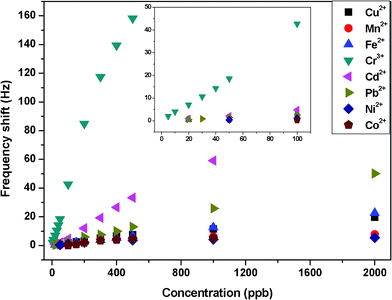 | ||
| Fig. 7 Responses of QCM sensors with a PS membrane loading of about 1000 Hz and SSA of 43.0 m2 g−1 exposed to various metal ions in aqueous solutions. The inset is the amplified image in the range of 0–100 ppb. | ||
In our case, the amine group on the backbone of PEI played the main role in the sorption of metal ions. With the same ligand, the extent of such complexation was closely related to the speciation of metal ions, their size, and charge. Owing to the significant influence of electrostatic forces in these systems, the smaller the size and the larger the charge of a metal ion, the easier is the metal complex formation. Cr3+ had the smallest size and the largest charge in the above-mentioned metal ions.
The preferential sorption behavior can also be explained in terms of crystal field effects and class of metals. The more electropositive metals (e.g., Cr) belong to class a. The less electropositive metals (e.g., Cu and Pb) belong to class b. Class a metals form their most stable complexes with ligands, in which the donor atom is N. Therefore, the sorption of Cr3+ was favorable.
Effect of PS loading on sensing performance
Fig. 8 presents the real-time response of QCM sensors with three PS loading levels to the increasing concentrations of Cr3+ from 5 to 200 ppb. The response of all three QCM sensors to Cr3+ increased gradually with the increasing Cr3+ concentrations. The QCM sensors without PS membranes had no response to Cr3+ at concentrations below 10 ppb and showed only a 1.9 Hz frequency shift when exposed to 20 ppb. Exposure to 30, 40, 50, 100, and 200 ppb of Cr3+ showed maximum frequency shifts of 3.6, 5.5, 7.5, 15, and 32.2 Hz, respectively, for QCM sensors without PS membranes. The QCM sensors with PS membranes, detected Cr3+ at concentrations as low as 5 ppb, and their responses increased with the increase in PS loading. When exposed to 20 ppb of Cr3+, the maximum frequency shifts of the PS-loaded sensors were 4.5 and 7.0 Hz at a PS loading of 500 and 1000 Hz, respectively. However, when exposed to 100 ppb of Cr3+, the maximum frequency shifts of the QCM sensor with a PS loading of 1000 Hz were three times higher than those of QCM sensors without PS loading.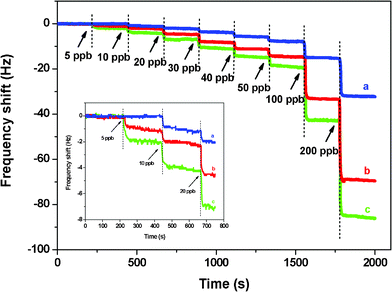 | ||
| Fig. 8 Responses of QCM sensors of various coatings exposed to Cr3+ at neutral pH. PS membrane loading is (a) 0, (b) 500, and (c) 1000 Hz. The inset is the amplified image in the range of 0–800 s. The SSA of the PS membrane is 43.0 m2 g−1. | ||
When the three QCM sensors were characterized to increase the concentrations of Cr3+, a linear response was observed (Fig. 9). The coefficient of determination (R2) of the calibration curves was >0.99, indicating a good correlation of the sensitivities of the QCM sensors. Compared with the QCM sensors without PS membranes, those sensors with PS membranes showed a much higher sensitivity and lower detection limit. Slopes of the three calibration curves were approximately 0.14, 0.36, and 0.41 Hz ppb−1, respectively, for QCM sensors without PS membranes, with 500 and 1000 Hz PS loading.
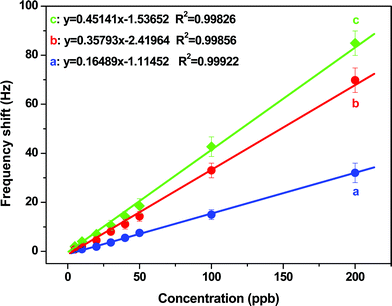 | ||
| Fig. 9 Dependence of the QCM sensor frequency shifts on various Cr3+ concentrations obtained from the curves in Fig. 8. Error bars are the standard deviation of five replicates. | ||
Effect of SSA on sensing performance
To examine the effect of SSA on sensing performance, PS membranes with three SSA levels at 2.5, 16.0, and 43.0 m2 g−1 were selected as the fibrous templates for Cr3+ detection (Fig. 10). The responses of QCM sensors with PS membrane SSA of 43.0 and 16.0 m2 g−1 to 5 ppb were 2 and 0.5 Hz, respectively, and increased drastically with increasing Cr3+ concentrations. Although the QCM sensor with PS membrane SSA of 2.5 m2 g−1 increased gradually with increasing Cr3+ concentrations, it had no response to Cr3+ at concentrations below 10 ppb and had a slight response (0.7 Hz) to 10 ppb. Impressively, when exposed to 100 ppb of Cr3+, the maximum frequency shifts of QCM sensor with PS membrane SSA of 43.0 m2 g−1 were four times higher than those of sensors with PS membrane SSA of 2.5 m2 g−1. This finding can be due to the higher SSA of the PS membranes, which in turn assembles more sensing materials to chelate more Cr3+.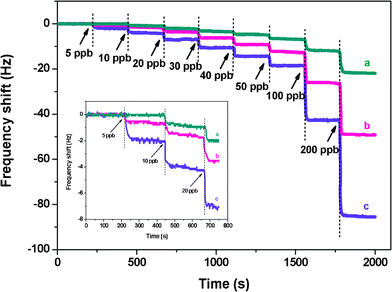 | ||
| Fig. 10 Responses of QCM sensors of various coatings exposed to Cr3+. PS membranes with SSA are (a) 2.5, (b) 16.0, and (c) 43.0 m2 g−1. The inset is the amplified image in the range of 0–800 s. The PS membrane loading is about 1000 Hz. | ||
The calibration curves of the three QCM sensors are shown in Fig. 11. At Cr3+ concentrations between 5 and 200 ppb, the frequency shifts of all three QCM sensors increased and exhibited good linearity with increasing Cr3+ concentrations. The regression coefficients, R2, were 0.99826, 0.99772, and 0.99395 for QCM sensors with PS membrane SSA of 2.5, 16.0, and 43.0 m2 g−1, respectively. Furthermore, the isotherm increased more steeply for QCM sensors with a PS membrane SSA of 43.0 m2 g−1 than for the other two sensors when exposed to Cr3+ in the range of 5–200 ppb.
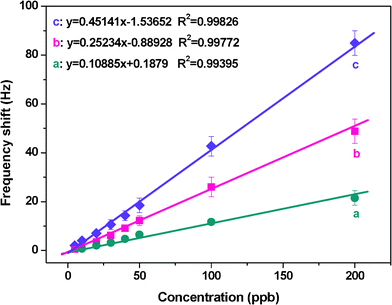 | ||
| Fig. 11 Dependence of the QCM sensor frequency shifts on various Cr3+ concentrations obtained from the curves in Fig. 10. Error bars are the standard deviation of five replicates. | ||
Regeneration and reproducibility of QCM sensors
To evaluate the reproducibility of the resultant sensors, the QCM response of each sensor was estimated eight times for each concentration of Cr3+. For repeated use of the sensors, metal ions could be removed from the PEI film by washing it with ultra-pure water. After reaching complete desorption, QCM sensors were treated again with 50 ppb Cr3+. Fig. 12 displays the response of QCM sensors with optimal loading and structure to 50 ppb of Cr3+ and reveals that the resultant sensors could be reused at least for five times. More than 60% of the original response was maintained after five assays.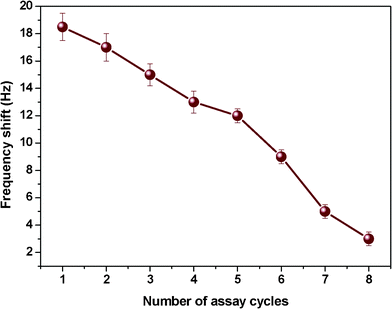 | ||
| Fig. 12 Reproducibility test for the frequency shifts of QCM sensors with a PS membrane loading of 1000 Hz and SSA of 43.0 m2 g−1 exposed to 50 ppb Cr3+. Error bars are the standard deviation of five replicates. | ||
Conclusions
Fibrous membranes showing high SSA with a mean of 43.0 m2 g−1 and nanopores were produced by electrospinning PS with the blend solvents of tetrafuran, N,N-dimethylformamide. The characteristics of electrospun PS membranes were strongly affected by the solvent compositions. The SSA of PS membranes increased when the DMF in mixture solvents increased, the highest SSA of 43.0 m2 g−1 was achieved at a 1![[thin space (1/6-em)]](https://www.rsc.org/images/entities/char_2009.gif) :
:![[thin space (1/6-em)]](https://www.rsc.org/images/entities/char_2009.gif) 3 THF–DMF solvent composition. The sensing properties of the QCM sensors indicate that the PS membrane loading and SSA are important parameters influencing the sensitivity of QCM sensors for metal ions. QCM sensors with optimal structures showed good selectivity to Cr3+ and exhibited high sensitivity to Cr3+ at concentrations as low as 5 ppb. When exposed to 100 ppb of Cr3+, the maximum frequency shifts of the QCM sensor with a PS loading of 1000 Hz were three times higher than those of QCM sensors without PS loading. The maximum frequency shifts of the QCM sensor with PS membrane SSA of 43.0 m2 g−1 were four times higher than those of QCM sensors with PS membrane SSA of 2.5 m2 g−1. The resultant sensor response was reproducible and showed a linear relationship with the increase in concentration from 5 to 200 ppb.
3 THF–DMF solvent composition. The sensing properties of the QCM sensors indicate that the PS membrane loading and SSA are important parameters influencing the sensitivity of QCM sensors for metal ions. QCM sensors with optimal structures showed good selectivity to Cr3+ and exhibited high sensitivity to Cr3+ at concentrations as low as 5 ppb. When exposed to 100 ppb of Cr3+, the maximum frequency shifts of the QCM sensor with a PS loading of 1000 Hz were three times higher than those of QCM sensors without PS loading. The maximum frequency shifts of the QCM sensor with PS membrane SSA of 43.0 m2 g−1 were four times higher than those of QCM sensors with PS membrane SSA of 2.5 m2 g−1. The resultant sensor response was reproducible and showed a linear relationship with the increase in concentration from 5 to 200 ppb.
Acknowledgements
This work is supported by the National Natural Science Foundation of China (No. 50803009 and 51173022), Shanghai Nano Special Projects (11nm0502900), the “111 Project” (No. 111-2-04 and B07024), the “Dawn” Program of Shanghai Education Commission (10SG32), Scientific Research Foundation for the Returned Overseas Chinese Scholars, Ministry of Education of China, and the Fundamental Research Funds for the Central Universities.References
- D. M. Templeton, Fresenius J. Anal. Chem., 1999, 363, 505–511 CrossRef CAS.
- D. Kumar and R. Sharma, Eur. Polym. J., 1998, 34, 1053–1060 CrossRef CAS.
- P. Teasdale and G. Wallace, Analyst, 1993, 118, 329–334 RSC.
- R. Milacic and J. Stupar, Analyst, 1994, 119, 627–632 RSC.
- N. A. Malakhova, A. V. Chernysheva and K. Z. Brainina, Electroanalysis, 1991, 3, 803–814 CAS.
- Y. Miyauchi, B. Ding and S. Shiratori, Nanotechnology, 2006, 17, 5151–5156 CrossRef CAS.
- Z. Y. Li, H. N. Zhang, W. Zheng, W. Wang, H. M. Huang, C. Wang, A. G. MacDiarmid and Y. Wei, J. Am. Chem. Soc., 2008, 130, 5036–5037 CrossRef CAS.
- L. Wang, P. D. Topham, O. O. Mykhaylyk, J. R. Howse, W. Bras, R. A. L. Jones and A. J. Ryan, Adv. Mater., 2007, 19, 3544–3548 Search PubMed.
- J. Zheng, A. He, J. Li, J. Xu and C. C. Han, Polymer, 2006, 47, 7095–7102 CrossRef CAS.
- B. Ding, M. Wang, X. Wang, J. Y. Yu and G. Sun, Mater. Today, 2010, 13, 16–27 CrossRef CAS.
- J. Du and Y. L. Hsieh, Nanotechnology, 2008, 19, 125707 CrossRef.
- X. F. Wang, B. Ding, J. Y. Yu and M. Wang, Nano Today, 2011, 6, 510–530 Search PubMed.
- X. H. Li, B. Ding, J. Y. Lin, J. Y. Yu and G. Sun, J. Phys. Chem. C, 2009, 113, 20452–20457 CrossRef CAS.
- M. Sun, X. H. Li, B. Ding, J. Y. Yu and G. Sun, J. Colloid Interface Sci., 2010, 347, 147–152 CrossRef CAS.
- H. Q. Cao, H. Zheng, K. Y. Liu and R. P. Fu, Cryst. Growth Des., 2010, 10, 597–601 CrossRef CAS.
- B. Ding, M. Yamazaki and S. Shiratori, Sens. Actuators, B, 2005, 106, 477–483 CrossRef.
- C. Shin, J. Colloid Interface Sci., 2006, 302, 267–271 Search PubMed.
- Y. Zhang, Y. Feng, Z. Huang, S. Ramakrishna and C. T. Lim, Nanotechnology, 2006, 17, 901 CrossRef CAS.
- S. Madhugiri, B. Sun, P. G. Smirniotis, J. P. Ferraris and K. J. Balkus, Microporous Mesoporous Mater., 2004, 69, 77–83 CrossRef CAS.
- K. Onozuka, B. Ding, Y. Tsuge, T. Naka, M. Yamazaki, S. Sugi, S. Ohno, M. Yoshikawa and S. Shiratori, Nanotechnology, 2006, 17, 1026–1031 CrossRef CAS.
- J. Curie and P. Curie, Comp. Rend, 1880, 91, 294–297 Search PubMed.
- G. Sauerbrey, Z. Phys., 1959, 155, 206–222 Search PubMed.
- S. Sankaran, S. Panigrahi and S. Mallik, Sens. Actuators, B, 2011, 155, 8–18 Search PubMed.
- H. Muramatsu, J. M. Dicks, E. Tamiya and I. Karube, Anal. Chem., 1987, 59, 2760–2763 CrossRef CAS.
- B. S. Attili and A. A.Suleiman, Microchem. J., 1996, 54, 174–179 Search PubMed.
- G. J. Price, A. A. Clifton, V. J. Burton and T. C. Hunter, Sens. Actuators, B, 2002, 84, 208–213 CrossRef.
- B. Konig and M. Gratzel, Anal. Chim. Acta, 1993, 280, 37–41 CrossRef CAS.
- A. Kolmakov and M. Moskovits, Annu. Rev. Mater. Res., 2004, 34, 151–180 CrossRef CAS.
- S. Korposh, R. Selyanchyn and S. W. Lee, Sens. Actuators, B, 2010, 147, 599–606 CrossRef.
- H. W. Chen, R. J. Wu, K. H. Chan, Y. L. Sun and P. G. Su, Sens. Actuators, B, 2005, 104, 80–84 CrossRef.
- M. M. Ayad and A. A. El-Nasr, J. Phys. Chem. C, 2010, 114, 14377–14383 CAS.
- X. F. Wang, B. Ding, M. Sun, J. Y. Yu and G. Sun, Sens. Actuators, B, 2010, 144, 11–17 CrossRef.
- X. F. Wang, B. Ding, J. Y. Yu, M. Wang and F. K. Pan, Nanotechnology, 2010, 21, 055502 CrossRef.
- K. Garg and G. L. Bowlin, Biomicrofluidics, 2011, 5, 013403–13422 Search PubMed.
- J. Y. Lin, B. Ding and J. Y. Yu, ACS Appl. Mater. Interfaces, 2010, 2, 521–528 CrossRef CAS.
| This journal is © The Royal Society of Chemistry 2012 |
