Anomalous permeation of the [P5W30O110]15− polyoxoanion in polyelectrolyte multilayer films
Guy
Ladam
a,
Valérie
Toniazzo
b,
David
Ruch
b,
Hassan
Atmani
a,
Massoma
Ibrahim
c,
Ulrich
Kortz
c and
Vincent
Ball
*b
aLaboratoire de Biophysique et Biomatériaux (La2B), SMS EA 3233, Université de Rouen - Centre Universitaire d'Evreux, 1 rue du 7ème Chasseurs, 27002, Evreux Cedex, France
bDepartment of Advanced Materials and Structures, Centre de Recherche Public Henri Tudor, 66 rue de Luxembourg, 4002, Esch-sur-Alzette, Luxembourg. E-mail: vincent.ball@tudor.lu; Fax: (+352) 42 59 91 555; Tel: (+352) 42 59 911
cSchool of Engineering and Science, Jacobs University, P.O. Box 750561, 28725, Bremen, Germany
First published on 2nd March 2012
Abstract
The integration of polyoxoanions into functional thin films is of major interest to increase their use as catalysts or to provide new properties to the films. The incorporation of polyoxoanions in polyelectrolyte multilayer (PEM) films has been widely used for such aims. In most investigations, the polyoxoanions were used as a component of the layering process and there is only limited work investigating the interactions of polyoxoanions with preformed PEM films. Herein, we investigated the incorporation of the 30-tungsto-5-phosphate [P5W30O110]15− polyoxoanion into PEM films made from hyaluronic acid (HA) and poly(allylamine hydrochloride) (PAH) as a function of the polyoxoanion's concentration. Surprisingly, we found an increased amount of incorporated [P5W30O110]15− upon a decrease in its bulk concentration. Confocal Raman microscopy allowed us to investigate the concentration profile of the polyoxoanion across films of about 3 μm in thickness. Homogeneous distribution was only found for films fed with polyoxoanions at the lowest bulk concentration, namely 1.2 × 10⁻⁶ M, whereas the films fed with solutions at higher concentrations (1.2 × 10⁻⁴ M) showed local enrichment in POM at the film–solution interface. We explain the lower amount of incorporated polyoxoanion at high bulk concentration by the formation of a polyoxoanion-rich barrier reducing further diffusion of the anions in the deeper part of the films.
Introduction
Polyoxometalates (POMs) have been known since the early 19th century.1 The synthesis, structure and properties of these metal-oxo cluster compounds have been increasingly investigated.2,3 The discovery of their possible self-assembly in solution to yield super-large hollow capsules4,5 has shown that POMs are excellent building blocks for the design of supramolecular materials and, at the same time, they have allowed elucidation of the mystery of molybdenum blue solutions.6 In addition to their fundamental interest in inorganic chemistry, POMs find potential applications in catalysis,7 in medicine as possible anti-cancer and anti-viral agents,8–10 and also in surface science. The deposition of POMs at interfaces has been recently reviewed.11 This can be performed either by chemisorption,12 by entrapment in polymer matrices, by Langmuir–Blodgett deposition (LB),13 and by the layer-by-layer (LBL) deposition technique.14–22 Both the LB and LBL deposition methods are possible owing to the anionic nature of POMs.From a general point of view, LBL deposition23 may be driven by attractive electrostatic interactions, hydrogen bonding,24 electron donor–acceptor interactions,25 specific biomolecular interactions,26 as well as host–guest interactions.27 Moreover, a wide range of LBL deposition methods can be implemented, going from alternate dipping in solutions of the mutually interacting species, to spin coating,28 spray coating29 and the dewetting method.30 LBL deposition therefore offers a versatile tool to modify surfaces in fields as diverse as anticorrosion,31,32 nanoelectronics,33 sensors,34 and active coatings. In the latter two domains, LBL films containing POMs are particularly attractive because they may exhibit reversible electrochromism.
POM-containing LBL polyelectrolyte multilayer (PEM) films constitute a particular kind of nanoparticle-based coatings. Nanoparticles can be incorporated either as one of the two components in the alternated deposition process, or they can be post-loaded into a preformed PEM film acting as a host matrix.35 The latter strategy is possible owing to an ion exchange mechanism.36 The feasibility of loading the wheel-shaped 48-tungsto-8-phosphate [H7P8W48O184]33− in a PEM film comprised of polycationic poly-L-lysine (PLL) and polyanionic hyaluronate (HA) was demonstrated.37 In particular, the POM loading efficiency, defined as the ratio of oxidation current to film thickness, was found to be 11 × 10−9 A nm−1 by post-loading and 37 × 10−9 A nm−1 for films built up step-by-step by alternating depositions of POM and PLL (with 2.4 × 10⁻⁵ M POM solutions in both cases). This shows that post-loading allows roughly similar loading as regular LBL deposition. Another interesting finding in that previous study was that the loading of a (PLL–HA)10 film with [H7P8W48O184]33− was maximal at an intermediate concentration of 2.4 × 10⁻⁵ M, as established by UV-vis spectroscopy and cyclic voltammetry measurements of the POM surface concentration.
In addition to the loaded amount, the in-depth distribution of POMs within the PEM films may constitute an important feature for optimizing film properties and applications. The design of gradients of sensing elements within coatings intended for biosensing applications, for instance, would be of particular interest, as they would allow a sigmoidal response as a function of analyte concentration.38 Sensors based on such a concept basically respond to analytes only above a critical concentration corresponding to the inflection point of the sigmoidal curve. PEM films comprised of poly(diallyldimethylammonium chloride) (PDADMAC) and poly(acrylic acid) (PAA) were recently shown to allow for very slow incorporation of single-walled carbon nanotubes (SWNTs) (coated with sodium dodecyl sulfate), and the SWNTs were found to be located preferentially at the uppermost part of the film.39 To obtain a more homogeneous loading with SWNTs, the PEM films had to be removed from their substrates as free-standing films before incubation in the SWNTs suspension.39
Here, we report on the post-loading of the disc-shaped polyanion [P5W300110]15− ({P5W30}, see Fig. 1)40 into PEM films comprising polycationic poly(allylamine hydrochloride) (PAH) and polyanionic HA, produced by the alternate dipping method. The aim of this work was to generalize the unusual dependency of post-loaded POM amounts with respect to solution concentration, and to investigate the corresponding in-depth distributions of POM within the PEM films. The films will be denoted as (PAH-HA)n, where n stands for the number of deposition cycles. The main physicochemical properties of {P5W30} are given in Table 1. We choose this particular POM because of its high stability in a broad pH window between 0 and 11 as shown in the literature.40 One should note the high surface charge density of {P5W30} (1.9 × 10¹⁸ elementary charges per m2).
![Ball-and-stick representation of the 30-tungsto-5-phosphate [P5W30O110]15− ({P5W30}) polyoxoanion. Purple: phosphorus; black: tungsten; red: oxygen.](/image/article/2012/RA/c2ra00761d/c2ra00761d-f1.gif) | ||
| Fig. 1 Ball-and-stick representation of the 30-tungsto-5-phosphate [P5W30O110]15− ({P5W30}) polyoxoanion. Purple: phosphorus; black: tungsten; red: oxygen. | ||
| a Given by the number of sodium counter cations present in the crystal structure. Upon dissolution in aqueous solution, here in sodium acetate buffer (10 mM, pH 4) with 0.15 M NaCl, the effective charge may be lower owing to incomplete dissociation of the counter cations. b Calculated by dividing the polyanion charge by the surface of a sphere having the approximate diameter of {P5W30}. c Obtained from calibration curves by UV-vis spectroscopy, with {P5W30} dissolved in sodium acetate buffer (10 mM, pH 4) with 0.15 M NaCl. | |
|---|---|
| Molecular mass/g mol−1 | 8333 |
| Approximate diameter/nm | 1.6 |
| Structural chargea | −15e |
Charge density/e m−2![[thin space (1/6-em)]](https://www.rsc.org/images/entities/char_2009.gif) b b |
−1.87 × 10¹⁸ |
Molecular extinction coefficient (λ = 230 nm)/L mol−1 cm−1![[thin space (1/6-em)]](https://www.rsc.org/images/entities/char_2009.gif) c c |
3.49 × 10⁵ |
To our knowledge, this investigation is the first aimed to investigate the distribution of nanoparticles, here polyoxoanions, after diffusion for a given amount of time (24 h and 7 days) in “exponentially growing” polyelectrolyte multilayer films as a function of the polyoxoanion concentration. The observation of gradients in the concentration of nanoparticles or SWNTs in the direction perpendicular to the substrate onto which the film is deposited is rather common39 but the way to control such gradients remains unknown. Herein we use confocal Raman microspectroscopy to investigate the distribution of the polyoxoanions in films having a thickness close to 3 μm.
Results and discussion
We first measured the kinetics of interaction of {P5W30} with (PAH-HA)10 PEM films (Fig. 2). The adsorption onto, or permeation into the films was a slow process and reached a plateau only after 24 h in the case of the lowest concentration investigated (2.4 × 10⁻⁷ M). Surprisingly, the steady-state increase rate of absorbance at 230 nm is maximal for the lowest concentration investigated. Moreover the amount of POM immobilized on/in the film at the steady state of the kinetics significantly increases with decreasing POM solution concentration (Fig. 3).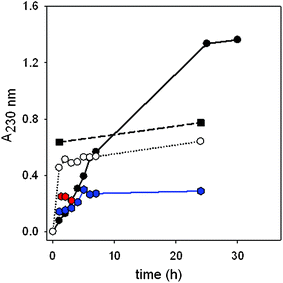 | ||
Fig. 2 Kinetics of {P5W30} adsorption onto/ incorporation into (PAH-HA)10 films from POM solutions at ( ) 2.4 × 10⁻⁴ M, ( ) 2.4 × 10⁻⁴ M, ( ) 1.2 × 10⁻⁴ M, (■) 1.2 × 10⁻⁵ M, (○) 1.2 × 10⁻⁶ M, (●) 2.4 × 10⁻⁷ M, as followed by UV-vis spectroscopy. Lines are added to guide the eye. ) 1.2 × 10⁻⁴ M, (■) 1.2 × 10⁻⁵ M, (○) 1.2 × 10⁻⁶ M, (●) 2.4 × 10⁻⁷ M, as followed by UV-vis spectroscopy. Lines are added to guide the eye. | ||
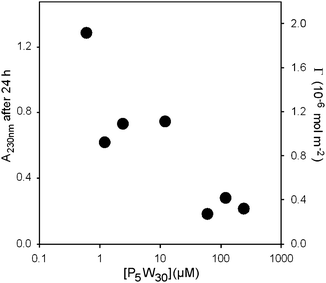 | ||
| Fig. 3 Adsorption isotherm of {P5W30} onto/into (PAH-HA)10 PEM films as measured by the absorbance at 230 nm after 24 h of contact. The surface concentration of immobilized POM was derived from absorbance values by means of eqn (1) (see Experimental section). | ||
From ellipsometry, the thickness of a (PAH-HA)10 film measured in the dry state increases by only 3% (from 146 to 150 nm in the dry state) upon 24 h contact with 2.4 × 10⁻⁴ M {P5W30}, and by 14% upon contact with 100-fold less concentrated, 2.4 × 10⁻⁶ M {P5W30}.
In order to verify that the decrease of the loaded amount of {P5W30} with increasing concentration was not only an apparent result due to a possible destructive effect of the POM on the PEM film, we compared the ATR-FTIR signatures of a (PAH-HA)30 film before and after treatment with the POM (Fig. 4). This film is about 900 nm in thickness in the wet state, hence slightly thicker than the penetration depth of the IR beam in the film at 1600 cm−1, hence if some erosion would occur at the film/solution interface, it should be detected as a decrease in the intensity of the Amide I band. On the contrary the intensity of the Amide I and II bands increase slightly upon incorporation of {P5W30} which could be due to some increase in polyelectrolyte concentration. This is not unrealistic taking into account that the film thickness and hence its volume are almost unaffected during the incorporation of the POMs. The IR spectra also reflect the appearance of new bands in the 900–1000 cm−1 wavenumber range which can be attributed to the presence of {P5W30}in the film. Clearly, no detectable film destruction occurred upon contact with the most concentrated POM solution (1.2 × 10⁻⁴ M), otherwise the characteristic bands of polysaccharides (1000–1200 cm−1), the Amide II (1350–1500 cm−1) and Amide I bands (1600–1700 cm−1) would have decreased in absorbance compared to the reference spectrum of the native (PAH-HA)30 film.
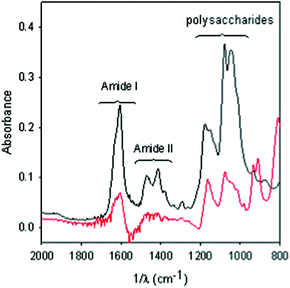 | ||
| Fig. 4 ATR-FTIR spectra of a (PAH-HA)30 film before (black) and after (red) 24-h contact with a 1.2 × 10⁻⁴ M {P5W30} solution. The surface was rinsed with acetate-NaCl buffer before acquisition of the spectra. The spectrum of the film put in contact with the polyoxoanion containing solution (red spectrum) was calculated taking the spectrum of the pristine (PAH-HA)30 film (black spectrum) as a reference, meaning that negative bands in the red spectrum would correspond to film erosion. | ||
The decrease in {P5W30} loaded amount with increasing concentration is a counter-intuitive finding, since adsorption/incorporation phenomena usually display a monotonous increase of the deposited amount with increasing the concentration of the adsorbing species up to a plateau corresponding to substrate saturation.41 Together with the unexpected incorporation behaviour of [H7P8W48O184]33− into (PLL-HA)n LBL films described in our previous work,37 our results tend to generalize the unusual relationship between post-loaded amounts of POMs and solution concentration. We can reasonably hypothesize that the reduced amounts of incorporated {P5W30} at the highest solution concentrations could be due to the creation of a barrier decreasing the ability of the POM to diffuse deeply within the LBL architecture. This barrier must not appear or must be less compact at the lowest POM concentrations. We assume that the affinity of the POM for the film is so high, owing to the positive Donnan potential displayed by (PAH-HA)n films,42 that every POM remains trapped within the film as soon as it finds a “binding site”. When the POM solution concentration is high, many POMs are trapped in the upper part of the film which, in turn, hinders the diffusion of further incoming POMs deeper into the film. According to this model, homogeneous filling of the PEM with POMs is expected at low solution concentration (in the μM range), while a decreasing gradient of POM concentration from the film–solution interface to the substrate–film interface should appear at higher solution concentrations (in the 100 μM range). Such enrichment of the template–solution interface was already described in the case of cationic peptides permeating into microgels of poly(acrylic-co-acrylamide).43 These microgels carry a negative charge density and, above a critical number of cationic groups carried by the peptides, the latter accumulate at the microgel–solution interface. On the contrary, peptides of lower charge density diffuse through the whole microgel. In order to test the validity of the proposed model, we inspected POM-post-loaded PEM films by means of confocal Raman microspectroscopy. This technique allows in-depth chemical profiling of micrometric coatings.44 (PAH-HA)10 films having a thickness of about 150 nm in the dry state42 could not be addressed with this technique for in-depth profiling. Therefore we built up (PAH-HA)90 films having a thickness of about 2.5 μm in the dry state as derived from cross-sectional SEM views (Fig. 5). One can observe from SEM views that the films display a smooth and thick morphology, which renders them particularly suitable to 2-D and in-depth chemical mapping/profiling by means of confocal Raman microspectroscopy in order to establish the spatial distribution of the immobilized POM.
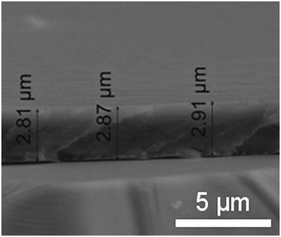 | ||
| Fig. 5 SEM cross-sectional view of a (PAH-HA)90 film in the dry state after 7-day immersion into a 1.2 × 10⁻⁴ M {P5W30} solution. The cross-section of the untreated (PAH-HA)90 film has an average thickness of 2.5 μm (not shown here). | ||
Although the incorporation of {P5W30} into thin (PAH-HA)10 films was achieved within 24 h for all the investigated concentrations (Fig. 2), nothing indicated that 24 h treatment of thicker (PAH-HA)90 films with POM solutions would be sufficient to reach equilibrium. In particular, this information was not accessible by means of UV-Vis spectroscopy, as for films comprised of 15 layer pairs or more, the absorbance due to incorporated {P5W30} reached values higher than 2.5, that is beyond the linear response domain of the spectrophotometer. Therefore we characterized films both after 24 h and after 7 day treatments with {P5W30} solutions at different concentrations.
Let us first consider the Raman signatures of films obtained after 24-h treatments (Fig. 6). First, one can note that all spectra recorded on each film were highly reproducible, suggesting chemical homogeneity of the surface. {P5W30} has a Raman peak around 965–975 cm−1, which is close to the peak of (PAH-HA)90 films at 950 cm−1. The former was shifted downwards by a few cm−1 upon incorporation of the POM into the films, which must result from the combined disruption of intermolecular interactions in the reference powders, and the creation of new interactions between embedded POMs and polyelectrolytes. Inspection of the 900–1000 cm−1 spectral region clearly reveals differences in peak intensities depending on the POM solution concentration (Fig. 7). It becomes evident that maximal amounts of {P5W30} were immobilized at intermediate concentration (1.2 × 10⁻⁵ M). Moreover, {P5W30} was immobilized in clearly detectable amounts whatever the concentration, as revealed by the ubiquitous Raman peak or shoulder at 965 cm−1.
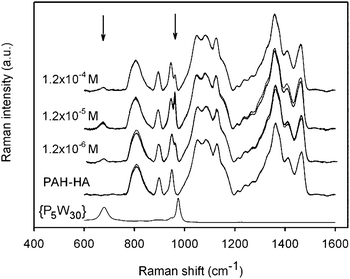 | ||
| Fig. 6 Raman spectra of (PAH/HA)90 films treated with {P5W30} at various concentrations during 24 h. The corresponding reference spectra of native (PAH/HA)90 films and pure {Na–P5W30} powder are also shown. For each film, 3 spectra recorded at 3 different locations are shown. All spectra relative to (PAH-HA)90 films were normalized with regards to the 1000–1200 cm−1 spectral region. Spectra of different samples were shifted in intensity for the sake of clarity. Arrows indicate the positions of the specific Raman peaks of {P5W30}. | ||
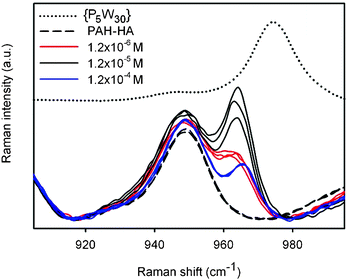 | ||
| Fig. 7 Focus on the spectral region between 900 and 1000 cm−1 of the spectra shown in Fig. 6. The spectra relative to the various PEM films were superimposed in order to facilitate their comparison. | ||
We also followed the vertical distribution of {P5W30} within (PAH-HA)90 films at one location of the surface, by recording the Raman spectra every 0.1 μm across the film section. The compositional in-depth profile was established by plotting the evolution of the Raman intensity for the two characteristic PAH-HA bands (at 1140 and 1360 cm−1), and for the band at 965 cm−1 related to {P5W30} (Fig. 8). As expected, the depth profiles of the PAH-HA peaks at 1140 and 1360 cm−1 are exactly superimposed for each film, and very similar for all films. The film thicknesses can be derived from the depth profiles by considering their width at half-maximum. We determined that the investigated (PAH-HA)90 films had thicknesses between 3.5 and 4 μm. Although these values are a bit higher than the values derived from SEM cross-sections (Fig. 5), both techniques are rather consistent, considering the fact that Raman measurements are performed in air, that is, with less dehydrated films than in the vacuum conditions required for SEM analysis.
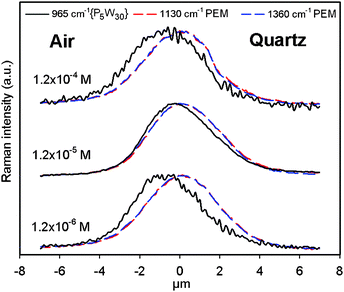 | ||
| Fig. 8 In-depth profiles of the Raman intensities at 1130 cm−1 and 1360 cm−1 (signature of PAH-HA films), and at 965 cm−1 (signature of {P5W30}) obtained at one typical location of (PAH-HA)90 films treated with {P5W30} solutions at various concentrations for 24 h, and then dried in air. All profiles were normalized in intensity to facilitate their comparison. | ||
For all concentrations, the respective distribution profiles of {P5W30} and the PAH-HA matrix are mostly superimposed, confirming that POM immobilization proceeded via diffusion-driven loading of the POM into the films, not simple surface adsorption. However, the distribution profiles are not strictly superimposed as the profile of {P5W30} is shifted outward from the PAH-HA profile, showing that the POM did not diffuse homogeneously throughout the film structure: the close vicinity of the substrate remained depleted, while the film surface was enriched in {P5W30}, possibly within the form of a dense layer of 0.5–1 μm in thickness. This observation strongly supports the existence of the barrier effect inferred from UV-vis measurements with (PAH-HA)10 architectures. One can note that the most homogeneous loading obtained after a 24 h treatment was obtained at the intermediate concentration of 1.2 × 10⁻⁵ M, consistently with the maximal loading detected by UV-vis (Fig. 2 and 3) and by Raman spectroscopy (Fig. 7).
We further investigated the homogeneity of POM loading after prolonged treatment in order to determine the durability of the barrier effect. Firstly, one can see that (PAH-HA)90 films obtained after 7 day treatments were homogeneous in the plane of the films for all the investigated {P5W30} concentrations, with strictly superimposed 2-D distributions of the PEM matrix and the POM (Fig. 9). Secondly, the in-depth distribution of {P5W30} perfectly superimposes with that of the PEM matrix, showing homogeneous loading of the films, for the 1.2 × 10⁻⁶ M concentration only, while for higher concentrations a slight enrichment of the outer film boundary in {P5W30} remains. This finding supports the persistence of a POM-rich barrier at the film–solution interface (Fig. 10). The absence of surface enrichment at the lowest concentration is consistent with the corresponding highest film loading deduced from {P5W30} Raman intensities (Fig. 11).
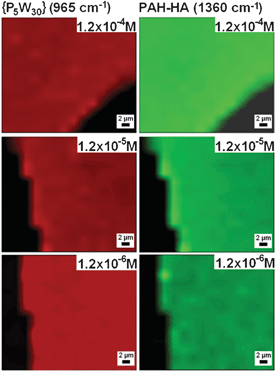 | ||
| Fig. 9 2-D chemical mappings of the POM (965 cm−1; red) and the PAH-HA matrix (1360 cm−1; green) performed by confocal Raman microspectroscopy over (PAH-HA)90 films put in contact for 7 days with {P5W30} solutions at various concentrations, then dried in air. Films were scratched by means of a needle (dark areas) prior to imaging in order to distinguish them from the substrate. | ||
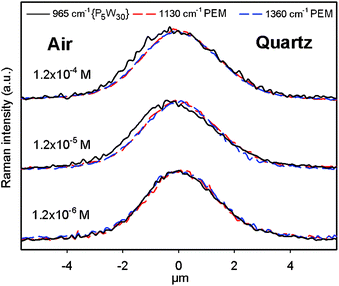 | ||
| Fig. 10 In-depth profiles of the Raman intensities at 1360 cm−1 (signature of PAH-HA films), and at 965 cm−1 (signature of {P5W30}) obtained at one typical location of (PAH-HA)90 films treated with {P5W30} solutions at various concentrations for 7 days, then dried in air. All the profiles were normalized in intensity to facilitate their comparison. | ||
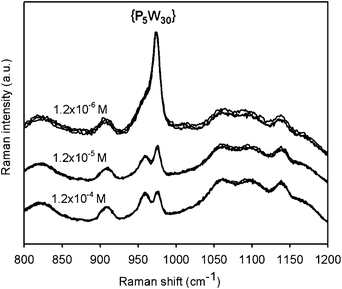 | ||
| Fig. 11 Raman spectra of (PAH/HA)90 films treated with {P5W30} at various concentrations during 7 days. For each film, 3 spectra recorded at 3 different locations are shown. Spectra of different samples were shifted in intensity for the sake of clarity. | ||
Raman spectroscopy analyses after 7 days of treatment with the POM solutions clearly point out a prolonged barrier effect hindering the penetration of the polyoxoanions into the films at the highest investigated concentrations in POMs, while at lower concentration, the initial strong barrier effect detected at 24 h disappeared in the meantime, allowing maximal loading of the film with the POM. One can note, however, that even for the highest concentrations, 7 day treatments led to homogeneous, although minimal, loadings. Moreover, comparing the Raman intensities of the {P5W30} peak and the PAH-HA peak at 950 cm−1 (Fig. 7 and Fig. 11), one can note that, as expected, the amounts of POM embedded into the films are significantly higher whatever the concentration after 7 days of treatment than after 24 h of treatment with the POM-containing solution. This shows that the barrier effect, although strongly hindering the diffusion of POM, did not totally block it. Therefore, we can reasonably assume that at highest concentrations, the films did not reach equilibrium even after 7 days.
Conclusions
In summary, our results show that, in a rather counter-intuitive manner, optimal loading of active species (such as POMs) in PEM films may be achieved at low concentrations better than at high concentration. This is due to the surface enrichment in active species, generating a durable barrier at high concentration, blocking the penetration of the POMs from the solution into the films. This duration of this effect seems itself to depend on the POM concentration in a non-monotonous manner. The barrier effect leads to inhomogeneous in-depth loading. Such inhomogeneous distributions of colloids diffusing in PEM films has been observed in the case of single-walled carbon nanotubes diffusing in PDADMAC-PAA architectures.39 In this case the accumulation of nanotubes at the film–solution interface was attributed to their anisotropic shape. This, however, should not be the case for {P5W30} having a flattened-sphere shape (Fig. 1). We rather attribute the reduced surface immobilization of {P5W30} at highest concentrations to the external deposition of a compact POM layer, probably due to the strongly attractive electrostatic interactions between polyanionic {P5W30} and polycationic PAH. Inhomogeneous distribution of POMs across PEM architectures may offer interesting properties for optical and sensing applications. A way to change the distribution of the POMs through the thickness of the films would be to perform experiments in which {P5W30} would be dissolved in buffer of different ionic strengths which will induce a dynamic response of the films, namely swelling or deswelling phenomena.45Experimental section
Chemicals: Sodium hyaluronate (HA, MWvis 420 kDa) was purchased from Lifecore Biomedical (Chaska, MN, USA). Poly(allylamine hydrochloride) (PAH, MWvis 70 kDa, Cat. No. 28,322-3) was purchased from Aldrich. Both polyelectrolytes were used without further purification and dissolved at a concentration of 1 mg mL−1 in a 0.15 M NaCl solution. The pH of this solution was close to 6 and to 8 for HA and PAH respectively. All aqueous solutions were prepared from ultrapure water (Milli Plus, Millipore, Billerica, Massachusetts, USA).The polyanion salt Na15[P5W30O110]·31H2O ({Na–P5W30}) was synthesized according to the literature40 and dissolved in 10 mM acetate buffer (pH 4) complemented with 0.15 M NaCl (“acetate-NaCl buffer”). {Na–P5W30} was dissolved at concentrations ranging from 2.4 × 10⁻⁷ to 2.4 × 10⁻⁴ M. POM-containing solutions were prepared freshly prior to each experiment.
Adsorption substrates: The PEM films were deposited atop quartz slides (4 × 1 cm2, Thuet, Blodelsheim, France) for UV-vis spectroscopy, confocal Raman microspectroscopy and scanning electron microscopy (SEM). The PEM films used for thickness determination by means of ellipsometry were deposited onto silicon wafers (Siltronix, Archamps, France, resistivity: 1 × 10⁻³ to 5 × 10⁻³ Ω cm). All substrates were cleaned by immersion in a piranha solution (1![[thin space (1/6-em)]](https://www.rsc.org/images/entities/char_2009.gif) :
:![[thin space (1/6-em)]](https://www.rsc.org/images/entities/char_2009.gif) 2 v/v mixture of H2O2 30% and H2SO4 98%) for 30 min, and then rinsed with ultrapure water.
2 v/v mixture of H2O2 30% and H2SO4 98%) for 30 min, and then rinsed with ultrapure water.
PEM films buildup and POM post-loading: PAH and HA were deposited alternatively onto the substrates during 5 min, either manually in the case of PEM films intended for UV-vis experiments, or with a dipping machine (DR3, Riegler & Kirstein, Germany) in the case of PEM films intended for confocal Raman microspectroscopy and scanning electron microscopy. Consecutive adsorption steps were always separated by a rinsing step with the NaCl electrolyte. Once the buildup was completed, each PEM film was rinsed with NaCl solution and finally with acetate-NaCl buffer, prior to immersion for a duration Δt in a {P5W30} solution.
Ellipsometry: Single wavelength ellipsometry (Horiba Jobin Yvon, PZ2000, Longjumeau, France) was used to measure the thickness evolution of (PAH-HA)n PEM films over the buildup. The measurements were performed at a constant wavelength (λ = 632.8 nm) and at constant angle of incidence (70°). The films were dried under a stream of nitrogen before the measurement and rehydrated with the 0.15 M NaCl solution for continuation of the buildup. Each thickness value represents the average over 5 measurements. We also used ellipsometry to monitor changes in thickness after 24 h of contact with {P5W30} solutions at 2.4 × 10⁻⁴ M or 2.4 × 10⁻⁶ M. For these measurements, PEM films were rinsed with acetate-NaCl buffer after incubation in POM solution and dried with nitrogen. We assumed all films to be homogeneous and isotropic having a refractive index of 1.465 (at λ = 632.8 nm). The measurements following POM incorporation were only semi-quantitative since the POM is expected to increase the film refractive index.
UV-vis spectroscopy: The spectrum of the substrate covered with a (PAH-HA)10 film was recorded over the wavelength domain 200–700 nm with an mc2 spectrophotometer (Safas, Monaco) and was taken as the baseline. The quartz slide covered with the (PAH-HA)10 film was then immersed in the {P5W30} solution. Regularly, the quartz slide was removed from the POM solution, rinsed in acetate-NaCl buffer and dried under nitrogen. The spectrum of the film was then measured and the absorbance A at λ = 230 nm was used to derive the surface concentration Γ in immobilized POM from Beer–Lambert law:
| Γ = A/(2ε) | (1) |
ATR-FTIR spectroscopy: we used an Equinox 55 spectrometer, Bruker, Wissembourg, France. The experiment consisted to deposit the PEM films onto a trapezoidal ZnSe crystal (Graseby-Specac, Orpington, UK) fitted into a flow-through cell. The polyelectrolyte solutions as well as the rinsing solutions were injected by means of a peristaltic pump. The transmission of the evanescent wave through the length of the trapezoidal crystal was acquired after the deposition of every three pairs of layers by accumulating 512 interferograms at a spectral resolution of 2 cm−1. For this experiment, polyelectrolytes were dissolved in Tris/NaCl buffer made from D2O (99.9 atom% D, ref. 530867, Sigma-Aldrich). The spectrum of the (PAH-HA)30 film (slightly thinner than the penetration depth of the evanescent wave from the ZnSe crystal into the film) was subtracted from that of the same film obtained after contact with the {P5W30} solution (1.2 × 10⁻⁴ M during 24 h) in order to see if the characteristic bands of the film (amide I, amide II and polysaccharides) did not decrease due to film erosion.
Raman spectroscopy: (PAH-HA)90 films were built up onto 5 × 1 cm2 quartz substrates, then immersed for 24 h or 7 days into {P5W30} solutions at various concentrations (1.2 × 10⁻⁴ M; 1.2 × 10⁻⁵ M; 1.2 × 10⁻⁶ M) and then dried under nitrogen prior to characterization by confocal Raman microspectroscopy. One pristine film without treatment with POM was characterized as a reference. Raman measurements were carried out in air by using a confocal Raman microscope composed of a Raman spectrometer (LabRam HR by Jobin-Yvon Horiba with a 600 lines mm−1 grating) coupled to a microscope (Model BX41, Olympus) with xyz mapping stage via optical fibers. The excitation of Raman scattering was operated with a helium-neon laser at a wavelength of 632.8 nm. The laser beam was focused on the sample by means of a ×100 microscope objective. A confocal pinhole of adjustable diameter placed before the entrance slit was used to reject Raman signal from out-of-focus planes.
The Raman signature of each film was recorded within the range 600–1600 cm−1 at three different locations of the substrate. For these measurements, the confocal pinhole diameter was fixed at 1000 μm, which sets the spatial resolution (optical slice thickness) at about 16 μm, that is thicker than the films, thus allowing to analyze the whole film depth in a single measurement. Raman spectra with good signal-to-noise ratio were recorded with an integration time of 240 s.
We also followed the in-depth distribution of POM within the films at one location of the surface, by recording Raman spectra every 0.1 μm across the film section. For these measurements, the confocal pinhole diameter was fixed at 100 μm, setting the spatial resolution at the lowest accessible value of 1–2 μm.
Scanning electron microscopy: Morphologies of (PAH-HA)90 films put into contact, or not, with a {P5W30} solution (1.2 × 10⁻⁴ M) for 7 days were investigated by SEM using a Quanta FEG 200 ESEM from FEI. For top view imaging of the surface, samples were observed directly without any conductive coating. For cross-section observations, samples were simply broken.
Acknowledgements
The authors acknowledge Cosette Betscha (Inserm U977) for her help in the preparation of polyelectrolyte multilayer films. G.L. and H.A. acknowledge the “Grand Évreux Agglomération“ and the “Conseil Général de l'Eure“, for partial financial support of La2B (Laboratoire de Biophysique et Biomatériaux).References
- J. Berzelius, Poggendorff's Ann. Phys. Chem., 1826, 6, 369–374 Search PubMed.
- M. T. Pope and A. Müller, Angew. Chem., Int. Ed. Engl., 1991, 30, 34–48 CrossRef.
- B. Keita, T. Liu and L. Nadjo, J. Mater. Chem., 2009, 19, 19–33 RSC.
- T. Liu, E. Diemann, H. Li, A. W. M. Dress and A. Müller, Nature, 2003, 246, 59–62 CrossRef.
- T. Liu, J. Am. Chem. Soc., 2002, 124, 10942–10943 CrossRef CAS.
- A. Müller and C. Serain, Acc. Chem. Res., 2000, 33, 2–10 CrossRef.
- L. Hill and C. M. Prosser-McCartha, Coord. Chem. Rev., 1995, 143, 407–455 CrossRef.
- B. Hasenknopf, Front. Biosci., 2005, 10, 275–287 CrossRef CAS.
- X. Wang, J. Liu and M. T. Pope, Dalton Trans., 2003, 957–960 RSC.
- C. L. Hill, M. S. Weeks and R. F. Schinazi, J. Med. Chem., 1990, 33, 2767–2772 CrossRef CAS.
- S. Liu and Z. Tang, Nano Today, 2010, 5, 267–281 CrossRef CAS.
- W. G. Klemperer and C. G. Wall, Chem. Rev., 1998, 98, 297–306 CrossRef CAS.
- M. Clemente-León, C. Mingotaud, B. Agricole, C. J. Gómez-García, E. Coronado and P. Delhaès, Angew. Chem., Int. Ed. Engl., 1997, 36, 1114–1116 CrossRef.
- A. Kuhn and F. C. Anson, Langmuir, 1996, 12, 5481–5488 CrossRef CAS.
- F. Caruso, D. G. Kurth, D. Volkmer, M. J. Koop and A. Muller, Langmuir, 1998, 14, 3462–3465 CrossRef CAS.
- I. Ichinose, H. Tagawa, S. Mizuki, Y. Lvov and T. Kunitake, Langmuir, 1998, 14, 187–192 CrossRef CAS.
- D. G. Kurth, D. Volkmer, M. Ruttorf, B. Richter and A. Müller, Chem. Mater., 2000, 12, 2829–2831 CrossRef CAS.
- S. Liu, D. G. Kurth, B. Brettenkötter and D. Volkmer, J. Am. Chem. Soc., 2002, 124, 12279–12287 CrossRef CAS.
- S. Liu, H. Möhwald, D. Volkmer and D. G. Kurth, Langmuir, 2006, 22, 1949–1951 CrossRef CAS.
- A. M. Douvas, E. Makarona, N. Glezos, P. Argitis, J. A. Mielczarski and E. Mielczarski, ACS Nano, 2008, 2, 733–742 CrossRef CAS.
- K. Karnicka, M. Chojak, K. Miecznikowski, M. Skunik, B. Baranowska, A. Kolary, A. Piranska, B. Palys, L. Adamczyk and P. J. Kulesza, Bioelectrochemistry, 2005, 66, 79–87 CrossRef CAS.
- M. Ammam, B. Keita, L. Nadjo, I.-M. Mbomekalle and J. Fransaer, J. Electroanal. Chem., 2010, 645, 65–73 CrossRef CAS.
- G. Decher, Science, 1997, 277, 1232–1237 CrossRef CAS.
- A. Laschewsky, E. Wischerhoff, E. Denzinger, H. Ringsdorf, A. Delcorte and P. Bertrand, Chem.–Eur. J., 1997, 3, 34–38 CrossRef CAS.
- Y. Shimazaki, R. Nakamura, S. Ito and M. Yamamoto, Langmuir, 2001, 17, 953–956 CrossRef CAS.
- Y. Lvov, K. Ariga, I. Ichinose and T. Kunitake, J. Chem. Soc., Chem. Commun., 1995, 2313–2314 RSC.
- A. Van der Heyden, M. Wilczewski, P. Labbé and R. Auzély, Chem. Commun., 2006, 3220–3222 RSC.
- P. A. Chiarelli, M. S. Johal, D. J. Holmes, J. L. Casson, J. M. Robinson and H. L. P. Wang, Langmuir, 2002, 18, 168–173 CrossRef CAS.
- J. B. Schlenoff, S. T. Dubas and T. Farhat, Langmuir, 2000, 16, 9968–9969 CrossRef CAS.
- B. S. Shim, P. Podsiadlo, D. G. Lilly, A. Agarwal, J. Leet, Z. Tang, S. Ho, P. Ingle, D. Paterson, W. Lu and N. A. Kotov, Nano Lett., 2007, 7, 3266–3273 CrossRef CAS.
- T. R. Farhat and J. B. Schlenoff, Electrochem. Solid-State Lett., 2002, 5, B13–B15 CrossRef CAS.
- E. V. Skorb, D. V. Sviridov, H. Möhwald and D. G. Shchukin, Chem. Commun., 2009, 6041–6043 RSC.
- N. A. Kotov, I. Dekany and J. H. Fendler, J. Phys. Chem., 1995, 99, 13065–13069 CrossRef CAS.
- C. A. Constantine, S. V. Mello, A. Dupont, X. Cao, D. Santos, O. N. Oliveira, F. T. Strixino, E. C. Pereira, T. C. Cheng, J. J. Defrank and R. M. Leblanc, J. Am. Chem. Soc., 2003, 125, 1805–1809 CrossRef CAS.
- S. Srivastava, V. Ball, P. Podsiadlo, J. Lee, P. Ho and N. A. Kotov, J. Am. Chem. Soc., 2008, 130, 3748–3749 CrossRef CAS.
- V. Ball, E. Hubsch, R. Schweiss, J.-C. Voegel, P. Schaaf and W. Knoll, Langmuir, 2005, 21, 8526–8531 CrossRef CAS.
- V. Ball, F. Bernsmann, S. Werner, J.-C. Voegel, L. F. Piedra-Garza and U. Kortz, Eur. J. Inorg. Chem., 2009, 5115–5124 CrossRef CAS.
- W. Göpel, Biosens. Bioelectron., 1995, 10, 35–59 CrossRef.
- S. Srivastava, P. Podsiadlo, K. Critchley, J. Zhu, M. Qin, B. S. Shim and N. A. Kotov, Chem. Mater., 2009, 21, 4397–4400 CrossRef CAS.
- M. H. Alizadeh, S. P. Harmalker, Y. Jeannin, J. Martin-Frère and M. T. Pope, J. Am. Chem. Soc., 1985, 107, 2662–2669 CrossRef CAS.
- I. Langmuir, J. Am. Chem. Soc., 1918, 40, 1361–1403 CrossRef CAS.
- C. Betscha and V. Ball, Soft Matter, 2011, 7, 1819–1829 RSC.
- H. Bysell, P. Hansson and M. Malmsten, J. Phys. Chem. B, 2010, 114, 7207–7215 CrossRef CAS.
- N. J. Everall, Appl. Spectrosc., 2000, 54, 773–782 CrossRef CAS.
- H. Mjahed, J.-C. Voegel, B. Senger, A. Chassepot, A. Rameau, V. Ball, P. Schaaf and F. Boulmedais, Soft Matter, 2009, 5, 2269–2276 RSC.
| This journal is © The Royal Society of Chemistry 2012 |
