Sol–gel TiO2 in self-organization process: growth, ripening and sintering
Hsueh-Shih
Chen
* and
Ramachandran Vasant
Kumar
Department of Materials Science and Metallurgy, University of Cambridge, Pembroke Street, Cambridge, CB2 3QZ, U.K. E-mail: sean.chen@cantab.net
First published on 19th January 2012
Abstract
TiO2 nanoparticles were synthesised by a self-organization method using a continuous water vapour hydrolysis system without mixing. Formation of TiO2 particles was based on pure colloidal interactions of hydrolyzed alkoxide molecules generated at the interface between titanium alkoxide solution and water vapour. The effect of ethanol was proved to increase aggregation and packing of primary particles, leading to a significant size enlargement of secondary particles in a post annealing process above 500 °C. A new model to describe sol–gel TiO2 growth has been proposed, which considers the formation of secondary particles to be the result of nucleation of oversaturated primary particles, while the primary particles are the result of irreversible oligomerization of Ti oxo molecules.
Introduction
The sol–gel process offers many advantages for preparing oxide materials such as low cost, high purity and a wide variety of morphologies. The synthetic process of sol–gel materials in general involves a wet-chemical process to form a precursor sol or gel solution, which can be deposited on a substrate, followed by a post heat treatment to convert the amorphous precursor into crystalline particles or thin films.1 Typical sol–gel processing of TiO2 nanocrystals includes the hydrolysis of titanium alkoxide by water, which can react with alkoxyl groups, generating fully or partially hydrolyzed (OR)4−nTi(OH)n molecules. The (partially) hydrolyzed molecules can react with each other or with other alkoxides or hydroxides, forming an oxo bridge (–O–) between Ti atoms (oxolation) together with an elimination of a water molecule, as shown below. Briefly, the hydrolysis of Ti alkoxides leads to hydroxyl groups, which is able to change Ti(OR)4 to Ti–O–Ti via the condensation (i.e., olation or oxolation process), and produces Ti-oxo-alkoxy or polyoxotitanate molecular clusters, for example, [Ti12O16](OPri)16, [Ti11O13](OPri)18 and Ti16O16(OEt)32.2 The Ti–oxo–alkoxy clusters can further grow to larger denser nanoparticles (NPs) dispersing in a solution (i.e. sol). The sol particles can further associate with each other via collisions after aging for a certain period of time and thus form bigger isolate gel particles, gel network, or porous films depending on experimental conditions.For the hydrolysis of titanium alkoxides, it is known that the amount of water strongly affects the morphology of final products. According to the molar ratio of water to titanium alkoxides (h), the sol–gel processing of TiO2 may be classified into two regimes; low H2O/Ti molar ratio (h < 10) and high H2O/Ti molar ratio (h > 10). At low h values, spherical TiO2 particles with relatively uniform size about 0.5–1 μm are obtained.3 At high h values, large aggregates of TiO2 rapidly precipitate because fast hydrolysis leads to unstable colloids. The aggregates can be separated to nano-sized particles (<100 nm) at moderately elevated temperature by the so-called chemical peptization process using acids such as nitric acid.4
Alcohol is often served as a solvent to slow down the hydrolysis reaction of Ti alkoxides.5 However, effect of alcohols on the morphology and microstructure is still an argument. Park et al. reported that n-propanol acted as a dispersant for TiO2 particles in the thermal hydrolysis of titanium tetrachloride in a mixture of n-propanol and water.6 They found that without any n-propanol TiO2 particles were small and agglomerated. With addition of n-propanol (n-propanol/water = 3), TiO2 particles became uniform in size and discrete. On the other hand, Vorkapic et al. found that alcohols caused the aggregation of TiO2 primary particles, which were synthesised viahydrolysis–condensation of alkoxides at a high h value.7 They found that chemical factors relating to the hydrolysis and the condensation (e.g. temperature, the length of alkoxyl of alkoxide…) affected the primary particle size rather than the final particle size. Also, alcohols had a negative effect on the peptization. The smallest secondary particles (about 20 nm) were obtained without any alcohol modification. Thus, they suggested that formation of TiO2 particles was controlled by the colloidal interactions between primary particles. Moreover, it has been reported that ethanol could cause the amorphization of TiO2 particles.8 Hague et al. prepared TiO2 by hydrolyzing an isopropoxide–ethanol mixture with a large excess of water (h = 165). Before calcination, the samples were found to be the anatase. But the samples became amorphous after they were rinsed twice by ethanol. The authors suggested that this crystalline-to-amorphous transformation was possibly due to the fact that the hydrolysis reaction was slightly reversed by rinse of ethanol.
Although the sol–gel process is widely applied for preparing TiO2, the growth mechanism of the sol–gel TiO2 is thought to be complicated and experimental factors such as alcohol modifiers do not exhibit a similar effect on different synthetic systems. One of the reasons is that hydrolysis–condensation of Ti alkoxide and aggregation of monomers may occur simultaneously for a certain period, which leads to different morphologies and sizes of TiO2 particles, and therefore affects the crystal growth of TiO2 in the post annealing process. Some growth models have been proposed to describe the growth of sol–gel TiO2. A general growth mechanism is that TiO2 primary particles generate from the nucleation of supersaturated monomers, which are produced by the hydrolysis of Ti alkoxides in the induction period.3 The TiO2 primary particles can continue the growthvia additions of monomers and aggregation. This model assumes that monomers can accumulate and form embryos in a reversible process before they form stable nuclei when the critical concentration is reached. On the other hand, the growth mode of TiO2 particles is affected by the amount of water. For example, Oskam et al. obtained nanocrystalline TiO2 NPs from the hydrolysis of Ti alkoxide at a high water/Ti ratio, followed by peptization at 85 °C.9 The average radius of primary particles increased linearly with time, which was consistent with the predication made by the Lifshitz–Slyozov–Wagner (LSW) theory. They observed secondary particles formed by epitaxial self-assembly of the primary particles with a size range 1.5–8 nm.
In this report, we synthesised TiO2 by employing a water vapour hydrolysis system, in order to investigate the growth of sol–gel TiO2 NPs and the influence of the initial processing parameters such as alcohol on the morphology and microstructure of TiO2 in the sintering process. In this design, no mixing is applied and the complexity of growth modes is simplified. The hydrolysis is caused by condensed water from vapour occuring at the interface between the alkoxide and water vapour phase, which has very low water/alkoxide ratio (∼ 1/700 for one second vapour input). The sol particles form at the interface region and self-organise to gel particles via pure colloidal interactions. This design allows us to examine pure interactions between sol–gel particles excluding the effect of external mixing. Instead of considering that primary particles are from the nucleation of hydrolyzed monomers, a plausible model considering that TiO2 secondary particles are from the nucleation of primary particles, which are from irreversible coalescence of monomers, is attempted to qualitatively describe to the growth of sol–gel TiO2.
Experimental
Materials
Titanium(IV) tetra-isopropoxide (TTIP, 97%) and absolute ethanol (analytical reagent grade) were purchased form Aldrich. All reagents were used without any further purification. Doubly distilled water was used to initiate the hydrolysis and the condensation process.Synthesis of TiO2 by general approach
5 ml absolute ethanol was first used to modify TTIP (5 ml) using magnetic stirring for 20 min in an argon atmosphere. Then, 5 ml doubly distilled water was slowly added into the mixture of ethanol and TTIP at room temperature to form a sol solution. The molar ratio of water/TTIP is 15.4. Gel solution was obtained by aging the sol for 18 h at room temperature. Annealing process was carried out at 150 °C for 1 h, followed by 600 °C for 2 h with a heating rate of 5 °C min−1. White crystalline TiO2 powder were obtained after the annealing process.Synthesis of TiO2 by vapour hydrolysis
An experimental system deigned to synthesise TiO2via slow hydrolysis of TTIP by water vapour is shown in Fig. 1(a). The water vapour was generated by heating water at 70 °C (reservoir A) and carried by argon (99.9%) into reservoir B containing TTIP kept at room temperature. The input rate of water vapour was controlled by the flow rate of argon. The amount of water input was estimated by the weight of water accumulated in the reservoir C. Plastic pipes connecting each reservoir were wrapped with aluminium foils to prevent water vapour from condensation. In order to exclude the effects of stirring on the formation and aggregation of particles, no stirring was applied to the system throughout the process. As the TTIP was kept at room temperature, the water vapour was expected to condense to liquid as it contacted the TTIP surface. Thus, the hydrolysis and the condensation would occur at the near surface region of the TTIP. A typical input rate of water vapour was set at 5.21 × 10⁻⁶ mol s−1. The molar ratio of water/TTIP was about 1/700 for the vapour input lasting a second. The overall input time (aging time) was eight hours. A white precipitate eventually formed at the bottom of the reservoir. The product was then milled to a powder for subsequent characterisation. Pure TTIP and alcohol-modified TTIP were used as precursors. For investigating the structure and morphology of samples in the annealing process, pure TTIP or an ethanol–TTIP mixture (volume ratio = 0.1/1) was used. The overall reaction time was 8 h. Samples were placed into a furnace and taken out at a desired temperature, as shown in Fig. 1(b).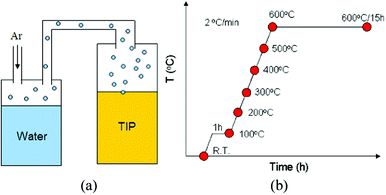 | ||
| Fig. 1 (a) Experimental design of vapour hydrolysis. (b) Evolution of the microstructure and the morphology of samples in the annealing process. Red dots indicate that samples were taken out from a furnace at 100, 200, 300, 400, 500, 600, and 600 °C (15 h). | ||
Characterisation
The surface morphology of TiO2 was investigated by field emission gun scanning electron microscopy (SEM). The average size of particles was estimated according to SEM images for more than 130 particles using computer software (ImageJ). Powder X-ray diffraction (XRD) was employed to study the crystallography of samples. The crystallite size of TiO2 is estimated by FWHM according to Scherrer's formula, D = (0.9 λ)/(β1/2 cosθB), where D is the average grain size, λ is the wavelength of Cu Kα (= 1.5405 Å), β1/2 is the FWHM (full width at half maximum), and θB is the diffraction angle.Results and discussion
TiO2 synthesised by general approach
As-prepared TiO2 sol was a white suspension. After aging, larger white gel particles formed at the bottom of the vessel if no stirring was applied. Dried TiO2 gel samples have no crystallinity, showing that highly crystalline TiO2 would not form at room temperature without heat treatment, as shown in the XRD data in Fig. 2 (curve a). The TiO2 crystalline phase is generated after a heat treatment is carried out, shown in Fig. 2 (curve b). The XRD data indicate that annealed TiO2 powders have an anatase phase with average grain size of 30.1 nm. It also shows that a small amount of anatase TiO2 transforms into the rutile phase. SEM images (Fig. 3(a)) show that the morphology of TiO2 particles is oval-shaped and coalesced and has a mean size about 1.02 μm ± 36%. A high magnification image in Fig. 3(b) shows that the TiO2 is made up of secondary particles composed of primary nanoparticles with diameters of 33.2 nm ± 25%. Note that the primary particle size is close to the average grain size estimated from the XRD data, inferring the majority of the primary particles are nearly single crystalline. The above SEM and XRD results suggest that amorphous primary particles first generate in the sol–gel process and then aggregate into secondary particles. Since there is no existence of TiO2 crystalline phases before the annealing process, the formation of the primary particles in this case may not be mixed with the conventional nucleation-growth process of crystalline materials.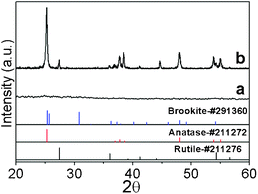 | ||
| Fig. 2 XRD of TiO2 synthesised by a standard sol–gel method (volume ratio TTIP/ethanol/water = 1/1/1). As-prepared sample (curves a) and sample annealed at 600 °C for 2 h (curve b). | ||
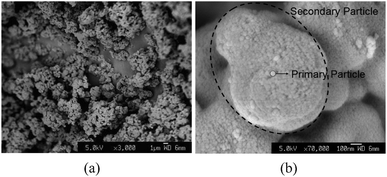 | ||
Fig. 3
SEM images of TiO2 particles synthesised by a normal sol–gel method (volume ratio TTIP/ethanol/water = 1/1/1) at pH = 7. (a) 3000×. (b) 70![[thin space (1/6-em)]](https://www.rsc.org/images/entities/char_2009.gif) 000×. 000×. | ||
The growth of TiO2 from the general sol–gel process is schematically shown in Fig. 4(a). When water is introduced into the TTIP solution, Ti-oxo (or Ti-oxo-alkoxy) molecular clusters are generated through the hydrolysis–condensation reaction of the alkoxides and form particulate sol particles. The primary particles may be viewed as the coalesced Ti–oxo molecular clusters generated from hydrolyzed Ti alkoxides. Thus, the size of the primary particle should be dependent on the hydrolysis–condensation and chemistry of the solution. For the secondary particles, their average size is related to the dimension of the gel particles that is determined by the interaction between colloidal particles.7
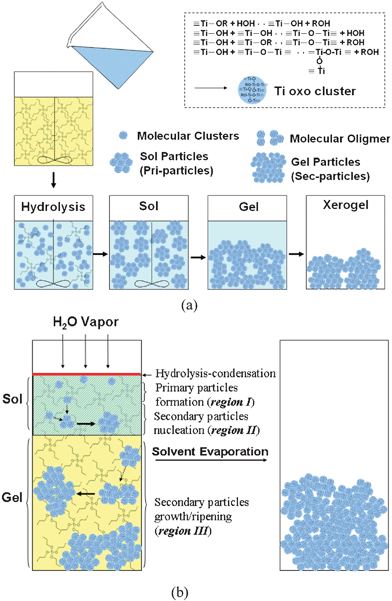 | ||
| Fig. 4 (a) Normal sol–gel process of TiO2 particles. (b) TiO2 prepared by sol–gel process in the vapour hydrolysis design. | ||
TiO2 powders synthesised from the ordinary sol–gel process at room temperature generally show a broad amorphous XRD peak, which is actually contributed by numerous diffraction data from Ti-oxo molecular clusters and domains in a microscopic viewpoint. The Ti-oxo molecular clusters randomly connect with each other and could not form periodic structures in a fast hydrolysis–condenstation process. In some cases, crystalline materials may be obtained by standing a solution of Ti–oxo molecular clusters having a well-defined structure at room or elevated temperature for a longer time (e.g., couple of days). In that case, stable Ti-oxo molecular clusters act as building blocks being able to periodically assemble in a slow assembly process. So the crystalline phase could be recorded by single crystal XRD.2c,2d
TiO2 synthesised by vapour hydrolysis
Fig. 5 gives SEM images of a TiO2 sample prepared by hydrolyzing pure TTIP in the vapour hydrolysis design. The sample dried at room temperature contains secondary particles, which are composed of primary particles. This result is similar to those samples prepared by the standard sol–gel method. In the experimental design of the vapour hydrolysis system, water vapour is continuously transported into a vessel containing TTIP. The vapour is condensed into liquid H2O at the interface between the atmosphere and the TTIP surface. For a rate of 5.21 × 10⁻⁶ mol s−1, the molar ratio of water/TTIP is about 1/700 for a second of the water vapour input. The water would not largely accumulate since reaction between water and TTIP is very fast. The characteristic time of the hydrolysis–condensation of TTIP precursor reported is in the range of tens of milliseconds.10,11 So it is expected that reaction between water and TTIP mainly occurs at the interface region, where Ti-oxo-alkoxy molecular clusters generate and migrate into the solution due to the Brownian interaction and gravity, as shown in region I Fig. 4(b). The generated Ti-oxo-alkoxy clusters would only contain single or few Ti atoms due to a limited water input. Some stable clusters TinOm(OiPr)4n-2m-l(OH)l, with n = 3, 11, 12, and 17, have been found in the solutions containing TTTIP at low hydrolysis ratio h = [Water]/[Ti] < 1.12 The smallest stable Ti-oxo-alkoxy cluster observed was Ti3-oxo clusters synthesised at h ∼ 0.05.13 Larger Ti-oxo clusters and nanoparticles were obtained at higher h values (> 0.7).10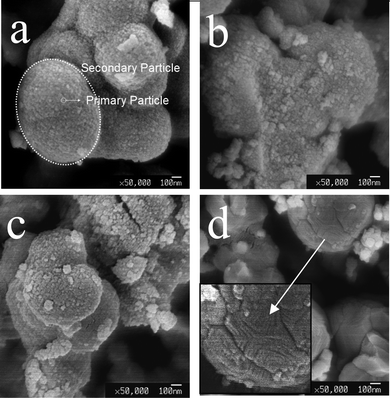 | ||
| Fig. 5 SEM images of TiO2 dried at room temperature (a), 500 °C (b), 600 °C (c), and 600 °C for 15 h (d). Samples were prepared by vapour-hydrolyzing pure TTIP. | ||
In the vapour hydrolysis system, formations of sol and gel particles are based on self-organisation since there is no mixing applied in this system. So the collisions among the particles instead dominate the growth. The Ti-oxo-alkoxy molecular clusters are first generated at the TTIP surface where the hydrolysis and condensation take place. Ti-oxo-alkoxy clusters could grow into larger sol particles via collisions. This event then produces a colloidal solution (i.e. sol process, region I). If the sol particles link to each other, large gel particles are produced and fall down from near the surface region due to gravity. The formation of secondary particles is caused by the aggregation of the primary particles shown in region III in Fig. 4(b). Consequently, the sol and gel particles are assigned to the primary and the secondary particles respectively. In addition, the definition of the term “sol particle” is somewhat confusing since its scale (several to tens of nm) overlaps with those of molecular clusters and of nanoparticles. Basically, sol particles may be viewed as large molecular clusters (e.g., polymers) with denser structures and equivalent to nanoparticles with either amorphous or crystalline structures. Gel particles may be viewed as larger coalesced sol particles in the micron scale.
Evolution of the morphology of TiO2 obtained by annealing samples at various temperatures is given in SEM images in Fig. 5. It shows that the TiO2 secondary particles have irregular shapes and no significant change in the morphology takes place below 500 °C. For samples annealed at 600 °C and 600 °C/15 h, sintering of the particles is observed. The primary particles coalesced and merged, as shown in Fig. 5 (images c and d). XRD data show that there is no crystalline phase for an as-prepared sample whereas the anatase appears at 100 °C (Fig. 6(a)). The anatase is partly transformed into rutile after heating at 600 °C for 15 h. The final product is a mixture of anatase and rutile, as shown in Fig. 6(a). Variations of the crystallite size, the primary particles, and the secondary particles, estimated from XRD data and SEM images, are presented in Fig. 7 The as-prepared primary and secondary particles at room temperature are 14 nm ± 14% and 1.3 μm ± 28% respectively. The size does not significantly change for samples annealed at temperatures below 500 °C. The stability of the particles’ size below 500 °C is understandable; there is no significant sintering of TiO2 particles below 500 °C observed (melting point of TiO2 ∼ 1840 °C) so they are able to keep their original size. But at 600 °C the primary and the secondary particles readily enlarge since the sintering causes grain growth. A slight decrease in size at 100 °C is ascribed to the removal of organic compounds that lead to some shrinkage and/or cleavage of the large particles.
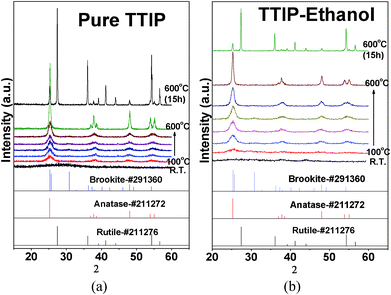 | ||
| Fig. 6 XRD of TiO2 annealed at temperatures from room temperature (R.T.) to 600 °C and 600 °C for 15 h. Samples were prepared by vapour-hydrolyzing pure TTIP (a) and ethanol–TTIP mixture (b). | ||
The grain size of TiO2, on the other hand, does not correspond to the size of the primary particles. Initially the grain size is 4.5 nm and increases to 7.5 nm at 500 °C. Note that 7.5 nm is still smaller than the diameter of the primary particles. The grain enlargement may be caused by the crystallisation in the primary particles and/or sintering between the particles. In the present case, the grain growth below 500 °C would be caused by the crystallisation in the primary particles rather than the sintering between the particles because the crystallisation of TiO2 is able to take place below 500 °C, while the sintering requires a higher temperature to overcome the inter-particle diffusion barrier. The sintering event could be observed when the temperature is equal to 600 °C, as shown in Fig. 7. Both of the primary particles and the secondary particles enlarge, indicating inter-particle grain growthvia necking occurs. Moreover, the grain size is nearly the same as the primary particle size, indicating that the primary particles are nearly single crystalline at 600 °C. A further heat treatment (600 °C for 15 h) for grain growth or coarsening occurs via the sintering process between the primary particles, as shown in Fig. 5(d). The primary particles disappear and larger grains appear on the TiO2 secondary particles when heated at 600 °C for 15 h. It is noted that the sintering mainly occurs among primary particles, which transform to a certain layered growth mode. The necking between the secondary particles is hardly seen in the present study. Based on the above results, crystal growth of TiO2 in the heat treatment process may be illustrated in Fig. 8. TiO2 crystallites nucleate in the matrix of the primary particles and further develop to larger grains with increasing temperature. When the annealing temperature is high enough, the primary particles become single crystalline. Further grain growth can continue via inter-particle coalescence caused by sintering of primary particles.
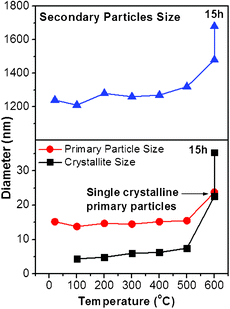 | ||
| Fig. 7 Size variations of TiO2 primary particles, secondary particles, and crystallites prepared by vapour-hydrolyzing pure TTIP. | ||
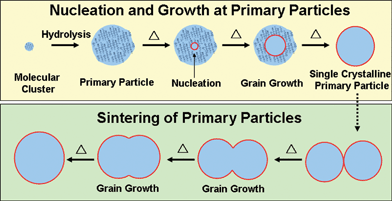 | ||
| Fig. 8 Nucleation and growth of TiO2 in the sol–gel process. | ||
Influence of ethanol on the morphology of TiO2
Although alcohols, e.g.ethanol, have been widely used to dilute TTIP for reducing the hydrolysis rate, however, alcohols affect the solution chemistry and thus alter the self-organisation process of TiO2 particles. For the addition of ethanol to TTIP solution, a certain degree of the substitution for propoxy groups by ethoxy ones is expected. The substitution is reversible. For partially hydrolyzed polyoxotitanates, e.g.[Ti11O13](OPri)18, [Ti11O13](OPri)13(OEt)5 could exist after reacting with ethanol.2 On the other hand, it has been shown that alcohols destabilise the colloidal solution and enhance the rate of re-aggregation because alcohols decrease the dielectric constant of the solvent that correlates with the zeta potential of TiO2.6,14 The degree of aggregation of the primary particles was found to increases with lengthening alkyl chain of alcohols when the TiO2 powders are re-dispersed in various alcohols, for example, the degree of aggregation: propanol > ethanol > methanol.The effect of ethanol on the particle morphology in the vapour hydrolysis system can be clearly examined. As shown in SEM images in Fig. 9, the morphology of TiO2 particles is largely changed by introducing ethanol to modify TTIP. Increasing the volume ratio of ethanol (TTIP : ethanol from 5![[thin space (1/6-em)]](https://www.rsc.org/images/entities/char_2009.gif) :
:![[thin space (1/6-em)]](https://www.rsc.org/images/entities/char_2009.gif) 0 to 5
0 to 5![[thin space (1/6-em)]](https://www.rsc.org/images/entities/char_2009.gif) :
:![[thin space (1/6-em)]](https://www.rsc.org/images/entities/char_2009.gif) 7) results in a denser packing for TiO2 secondary particles, implying that ethanol is beneficial to the coalescence of the primary particles. The secondary particles tend to be spherical in the presence of ethanol. The ethanol increases the “surface tension” of the secondary particles (if treating the primary particles as atoms), and causes a reduction of the surface area of the secondary particles. This inward force could be correlated to the inter-particle interaction for the primary particles, which pull inwards the secondary particles. The inter-particle interaction may be related to the surface functional groups (e.g.hydroxyl groups) and the zeta potential of TiO2 particles. Another possibility is that ethanol stabilized the TTIP so that the generation of the monomers and the primary particles are so slow that the stacking of the particles is improved, which leads to a dense structure.
7) results in a denser packing for TiO2 secondary particles, implying that ethanol is beneficial to the coalescence of the primary particles. The secondary particles tend to be spherical in the presence of ethanol. The ethanol increases the “surface tension” of the secondary particles (if treating the primary particles as atoms), and causes a reduction of the surface area of the secondary particles. This inward force could be correlated to the inter-particle interaction for the primary particles, which pull inwards the secondary particles. The inter-particle interaction may be related to the surface functional groups (e.g.hydroxyl groups) and the zeta potential of TiO2 particles. Another possibility is that ethanol stabilized the TTIP so that the generation of the monomers and the primary particles are so slow that the stacking of the particles is improved, which leads to a dense structure.
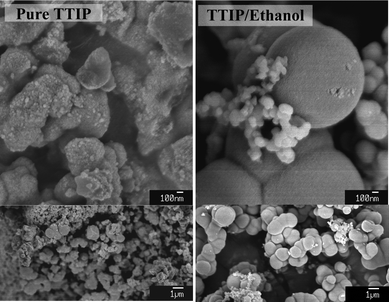 | ||
| Fig. 9 SEM images of TiO2 particles synthesised by pure TIP and ethanol–TTIP (volume ratio = 5/7). The samples were annealed at 150 °C for an hour, followed by 400 °C for another hour with a heating rate of 10 °C min−1. | ||
The evolution of the crystallinity and morphology of the TiO2 crystallite, the primary particles, and the secondary particles from the hydrolysis of the ethanol-modified TTIP with respect to annealing temperature are shown by XRD (Fig. 6(b)) and in SEM images (Fig. 10). Variations of size of the primary particles and the crystallites are shown in Fig. 11(a). The change in size of the secondary particles is shown in Fig. 11(b). As-prepared TiO2 from ethanol–modified TTIP is amorphous (curve R.T. in Fig. 6(b)). The TiO2 crystallites form at 100 °C and have a size of about 2.6 nm, which is much smaller than those from pure TTIP (about 4.5 nm), as shown in Fig. 11(a). This result shows that the ethanol has a negative effect on the crystallisation of TiO2 in the heating process. The ethanol molecules could offer coordinative and hydrogen bonding to the anatase TiO2 surface.15 This ethanol coordination to Ti would offer a chemical stabilising effect on embryos and/or crystallites that delay the crystallisation and crystal growth and thus the crystallite size reduces. We have found that alcohols with longer alkyl groups significantly suppressed the crystallization of TiO2 (results will be published elsewhere).
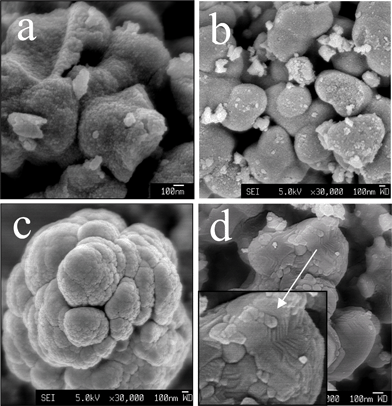 | ||
| Fig. 10 SEM images of TiO2 synthesised by vapour-hydrolyzing ethanol–TTIP mixture (TTIP/ethanol = 1/0.1) annealed at room temperature (a), 500 °C (b), 600 °C (c), and 600 °C for 15 h (d). | ||
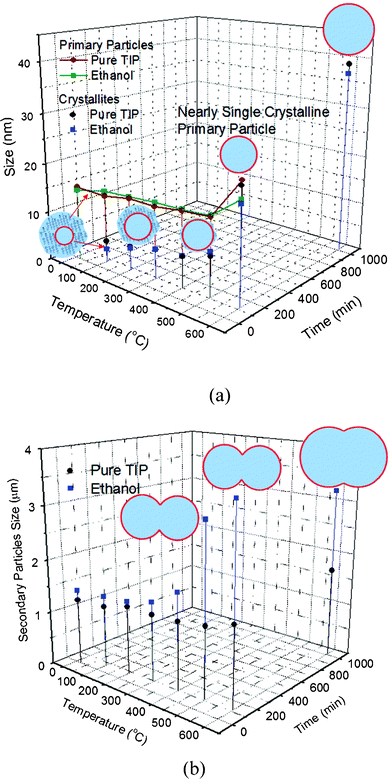 | ||
| Fig. 11 Evolution of sizes of the TiO2 crystallite, primary particle, and secondary particle in the annealing process. (a) Variations of the crystallite size and the primary particle size. (b) Variation of the secondary particle size. | ||
The crystallite enlarges with increasing temperature from 2.6, 4.6, 6.0, 6.4, and 9.0 nm for samples annealed at 100, 200, 300, 400, and 500 °C, respectively, compared with those prepared without ethanol (4.4, 4.8, 6.0, 6.3, and 8.1 nm for 100, 200, 300, 400, and 500 °C respectively), implying that the ethanol effect is reduced at around 200 °C. For the primary particles prepared from ethanol-modified TTIP, similar to those from pure TTIP, they become nearly single crystalline at around 600 °C and enlarge readily after dwelling for 15 h. For the secondary particles, their average size has no significant change at lower annealing temperatures (100–500 °C), but largely increases as the annealing temperature is above 500 °C. This event is similar to those from pure TTIP; size of the secondary particles increases due to the sintering of the primary particle. As the secondary particles from ethanol-stabilised TTIP have densely packed primary particles, the densification is more feasible and thus the secondary particles enlarge faster than those from pure TTIP.
Growth model of TiO2 secondary nanoparticles
The general growth model of sol–gel TiO2 considers that primary particles are the result of nucleation of supersaturated hydrolyzed monomers from hydrolysis of Ti alkoxides. In the induction period, monomers (e.g., Ti-oxo-alkoxy) generate due to the hydrolysis of alkoxides that increases the monomer concentration.16 When the monomer concentration reaches a critical level, nucleation occurs. The induction time is defined by the visual turbidity of reaction liquid and reflects the rate at which critical supersaturation is achieved.3 However, it was found that nanoparticles already generate and grow during the induction period in a dynamic light scattering study.17 So the induction time may not precisely reflect the formation of particles in the nanoscopic scale. On the other hand, accumulation of monomers in the induction period is not considered in some studies. As the Ti-O-Ti oxo bonds are very strong and condensation of hydrolyzed clusters is irreversible, Ti-oxo clusters enlarge through the reactions or additions with other Ti-oxo clusters.18 In the present case, Ti-oxo-alkoxy clusters generated at the TTIP surface are thought to connect with each other via the condensation reaction between metal–OH groups and/or metal–OR groups. The coalescence of Ti-oxo-alkoxy clusters towards denser/bigger primary particles is considered an irreversible process. Then, the primary particles drop down to the lower pure TTIP area due to their increasing weight. The surface of the primary particles could be deactivated because the hydroxyl groups on the primary particles could be converted to non-reactive alkyl chains by reacting with TTIP molecules. In this pure TTIP region, there is no external water molecules provided so the irreversible condensation between the primary particles surfaces could be effectively suppressed. Instead, the reversible coalescence process becomes dominant in the aggregation of the primary particles. The stability of coalesced primary particles is determined by the Gibbs–Thompson relationship, Cr = C0exp[(2γv)/(rkT)]. As there is no stirring in the present system, the primary particles randomly collide with each other in the solution due to Brownian motion and can result in a local concentration fluctuation. In this situation, some primary particles could coalesce to a meta-stable particle aggregate, which could either grow larger (forward process), or dissociate into individual primary particles (inverse process). Therefore, the aggregate of the primary particles would have the critical size at which the aggregate is stable. The process is somewhat like the conventional homogeneous nucleation process of crystals, where the number of the nuclei containing n monomers is given by the Boltzmann's distribution, Nn = N(n)exp[−ΔGn/(kT)], where N(n) is a function of n, k is Boltzmann's coefficient, T is temperature, and ΔGn is the activation energy, which is a function of the surface energy and the volume free energy. If the number of monomers (n) is much more than embryos, N(n) can be assumed a constant (N0), Nn = N0 exp[−ΔGn/(kT)]. The Volmer–Weber theory predicts the nucleation rate of oversaturated vapour condensing to liquid.19 The nucleation rate is proportional to number of the embryos at the critical size and the condensation rate. The condensation rate of vapour is proportional to the surface area of an embryo (Ac) and the probability of a vapour atom liquidized on the embryo per unit area and time (P). I = AcPNn = AcPN0 exp[−ΔGn/(kT)]. The Volmer–Weber theory assumes the process to be a quasi-steady state where the atoms are constantly introduced to the condensation system. The model also assumes that once the nuclei forms the particle will continue to enlarge. The predication made by the theory has been found to be consistent with the experimental results if the atoms are much more than the nuclei. According to the theory, the nucleation rate increases with increasing concentration of the vapour atoms. In a colloidal system, the monomer concentration strongly determines the nucleation and growth. Higher monomer concentration allows generation of the smaller nuclei generated according to the Gibbs–Thompson relationship. Variation of monomer concentration also affects the size and size distribution of crystals.20 Higher monomer concentration prevents smaller particles from dissolution in the solution and diminishes the size broadening process (i.e.Ostwald ripening).Fig. 12 shows that the secondary particle size decreases with increasing vapour input rate. The average sizes of the secondary particles are 0.83 μm and 0.42 μm for vapour rates of 3.47 × 10⁻⁶, and 8.68 × 10⁻⁶ mol s−1, respectively. The particle size distribution of the samples also decreases from 73.9 to 42.3% with increasing vapour input rate. Considering the smallest stable aggregate of the primary particles to be the “nuclei” of the secondary particles, the concentration of the primary particles can alter the size of the secondary particles according the above model. In the water vapour hydrolysis system, the vapour input leads to the hydrolysis of TTIP at the interface that continuously supplies the hydrolyzed molecules and the primary particles into the TTIP solution, where the quasi-steady state is able to establish if the generation and consumption of the primary particles reach a dynamic equilibrium situation. This process resembles the model of crystallisation. The addition of the primary particles onto the secondary particles may be based on the reductions of the surface energy of the secondary particles. The secondary particle size therefore decreases with increasing the water vapour input rate.
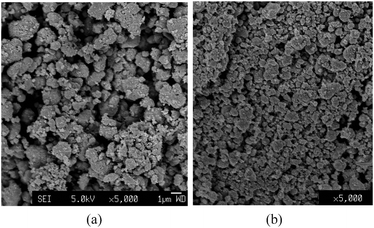 | ||
| Fig. 12 SEM images of TiO2 secondary particles produced by hydrolyzing pure TTIP with vapour input rates of 3.47 × 10⁻⁶ mol s−1 (a) and 8.68 × 10⁻⁶ mol s−1 (b). | ||
Coalescence of secondary particles
Since the generation of the TiO2 secondary particles from the primary particles is similar to the material crystallization process, it is worth to check if there is a process similar to Ostwald ripening occurring in the crystallization process. Fig. 13 shows SEM images of the secondary particles (vapour rate = 5.21 × 10⁻⁶ mol s−1, TTIP/ethanol = 5/1) dried at 400 °C for 1 h, at which no sintering event occurs, proved in the above data. The secondary particles appear to combine with each other (Fig. 13(a)). The junction between the particles clearly shows that the combination is not caused by the sintering (necking) between the secondary particles (Fig. 13(b)) and appears to be the coalescence of the secondary particles. The coalescence would not be caused by the evaporation of solvents in the separation process of products because the products formed in the system were a solid precipitate in the bottom of the reaction vessel rather than a colloidal solution. Presumably, the combination of the secondary particles is caused by the coalescence between secondary particles in the solution. This event is similar to Ostwald ripening based on the difference in the solubility of larger and smaller crystals. The driving force of combination of the secondary particles in the present system would be relating to the surface functional groups and the zeta-potential of the secondary particles, which is under investigation.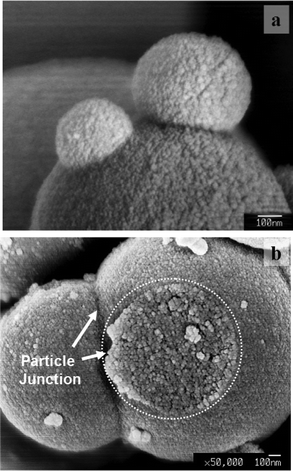 | ||
| Fig. 13 Association of the secondary particles (Ostwald ripening) before the coarsening of grains takes place. (a) A secondary particle merged with two other smaller secondary particles. (b) The cross section of the junction of a merged secondary particle. | ||
Conclusion
TiO2 was prepared in a self-organization process with an ultraslow hydrolysis rate via a vapour hydrolysis system without mixing and in a normal sol–gel process for reference. Experimental results from both methods suggest that sol–gel TiO2 were secondary particles composed of primary particles, which were amorphous before an annealing process was performed. The crystalline anatase primary particles were generated at 100 °C and became single crystalline at around 600 °C. The ethanol effect on sol–gel TiO2 was proved to aid aggregation and packing of TiO2 primary particles. This phenomenon leads to a size enlargement of the secondary particles when the post annealing temperature is above 500 °C. A plausible model considering that TiO2 secondary particles are the result of the nucleation of the primary particles is attempted to qualitatively describe to the growth of sol–gel TiO2. Experimental results show that the secondary particles size reduces with increasing vapour input rate, which is consistent with the prediction of the growth model.References
- P. Periyat, F. Laffir, S. A. M. Tofail and E. Magner, RSC Adv., 2011, 1, 1794 RSC
.
-
(a) V. W. Day, T. A. Eberspacher, W. G. Klemperer and C. W. Park, J. Am. Chem. Soc., 1993, 115, 8469 CrossRef CAS
; (b) G. Fornasieri, L. Rozes, S. L. Calve, B. Alonso, D. Massiot, M. N. Rager, M. Evain, K. Boubekeur and C. Sanchez, J. Am. Chem. Soc., 2005, 127, 4869 CrossRef CAS
; (c) A. Senouci, M. Yaakoub, C. Huguenard and M. Henry, J. Mater. Chem., 2004, 14, 3215 RSC
; (d) J. V. Barkley, J. C. Cannadine, I. Hannaford, M. M. Harding, A. Steiner, J. Tallon and R. Whyman, Chem. Commun., 1997, 1653 RSC
.
-
(a) E. A. Barringer and H. K. Bowen, Langmuir, 1985, 1, 414 CrossRef CAS
; (b) E. A. Barringer and H. K. Bowen, Langmuir, 1985, 1, 420 CrossRef CAS
; (c) J. H. Jean and T. A. Ring, Langmuir, 1986, 2, 251 CrossRef CAS
; (d) J. L. Look and C. F. Zukoski, J. Am. Ceram. Soc., 1992, 75, 1587 CrossRef CAS
; (e) J. L. Look and C. F. Zukoski, J. Am. Ceram. Soc., 1995, 78, 21 CrossRef CAS
.
- Q. Xu, M. J. Gieselmann and M. A. Anderson, Polym. Mater. Sci. Eng., 1989, 61, 889 CAS
.
-
(a) H. S. Chen, R. V. Kumar and B. A. Glowacki, Mater. Chem. Phys., 2010, 122, 305 CrossRef CAS
; (b) H. S. Chen, R. V. Kumar and B. A. Glowacki, J. Sol-Gel Sci. Technol., 2009, 51, 102 CrossRef CAS
.
- H. K. Park, D. K. Kim and C. H. Kim, J. Am. Ceram. Soc., 1997, 80, 743 CrossRef CAS
.
- D. Vorkapic and T. Matsoukas, J. Am. Ceram. Soc., 1998, 81, 2815 CrossRef CAS
.
- D. C. Hague and M. J. Mayo, Nanostruct. Mater., 1993, 3, 61 CrossRef CAS
.
- G. Oskam, Z. Hu, R. L. Penn, N. Pesika and P. C. Searson, Phys. Rev. E, 2002, 66, 011403 CrossRef
.
- R. Azouani, A. Soloviev, M. Benmami, K. Chhor, J. F. Bocquet and A. Kanaev, J. Phys. Chem. C, 2007, 111, 16243 CAS
.
- J. Livage, M. Henry and C. Sanchez, Prog. Solid State Chem., 1988, 18, 259 CrossRef CAS
.
-
(a) L. Rozes, N. Steunou, G. Fornasieri and C. Sanchez, Monatsh. Chem., 2006, 137, 501 CrossRef CAS
; (b) L. Rozes and C. Sanchez, Chem. Soc. Rev., 2011, 40, 1006 RSC
.
- J. Blanchard, F. Ribot, C. Sanchez, P. Bellot and A. Trokiner, J. Non-Cryst. Solids, 2000, 265, 83 CrossRef CAS
.
- Y. T. Moon, H. K. Park, D. K. Kim and C. H. Kim, J. Am. Ceram. Soc., 1995, 78, 2690 CrossRef CAS
.
-
(a) M. L. Shepotko and A. A. Davydov, Theor. Exp. Chem., 1991, 27, 210 CrossRef
; (b) S. Pilkenton, S. J. Hwang and D. Raftery, J. Phys. Chem. B, 1999, 103, 11152 CrossRef CAS
.
- S. Tieng, R. Azouani, K. Chhor and A. Kanaev, J. Phys. Chem.
C, 2011, 115, 5244 CAS
.
- A. Soloviev, D. Ivanov, R. Tufeu and A. V. Kanaev, J. Mater. Sci. Lett., 2001, 20, 905 CrossRef CAS
.
- M. Kallala, C. Sanchez and B. Cabane, Phys. Rev. E, 1993, 48, 3642 CrossRef
.
- M. Volmer and A. Z. Weber, Phys. Chem., 1926, 119, 227 Search PubMed
.
-
(a) X. Peng, J. Wickham and A. P. Alivisatos, J. Am. Chem. Soc., 1998, 120, 10937 CrossRef
; (b) Y. Chen, E. Johnson and X. Peng, J. Am. Chem. Soc., 2007, 129, 10937 CrossRef CAS
; (c) H. S. Chen and R. V. Kumar, Cryst. Growth Des., 2009, 9, 5343 CrossRef
; (d) H. S. Chen and R. V. Kumar, J. Phys. Chem. C, 2009, 113, 31 CrossRef CAS
; (e) H. S. Chen and R. V. Kumar, J. Phys. Chem. C, 2009, 113, 12236 CrossRef CAS
.
| This journal is © The Royal Society of Chemistry 2012 |
