Synthesis and visible light photoactivity of anatase Ag and garlic loaded TiO2 nanocrystalline catalyst†
Jurate
Virkutyte
*a and
Rajender S.
Varma
*b
aPegasus Technical Services Inc., 46 E Hollister Street, Cincinnati, OH 45221, USA. E-mail: virkutyte.jurate@epa.gov; Tel: +5135697964
bSustainable Technology Division, National Risk Management Research Laboratory, Environmental Protection Agency, 36 West M. L. K. Drive, Cincinnati, Ohio 45268, USA. E-mail: Varma.Rajender@epa.gov; Fax: 5135697677; Tel: 5134872701
First published on 1st February 2012
Abstract
An excellent visible light activated Ag and garlic loaded TiO2 nanocatalyst was prepared by using AgNO3 and garlic (Allium sativum) as the Ag+ and sulfur sources, respectively. The catalyst resisted the change from anatase to rutile phase even at high (700 °C) calcination temperature. The photocatalytic efficiency of as-prepared nanocatalysts was evaluated by degrading (100 ppm) azodye, methyl orange (MO), and dichloro phenol (DCP) under visible light irradiation for 3 to 4 h from an incandescent light bulb (300 W). The process followed first order reaction kinetics with reaction rates ranging from 9.5 × 10⁻⁴ to 19.4 × 10⁻³ min−1. The dye was decomposed in 3 h and more than 70% DCP degraded in 4 h in the presence of Ag and garlic loaded–TiO2 calcined at 700 °C. Demineralization of the solution was in the range 40 to 90%. A complete elimination of Vibrio fischeri was accomplished with 1 mg L−1 of nanocatalyst regardless the calcination temperature. The catalyst was used for up to 5 consecutive runs without the significant loss in the photocatalytic activity and could be regenerated by adopting a simple procedure of washing with water and acetone as well as drying at 200 °C for 2 h.
Introduction
Over the years, titanium dioxide (TiO2) has gained increasing attention as a chemically stable, nontoxic and inexpensive as well as an efficient photocatalyst, applicable for a wide array of applications in environmental and biomedical fields, gas sensors, solar cells and electrochromic devices.1–6 However, the main disadvantage that severely limits its wider use is the large band gap (3.2 or 3.0 eV in the anatase and rutile phases, respectively). It requires UV irradiation energy for the electron to be promoted into the conduction band (CB), leaving a hole in the valence band (VB), thus initiating oxidation and reduction processes on the TiO2 surface.5 Its transformation to a mode stable, however less photocatalytically active rutile phase when heated to 500–600 °C is a hindrance on its wider applicability.2,7In the last decade, the scientific community has concentrated efforts in finding ways to narrow the band gap of TiO2 to use abundant solar or visible light range for various chemical transformations and to stabilize anatase TiO2 at elevated temperatures to avoid phase transformation by doping TiO2 with metal/nonmetal dopants.8 Additionally, doping the TiO2 with transition metals such as iron,4,9silver,10–15strontium16 and other metals17–19 resulted in an increased TiO2 light absorption in the visible-light region and applicability of newly fabricated photocatalyst for the degradation of various organic contaminants and partial oxidation of hydrocarbons. Unfortunately, the photoactivity of these catalysts eventually decreases even in the UV region because doped materials are prone to thermal degradation and suffer from an increase in the carrier-recombination centers.20 Furthermore, the activity of transition metal doped TiO2 is still relatively low for practical use.18,21
Alternatively, TiO2 can be doped with nonmetal atoms such as S, N, C and F to enhance its activity.3,5,6,22–24 According to Yang and co-workers, the p-orbitals of these dopants overlap with the valence band O 2p-orbitals, which significantly promote the transport of photo-generated charge carriers to the surface of the TiO2.4
It is of particular importance to investigate the synergetic effects of multiple dopants on the crystallinity, surface area and porosity, thermal stability and surface reactions as well as photocatalytic activity of TiO2 in degradation of pollutants in aqueous solution under visible light irradiation. To the best of our knowledge, the use of organic sulfur compounds from garlic (Allium sativum) such as allicin, ajoene, diallyl sulfides and phenolic compounds25 in combination with silver ions to dope nano-TiO2 to increase its activity in the visible light range has not been researched previously. In this study, simultaneous doping of TiO2 with Allium sativum and silver ions was developed via a facile sol–gel process, using benign and renewable precursors, which showed a significant improvement in the photocatalytic activity compared to the commercially available Degussa P25 catalyst in the visible light range. The effect of calcination temperature on photocatalytic activity was examined. In addition, to investigate the antibacterial properties of as-prepared nanocatalysts, marine water and gram-negative bacterium Vibrio fischeri were subjected to treatment with various nanocatalyst concentrations.
Materials and methods
Materials
Titanium tetraisopropoxide, Ti[OCH(CH3)2]4 (TTIP, Fischer Scientific, USA, 98 +%) and glacial acetic acid, CH3COOH (Fischer Scientific, USA) were used as received for preparing the nanocatalysts. Double distilled water was used for the preparation of all the solutions. Dopants and silver nitrate (AgNO3) were obtained from Fischer Scientific, USA (99%) and freshly crushed garlic cloves were bought from a local grocery shop.Preparation of the catalysts
The typical sol–gel synthesis of loaded-TiO2nanoparticles is as follows: TTIP (7.15 mL), glacial acetic acid (14 mL) and water were used in the molar ratio of 1![[thin space (1/6-em)]](https://www.rsc.org/images/entities/char_2009.gif) :
:![[thin space (1/6-em)]](https://www.rsc.org/images/entities/char_2009.gif) 10:300.16TTIP was mixed with glacial acetic acid in an ice bath and 5 mol% of AgNO3 (stoichiometric amount of silver salt was added to 50 mL of water to obtain the required concentration) with freshly crushed garlic (25 g) dispersed in water was added to the mixture under vigorous stirring. To prepare a sulfur dopant, 3 garlic cloves were dispersed in 25 mL of water and liquefied using a regular blender for 45 s. Bigger garlic chunks were removed and the resulting garlic slurry was further dispersed in 10 mL water and added to the TTIP, glacial acetic acid and AgNO3 mixture. When this mixture turned to a sol, it was stirred for 8 h and aged for 48 h at room temperature to form a gel. Preparation of garlic-doped TiO2 was performed following the exact aforementioned procedure without the addition of silver. The aging results in the substantial structural reorganization of the gel network, which may lead to the change in structure and properties of the materials prepared.26 The gel was then dried in an oven at 70 °C for 12 h and crushed well. The resulting powders were calcined in air at 450 °C and 700 °C for 2 h.
10:300.16TTIP was mixed with glacial acetic acid in an ice bath and 5 mol% of AgNO3 (stoichiometric amount of silver salt was added to 50 mL of water to obtain the required concentration) with freshly crushed garlic (25 g) dispersed in water was added to the mixture under vigorous stirring. To prepare a sulfur dopant, 3 garlic cloves were dispersed in 25 mL of water and liquefied using a regular blender for 45 s. Bigger garlic chunks were removed and the resulting garlic slurry was further dispersed in 10 mL water and added to the TTIP, glacial acetic acid and AgNO3 mixture. When this mixture turned to a sol, it was stirred for 8 h and aged for 48 h at room temperature to form a gel. Preparation of garlic-doped TiO2 was performed following the exact aforementioned procedure without the addition of silver. The aging results in the substantial structural reorganization of the gel network, which may lead to the change in structure and properties of the materials prepared.26 The gel was then dried in an oven at 70 °C for 12 h and crushed well. The resulting powders were calcined in air at 450 °C and 700 °C for 2 h.
Characterization of the catalysts
The X-ray diffraction (XRD) patterns of Ag and garlic loaded TiO2 nanocatalysts were recorded on a X'Pert Pro MPD X-ray diffractometer in the range 2θ = 10–80° with a count time of 20 s at each point using Cu Kα radiation as the X-ray source. The accelerating voltage and applied current were 45 kV and 40 mA, respectively. The crystallite size of samples was calculated by using the Scherrer equation: | (1) |
 | (2) |
The phases were identified with the aid of the Joint Committee on Powder Diffraction Standards (JCPDS). Transmission electron microscopy (TEM) images were recorded using an FEI CM20 TEM operating at an accelerated voltage of 160 keV. The samples were ultrasonically (20 min) dispersed in ethanol and a drop of the suspension was placed onto a lacey carbon coated copper grid. Furthermore, the grid was dried in air prior to the imaging. The morphology of samples was observed using scanning electron microscopy (FEI XL 30 ESEM), operating at 15–20 kV on gold-sputtered samples. The surface area, pore volume and average pore radius measurements were carried out in a Micromeritics Tri–Star single point BET instrument. Prior to the analysis, samples were loaded to sample tubes and degassed at 160 °C and 50 mTorr overnight. X-Ray photoelectron spectroscopy (XPS) was performed using a Surface Science Labs SSX-100 XPS. Prior to the measurements, samples were distributed onto the copper adhesive tape to achieve uniform and complete coverage. The nominal X-ray beam diameter was 600 μm. Since all the samples were non-conductive, the charge neutralization system, which caused peaks to shift to lower binding energy by ∼4–5 eV was adopted. The UV DRS spectra were recorded on a Shimadzu UV-250IPC instrument in the range 300 to 800 nm.
Photocatalytic activity
The typical liquid-phase photocatalytic degradation of methyl orange (MO) and dichloro-phenol (DCP) was performed at room temperature (25 ± 1 °C) in 20 mL quartz photochemical reactor containing 3 g L−1 of catalyst (0.045 g) and 100 ppm of MO and DCP aqueous solutions (Fig. 1).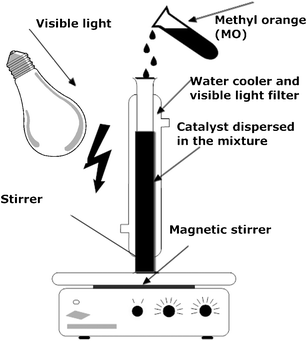 | ||
| Fig. 1 Schematic representation of the experimental set up. | ||
The photocatalytic reactor was equipped with a magnetic stirrer and accommodated in the water cooler for adequate temperature control. All the UV irradiation with wavelengths less than 420 nm was removed by a cutoff glass/water filter. The photocatalytic reactor and the light source were positioned inside the black metal box to prevent the light leakage. To determine the adsorption equilibrium, suspensions were aerated and irradiated in the dark for 3 h with aliquots taken every 15 min and subsequently analyzed for the residual concentration. After 30 min of the reaction with various catalysts, MO and DCP concentrations remained constant, therefore the respective concentrations were adopted as the initial (from 82.4 to 89.3 ppm) and the photocatalytic treatments were initiated. The reaction system was irradiated with a 300 W metal halogen desk lamp located approx. 15 cm away from the solution. Concentrations of MO and DCP in the reaction solution were measured as the function of irradiation time of 4 h unless indicated otherwise. At regular intervals (every 60 min), 3 mL of aliquots was withdrawn from the solution, passed through a 0.45 μm syringe filter and analyzed by a UV spectrophotometer (Hewlett Packard 845X) to determine the MO and DCP degradation efficiencies using earlier established calibration curves. In addition, preliminary tests were carried out without the addition of the catalyst in the presence of the visible light irradiation. Less than 1% of MO and DCP degraded after 4 h of the reaction, and thus could be ignored in comparison to the results obtained in the presence of both, the nanophotocatalyst and the visible light irradiation. The reproducibility of the results was assured by experiments performed in triplicate and was found to be within 5–7%. The rates of MO and DCP degradation were assumed to obey pseudo-first order reaction kinetics and, therefore, the photo-degradation rate constants, k (min−1) were obtained according to the power rate law (please see ESI† for details). Changes in TOC were monitored on a Shimadzu TOC V CPH for Non-Purgeable Organic Carbon analyzer.
Leaching of silver ions from the catalyst
The leaching of silver ions from the as-prepared catalyst was qualitatively tested by adding 5 ml of 1 M NaCl27 solution to the aqueous sample solution either after irradiation for 30 min or in the absence of the visible light, with and without the presence of 3 g L−1catalyst.Vibrio fischeri bioluminescence inhibition test
Inhibition of the bacterial growth was assessed using a Microtox toxicity test (EBPI, Canada) according to ISO standard.28 Briefly, freeze-dried photobacteria, Vibrio fischeri (NRRL B-11177), were rehydrated and stabilized at 4 °C for 1 h and then stabilized at 15 °C for 30 min prior the toxicity measurements. Suspensions with various concentrations of nanocatalyst (0.1–500 mg L−1) were subjected to 30 min ultrasonication and then subsequently stabilized at 15 °C prior to the toxicity measurements. As color and turbidity may reduce the light output recorded by the luminometer similar to toxicity, the bacteria were separated by centrifuging from the sample matrix prior to the final luminescence measurements. To evaluate the inhibition of the bacterial growth when subjected to the treatment with loaded-TiO2, the light output was recorded at t0 and t30. To avoid errors, all the samples were assayed in triplicate. The control test was carried out by recording the light output of the unstressed bacteria after otherwise identical experimental conditions.The light inhibition percentage (INH%) was calculated according to the standard and kinetic methods:
 | (3) |

| (4) |
Results and discussion
XRD analysis
X-Ray diffraction patterns of nano Ag and garlic loaded-TiO2 and commercial Degussa P25 calcined at 450 °C and 700 °C are illustrated in Fig. 2. The mean crystallite sizes calculated using the Sherrer equation and lattice strains of as-prepared nanophotocatalysts are presented in Table 1. At both (450 °C and 700 °C) calcination temperatures, the principal crystalline phase was anatase (tetragonal, a = b = 3.78 Å; c = 9.50 Å) with some minor traces of brookite (rhombohedral, a = 5.43 Å, b = 9.16 Å, c = 5.13 Å) and rutile (tetragonal, a = b = 4.58 Å, c = 2.95 Å)26 phase which started to appear at 700 °C (Fig. 2). The diffraction lines were well-defined and sharp with an increase in calcination temperature.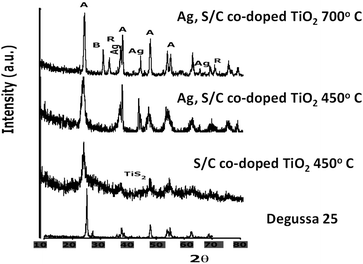 | ||
| Fig. 2 XRD pattern of the as-prepared garlic doped and Ag, garlic loaded TiO2 calcined at 450 °C and 700 °C in comparison to commercially available Degussa P25. | ||
| Dp /nm | ε | MO degradation (%) | Reaction rate/min−1 | |
|---|---|---|---|---|
| Ag, garlic loaded TiO2, 450 °C | 9.6 | 0.47 | 88 | 8.5 × 10⁻³ |
| Ag, garlic loaded TiO2, 700 °C | 14.4 | 0.31 | 98 | 19.4 × 10⁻³ |
| Garlic-doped TiO2, 450 °C | 20.5 | 0.22 | 70 | 1.6 × 10⁻³ |
| Degussa P25 | 21.2 | 0.21 | 12 | 5.3 × 10⁻⁴ |
Moreover, the shape, the intensity and the width of diffractive peaks of the crystal planes of Degussa P25, S-doped TiO2 and Ag, garlic loaded-TiO2 calcined at 450 °C and 700 °C were rather similar. However, the width of the (101) plane in Ag, garlic loaded-TiO2 sample was much broader and less intense in comparison to the rest of the samples indicating a sharp decrease in the crystallite size.
Fig. 3 shows the relationship between the FWHM and the crystallite size of nanocatalysts calcined at 450 °C and 700 °C. Thus, an increase in the intensity and sharpening of the diffraction peak of anatase phase in the Ag, garlic loaded sample calcined at 700 °C may have been caused by the elevated calcination temperature, which forced condensation of free OH groups on the surface of TiO2 nanoparticle.5 Such condensation of OH groups causes the formation of an oxygen vacancy which can be doped with an anion/cation, for instance (S6+, S2−).26 It should be noted the diffraction peak of Ag, garlic loaded-TiO2 calcined at 700 °C shifted to a wider angle (25.21°) in comparison to Degussa P25 sample (25.16°) and Ag, garlic loaded or S–doped nano TiO2 (25.07°). This suggests that some of the Ti4+ ions may be substituted by Ag+ ions at elevated temperatures, which may have caused the distortion of the lattice, which subsequently led to the diffraction peak shift to the wider angle.18,29 Moreover, the crystal lattice may be distorted by incorporating of cationic sulfur species into TiO2 either interstitially or at the lattice sites.23
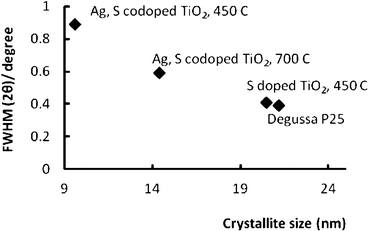 | ||
| Fig. 3 Relationship between FWHM and the crystallite size of as-prepared doped and co-doped nano TiO2 photocatalysts. | ||
According to Periyat and co-workers, a kinetically more stable anatase phase starts transforming to rutile after growing to a crystallite size of more than 14 nm whereas below 14 nm, the anatase phase is the most stable one.26 Thus, S-doped (Dp = 20.5 nm) and Ag, garlic loaded-TiO2 (Dp = 14.4 nm) nanocatalysts, regardless of the calcination temperature, are more prone to the transformation to the rutile phase. The absence of the featured rutile phase at 450 °C and 700 °C revealed that the as-prepared nanocatalysts were stabilized by the dopants. Furthermore, these findings indicate that the dopants play a significant role in the crystallite growth and the stability during the sol–gel process at the selected temperature range.
In the Degussa P25 sample, a trace of rutile phase at 27.4° (110) was observed and was attributed to a “natural” occurrence due to the particular synthesis of the commercial product (75% anatase: 25% rutile phase). The anatase phase showed strong representative peaks at 25°, 37.8° and 48° due to the 101, 004 and 200 planes (JCPDS 21-1272), respectively.30 It is important to indicate that crystallite size increased and lattice strain decreased with an increase in the calcination temperature from 450 °C to 700 °C and with the loading of TiO2 with Ag+ ions (Table 1).
The relatively small Dp may be attributed to the synthesis conditions:3,18,26 (i) a large amount of water was used to increase the nucleophilic attack of water on TTIP to suppress the TTIP species to yield nanocrystals, (ii) acetate anion that is adsorbed on the TiO2 surface may restrain the nanoparticles from further growth and (iii) dopants present that may suppress the growth of the nanocrystals.
Metallic silver particles exhibited strong peaks at 38° (111), 44.6° (200) and 65.7° (220) indicating the Ag attachment to the TiO2 surface.15 In addition, no sulfur phase and only a trace amount of TiS2 was observed in the S-doped TiO2 sample (Fig. 2). Thus, it was assumed that sulfur ions were uniformly dispersed among the anatase crystallite.3,6
Catalyst morphology
Selected SEM images of Ag, garlic loaded-TiO2 calcined at 450 °C and 700 °C are presented in Fig. 4 a and b. The as-prepared nanocatalysts consisted of nearly spherical particles and aggregation took place during the nanoparticle formation process.31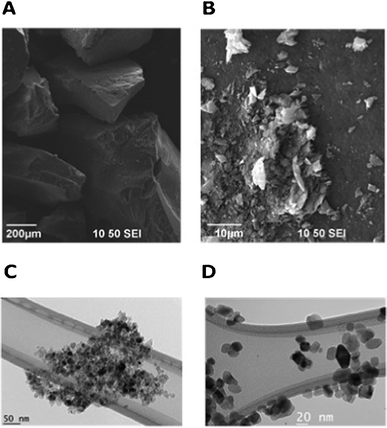 | ||
| Fig. 4 Selected SEM (a) Ag, garlic loaded-TiO2 calcined at 450 °C and (b) Ag, garlic loaded-TiO2 calcined at 700 °C and TEM (c) Ag, garlic loaded-TiO2 calcined at 450 °C, (d) Ag, garlic loaded-TiO2 calcined at 700 °C images of as-prepared catalysts. | ||
Thus, catalyst particles calcined at 450 °C were aggregated into clusters in the range of several hundred nanometres (Fig. 4a). However the increase in calcination temperature improved the dispression and reduced the agglomerate size to tens of nanometres of co-doped TiO2 (Fig. 4b). TEM images of modified TiO2 are presented in Fig. 4 c and d. It was observed that the particle sizes of samples calcined at 450 °C and 700 °C were ranged from 10 to 20 nm, which was consistent with the XRD data.
BET surface area and pore size structure
According to BJH desorption isotherms, garlic doped-TiO2 had a slight microporous structure, whereas Ag, garlic loaded-TiO2catalysts calcined at 450 and 700 °C had a mesoporous structure with average pore sizes of 2.3, 7.2 and 7.5 nm, respectively. Obviously, the calcination temperature had a significant effect on BET surface areas of as-prepared catalysts (Table S1, ESI†). Lower BET surface area at 700 °C may be attributed to the sintering of the smaller particles into the bigger ones.11 However, a rather drastic decrease in the surface area from 170 m2 g−1 (S–TiO2) to 45.9 m2 g−1 (Ag, garlic loaded-TiO2) at the same 450 °C calcination temperature may be due to silver precursor induced sintering of the particles.XPS analysis
X-Ray photoelectron spectroscopy (XPS) was performed to elucidate both the titania structure and the chemical state of silver and sulfur particles. Fig. 5 shows XPS survey spectra of garlic doped-TiO2 (Fig. 5 a) and Ag, garlic loaded-TiO2 (Fig. 5 b) catalyst samples. High resolution XPS spectra of each region may be found in the ESI† (Fig. S1).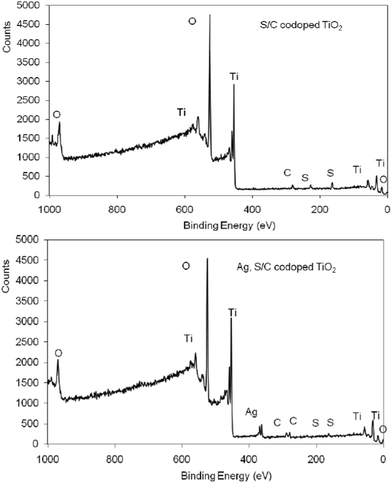 | ||
| Fig. 5 XPS survey spectra of garlic doped-TiO2 and Ag, garlic loaded-TiO2 photocatalysts. | ||
Results of curve fitting of the XPS spectra for the C 1s, O 1s, Ti 2p, Ag 3d and S 2p regions (%) may also be found in the ESI† (Table S2). The C 1s spectrum showed a strong peak at ∼281 eV in both, garlic doped and Ag, garlic loaded-TiO2 samples, whereas a weak shoulder at around 288 eV was only observed in the Ag, garlic loaded TiO2 sample. A peak at ∼281 eV was attributed to a Ti–C bond resulting from substituting oxygen atoms by carbon and peak at around 288 eV was allocated to a negligible amount of carbonate species on the surface.32
There were several S 2p peaks detected, indicating that sulfur was present in different oxidation states on the TiO2 surface. After correcting the shift due to the charge neutralizer, the S 2p peak binding energy values for the garlic doped-TiO2 and Ag, garlic loaded-TiO2 samples were ∼168.5 eV, which was consistent with reported values for S6+ species.33,34 The oxidation state of the S-dopant is highly dependent on the preparation routes and sulfur precursors.35 Therefore, according to the previous studies when organic sulfur compounds were used as precursors, the substitution of Ti4+ by S6+ was determined to be more favorable than replacing O2− with S2−.34,36 The peak observed at 164.2° eV could also be due to the presence of SO3−.37,38 Such findings revealed that doped organic sulfur did not form the oxides on the TiO2 surface. The binding energy of Ti 2p3/2 was observed at ∼458.1° eV and assigned to Ti4+ of TiO2.39 There was a little chemical shift in Ag 3d5/2 peak binding energies as a function of chemical state. The Ag 3d5/2 peak binding energy value after correcting for the charge shift was ∼368 eV, which is consistent with reported values for a large number of silver species/compounds such as Ag0 (368.3° eV), Ag2O (367.6° eV) and AgO (367.05° eV).40
UV-vis diffuse reflectance spectra analysis
Diffuse reflectance spectra of garlic doped-TiO2 and Ag, garlic loaded-TiO2 calcined at 450 and 700 °C are shown in Fig. 6.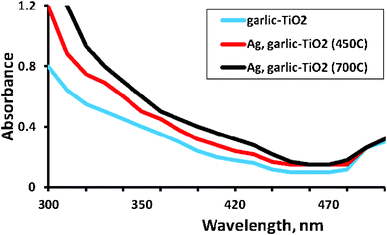 | ||
| Fig. 6 Diffuse reflectance spectra of garlic doped-TiO2 and Ag, garlic loaded-TiO2 calcined at 450 and 700 °C. | ||
Surface plasmon absorbance of Ag particles indicating the deposition of nanoparticles on the surface, was observed at ca. 500 nm, which is consistent with other researches indicating the SPA of Ag at ca. 450–550 nm.41 As can be seen, the absorption edge in the visible region of the solar spectrum was observed in garlic doped-TiO2 and Ag, garlic loaded-TiO2 calcined at 450 and 700 °C indicating that more photons can effectively be exploited by the catalyst excitation.35,42,43 Such absorption indicated that substitution of lattice titanium by S6+ formed a new isolated band above the valence band of TiO2 and subsequently narrowed a band gap.35 Indeed, the band-gap of Degussa P25 was 3.20 eV whereas band-gaps calculated (Eg = 1240/λ) for garlic doped-TiO2 and Ag, garlic loaded-TiO2 calcined at 450 and 700 °C were 2.93, 2.85 and 2.75 eV, respectively. Unfortunately, loading with Ag+ ions had a small contribution to the band gap reduction in comparison to garlic doped-TiO2.11
Furthermore, results suggested that loading significantly contributed to the red-shift of the band gap, which facilitated the excitation of electrons from the valence band to the conduction band, which consequently resulted in higher photocatalytic activity.44
Photocatalytic activity and mechanism
MO—a widely used azo dye and DCP – one of the major pollutants were chosen as target contaminants to evaluate the photocatalytic activity of as-prepared nanocatalysts in the visible light range. It is well documented that doped/loaded nanocrystalline TiO2 exhibits photocatalytic activity in the visible light range and can decompose various organic pollutants.| A = ε × L × [MO−] | (5) |
The photocatalytic activities of as-prepared nanocatalysts were evaluated by the reaction rate constants (Table 1). It is known that azodyes can absorb visible light themselves.5 Therefore, to evaluate the hypothesis that degradation of MO was not due to the self-sensitization mechanism and depended on the addition of the nanocatalyst, several experiments were performed without TiO2 and only in the presence of the visible light irradiation. These experiments showed that the significant degradation of MO did not occur (ca. 5–8%) without the nanocatalyst and only a negligible amount of MO (8–12%) was destroyed in the absence of visible light due to the adsorption of azodye onto the surface of the doped and loaded TiO2. The decrease in MO concentration was attributed to the chemical reaction rather than adsorption.18 Solution demineralization was evaluated by monitoring TOC changes. TOC removal was in the range of 80 to 90%.
According to the kinetic model applied, the reaction rate constants were 1.6 × 10⁻³, 8.5 × 10⁻³ and 19.4 × 10⁻³ min−1 for garlic doped TiO2, and Ag, garlic loaded–TiO2 calcined at 450 °C and 700 °C, respectively, while 5.3 × 10⁻⁴ min−1 was observed for Degussa P25 (Table 1). It is obvious that the visible-light activity was significantly enhanced by the addition of dopants, especially in the case of Ag, garlic loaded-TiO2 calcined at 700 °C (Fig. 7).
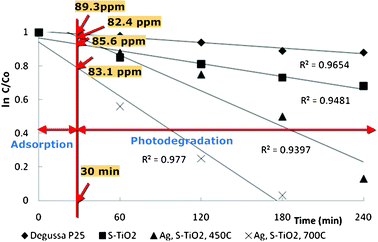 | ||
| Fig. 7 The plot of relative concentrations of MO in logarithmic scale (ln (C/Co) against the irradiation time (t) for Ag, garlic loaded-TiO2, garlic doped-TiO2 and commercial Degussa P25 calcined at 450 °C and 700 °C. | ||
Degussa P25, which was selected as a reference, showed some activity towards the degradation of MO, which may be attributed to the photosensitization by dyes and self-photosensitized processes.4,45 Thus, insignificant photoactivity may be caused by the inability of photo-excited electron of MO to transfer to the conduction band (CB) of Degussa P25.
The Ag, garlic loaded-TiO2 exhibited higher photocatalytic activity regardless the calcination temperature used in comparison to garlic-doped TiO2 and commercial Degussa P25 under otherwise identical experimental conditions showing a promotional effect of the simultaneous loading (Fig. 7). Loading with Ag+ ions effectively suppressed the recombination of the photogenerated charge-carriers on the surface of the catalyst,11 therefore a larger number of molecules was adsorbed and subsequently oxidized.
The increase in calcination temperature from 450 °C to 700 °C demonstrated a near 20% increase in MO degradation efficiency obtained in 3 h in comparison to 4 h, which was necessary to degrade 88% of MO in the presence of Ag, garlic loaded-TiO2 nanophotocatalyst. It may be explained by the so-called ‘critical crystallite size’,26 which limits the photocatalytic activity of as-prepared nanocatalysts. When the surface of TiO2 is irradiated, the electron–hole pair is created due to the ejection of an electron46 from the valence band (VB), subsequently leaving the hole (h+) in the VB. According to Baiju and co-workers, generated e−/h+ pair migrates to the particle surface, e.g. conduction band (CB), however if the crystallite size is too large, the travel distance for the pair increases, thus more opportunities to recombine occur.47 On the other hand, when the crystallite size is small, the e−/h+ pair may get trapped at the active surface sites before even surface charge recombination process is initiated.26 In addition, critical crystallite size may also take place due to the kinetic effects. For instance, the activation energy is directly related to the particle size, which varies with changes in temperature, because a change in temperature can significantly alter the kinetic energy of atoms in anatase phase.48 Therefore, the optimum reported crystallite size was reported to be ∼15 nm.47,48
Fig. 8 shows the degradation of DCP in the presence of Degussa 25, garlic-doped and Ag, garlic loaded TiO2 nanocatalysts calcined at 450 °C and 700 °C. Evidently, the degradation followed the same pattern as MO, with more than 70% disappearance in the presence of Ag, garlic-loaded TiO2 calcined at 700 °C in 4 h. The reaction rate constants were 9.5 × 10⁻⁴, 1.9 × 10⁻³ and 3.2 × 10⁻³ min−1 for garlic doped TiO2, Ag, garlic loaded-TiO2 calcined at 450 °C and 700 °C, respectively. TOC removal was in the range 40 to 80%. Importantly, we did not attempt to identify the reaction by-products or the formation of intermediates, just the disappearance of DCP and total mineralization of the solution in a current study.
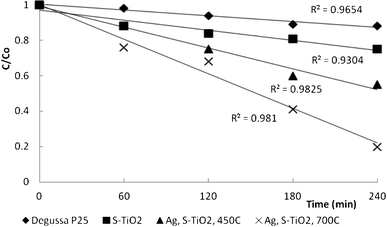 | ||
| Fig. 8 The plot of relative concentrations of DCP in logarithmic scale (ln (C/Co) against the irradiation time (t) for Ag, garlic loaded-TiO2, garlic doped-TiO2 and commercial Degussa P25 calcined at 450 °C and 700 °C. | ||
In comparison to other sulfur and/or silver loaded/doped TiO2 catalysts,49–51catalysts manufactured in the current study exhibited either similar or 2 to 3-fold decrease in the reaction time and demonstrated nearly 2 to 10 times faster reaction rates in degrading various azo-dyes and aromatic organic compounds than several other available doped and loaded catalysts.
Thus, an increased photocatalytic activity could be attributed to (i) the high stability and crystallization degree of doped/loaded anatase, which facilitated the transfer of electrons and thus decreased their recombination within the photogenerated holes, and/or (ii) doping generated more oxygen vacancies or distortions leading to the lattice defects that could capture the photoinduced electrons inhibiting the recombination of electrons and holes.26,52,53
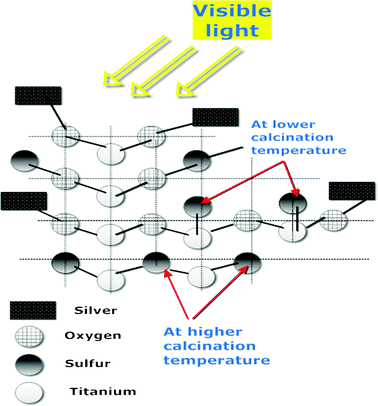 | ||
| Fig. 9 Hypothesized photocatalytic mechanism of as-prepared nano-photocatalysts. | ||
Thus, the hole in the VB can be captured by OH− or H2O species adsorbed on the surface of the catalyst to produce radicals, whereas photogenerated electrons in the CB can reduce the adsorbed oxygen into ˙O2−, which contribute to the increased activity of the nanocatalyst.3 In addition, the hole itself can effectively oxidize target pollutants adsorbed onto the surface of the catalyst.45,55 Obviously, the degradation of MO and DCP proceeded on the surface of the nanocatalyst5 by the synergistic effect of holes and produced radicals, and not in the bulk of the solution due to the fact that photogenerated radicals were short lived and tended to recombine to form water.56 In addition, the occurrence of anatase phase with high degree of crystallinity and slightly distorted lattice by the introduced dopants, enhanced the photocatalytic degradation of MO and DCP in the liquid phase.
Toxicity measurements of the nanocatalysts
According to Fig. 7, visible light active loaded and doped nano-TiO2 significantly inhibited luminescent activity of Vibrio fischeri in comparison to Degussa P25 (Fig. 10). Degussa P25 exhibited toxicity and was detrimental to bacterial growth when the nanocatalyst concentration was above 20 mg L−1, which was consistent with findings of Heinlaan and colleagues,57 who researched the toxicity of nanosized and bulk TiO2 to Vibrio fischeri. Furthermore, the inhibition of bacterial growth was diminished (95–100%) at the 1 mg L−1catalyst concentration, regardless of the calcination temperature. On the contrary, when bacteria was subjected to only garlic-doped TiO2, the growth was inhibited by 55%, which indicated that antimicrobial activity might have been suppressed by organic compounds present in garlic. Clearly, toxicity induced by garlic-doped TiO2 needs further assessment. Therefore, an increase in toxicity can be associated with Ag, which is considered as a very effective bactericide and fungicide.30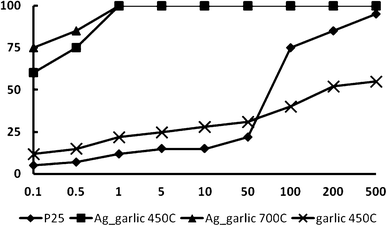 | ||
| Fig. 10 Inhibition (%) of the luminescence of V. fischeri as a function of exposure to various concentrations of Degussa P25 and doped and loaded TiO2 nanocatalyst. | ||
Recyclability and future perspectives
Ag, garlic loaded-TiO2 nanocatalyst exhibited an outstanding stability and recyclability, without the significant loss in the catalytic activity after 5 consecutive experimental runs with fresh MO dyes and DCP added to the experimental medium. The reduction in the reaction rate constants were up to 7.2–15% lower than of the original as-prepared catalyst. However, after a simple regeneration procedure by washing with water and acetone and drying at 200 °C for 2 h, the activities were only 5% lower for the subsequent 5 runs. No white precipitate was observed when the MO-containing effluent was treated with NaCl indicating that no silver ions were present in the solution.Therefore, the further research on the stability and recyclability improvement of the Ag, garlic loaded-TiO2 nanocatalysts, especially in the presence of a real wastewater or multi-component effluents is warranted. The use of simple one pot synthesis using cheap and benign precursors from e.g. organic waste (garlic or onion peel, etc.) presents unlimited advantages of significant reduction in the catalyst preparation costs. Moreover, doping with different cationic species opens enormous possibilities to use these catalysts for biomedical applications, biosensors, etc.
Conclusions
1. Simultaneous doping/loading of TiO2 with garlic (organic sulfur species) and Ag+ ions significantly increased the photocatalytic activity in the visible light range.2. Calcination of Ag, garlic loaded-TiO2 at 450 °C and 700 °C produced stable anatase photocatalysts without the conversion to rutile phase. Higher calcination temperatures rendered larger particle sizes, which were ∼10 nm and ∼15 nm in samples calcined at 450 °C and 700 °C, respectively.
3. MO and DCP were efficiently degraded in the presence of visible light activated Ag, garlic loaded-TiO2 and garlic-doped TiO2 nanocatalysts with degradation efficiencies from 70 to 100% and the reaction rate constants ranging from 9.5 × 10⁻⁴ to 19.4 × 10⁻³ min−1.
4. Ag, garlic loaded-TiO2 nanocatalysts exhibited good stability for 5 consecutive runs without significant loss in the catalytic activity.
Acknowledgements
This research was performed at the National Risk Management Research Laboratory of U.S. Environmental Protection Agency, Cincinnati, Ohio, while J.V. held a National Research Council Research Associateship Award. This paper has not been subjected to internal policy review of the U.S. EPA. Therefore, the research results do not necessarily reflect the views of the agency or its policy. Mention of trade names and commercial products does not constitute endorsement or recommendation for use.References
- K. Szaciłowski, W. Macyk, A. Drzewiecka-Matuszek, M. Brindell and G. Stochel, Chem. Rev., 2005, 105, 2647–2694 CrossRef.
- E. M. Rockafellow, L. K. Stewart and W. S. Jenks, Appl. Catal., B, 2009, 91, 554–562 CrossRef CAS.
- M. Hamadanian, A. Reisi-Vanani and A. Majedi, Mater. Chem. Phys., 2009, 116, 376–382 CrossRef CAS.
- X. Yang, C. Cao, L. Erickson, K. Hohn, R. Maghirang and K. Klabunde, Appl. Catal., B, 2009, 91, 657–662 CrossRef CAS.
- H. Znad and Y. Kawase, J. Mol. Catal. A: Chem., 2009, 314, 55–62 CrossRef CAS.
- Y. Wang, J. Li, P. Peng, T. Lu and L. Wang, Appl. Surf. Sci., 2008, 254, 5276–5280 CrossRef CAS.
- D. He and F. Lin, Mater. Lett., 2007, 61, 3385–3387 CrossRef CAS.
- M. Inagaki, Y. Nakazawa, M. Hirano, Y. Kobayashi and M. Toyoda, Int. J. Inorg. Mater., 2001, 3, 809–811 CrossRef CAS.
- X. Zhang and L. Lei, Mater. Lett., 2008, 62, 895–897 CrossRef CAS.
- I. M. Arabatzis, T. Stergiopoulos, M. C. Bernard, D. Labou, S. G. Neophytides and P. Falaras, Appl. Catal., B, 2003, 42, 187–201 CrossRef CAS.
- D. B. Hamal and K. J. Klabunde, J. Colloid Interface Sci., 2007, 311, 514–522 CrossRef CAS.
- J. García-Serrano, E. Gómez-Hernández, M. Ocampo-Fernández and U. Pal, Curr. Appl. Phys., 2009, 9, 1097–1105 CrossRef.
- G. Guo, B. Yu, P. Yu and X. Chen, Talanta, 2009, 79, 570–575 CrossRef CAS.
- A. K. Gupta, A. Pal and C. Sahoo, Dyes Pigm., 2006, 69, 224–232 CrossRef CAS.
- M. K. Seery, R. George, P. Floris and S. C. Pillai, J. Photochem. Photobiol., A, 2007, 189, 258–263 CrossRef CAS.
- L. Kumaresan, M. Mahalakshmi, M. Palanichamy and V. Murugesan, Ind. Eng. Chem. Res., 49, 1480–1485 CrossRef CAS.
- R. Niishiro, H. Kato and A. Kudo, Phys. Chem. Chem. Phys., 2005, 7, 2241–2245 RSC.
- S.-Y. Huang, P. Ganesan, S. Park and B. N. Popov, J. Am. Chem. Soc., 2009, 131, 13898–13899 CrossRef CAS.
- C. Liang, C. Liu, F. Li and F. Wu, Chem. Eng. J., 2009, 147, 219–225 CrossRef CAS.
- H. Tian, J. Ma, K. Li and J. Li, Ceram. Int., 2009, 35, 1289–1292 CrossRef CAS.
- G. Tian, K. Pan, H. Fu, L. Jing and W. Zhou, J. Hazard. Mater., 2009, 166, 939–944 CrossRef CAS.
- M. Ksibi, S. Rossignol, J.-M. Tatibouët and C. Trapalis, Mater. Lett., 2008, 62, 4204–4206 CrossRef CAS.
- T. Ohno, K. Tokieda, S. Higashida and M. Matsumura, Appl. Catal., A, 2003, 244, 383–391 CrossRef CAS.
- R. Asahi, T. Morikawa, T. Ohwaki, K. Aoki and Y. Taga, Science, 2001, 293, 269–271 CrossRef CAS.
- X. Lu, B. A. Rasco, J. M. F. Jabal, D. E. Aston, M. Lin and M. E. Konkel, Appl. Environ. Microbiol., 2011, 77, 5257–5269 CrossRef CAS.
- P. Periyat, S. C. Pillai, D. E. McCormack, J. Colreavy and S. J. Hinder, J. Phys. Chem. C, 2008, 112, 7644–7652 CAS.
- C. Sahoo, A. K. Gupta and A. Pal, Desalination, 2005, 181, 91–100 CrossRef CAS.
- J. Lappalainen, R. Juvonen, J. Nurmi and M. Karp, Chemosphere, 2001, 45, 635–641 CrossRef CAS.
- K. Boukerma, J.-Y. Piquemal, M. M. Chehimi, M. Mravcáková, M. Omastová and P. Beaunier, Polymer, 2006, 47, 569–576 CrossRef CAS.
- W. Su, S. S. Wei, S. Q. Hu and J. X. Tang, J. Hazard. Mater., 2009, 172, 716–720 CrossRef CAS.
- Y. Miao, Z. Zhai, J. He, B. Li, J. Li and J. Wang, Mater. Sci. Eng. C, 2010, 30, 839–846 CrossRef CAS.
- X. Yang, C. Cao, L. Erickson, K. Hohn, R. Maghirang and K. Klabunde, J. Catal., 2008, 260, 128–133 CrossRef CAS.
- T. Ohno, N. Murakami, T. Tsubota and H. Nishimura, Appl. Catal. A: Gen., 2008, 349, 70–75 CrossRef CAS.
- T. Ohno, M. Akiyoshi, T. Umebayashi, K. Asai, T. Mitsui and M. Matsumura, Appl. Catal. A: Gen., 2004, 265, 115–121 CrossRef CAS.
- S. Liu and X. Chen, J. Hazard. Mater., 2008, 152, 48–55 CrossRef CAS.
- K. Nishijima, B. Ohtani, X. Yan, T.-a. Kamai, T. Chiyoya, T. Tsubota, N. Murakami and T. Ohno, Chem. Phys., 2007, 339, 64–72 CrossRef CAS.
- J. A. Rengifo-Herrera, E. Mielczarski, J. Mielczarski, N. C. Castillo, J. Kiwi and C. Pulgarin, Appl. Catal. B: Environ., 2008, 84, 448–456 CrossRef CAS.
- P. Górska, A. Zaleska, E. Kowalska, T. Klimczuk, J. W. Sobczak, E. Skwarek, W. Janusz and J. Hupka, Appl. Catal. B: Environ., 2008, 84, 440–447 CrossRef.
- A. Zielinska, E. Kowalska, J. W. Sobczak, I. Lacka, M. Gazda, B. Ohtani, J. Hupka and A. Zaleska, Sep. Purif. Technol., 2010, 72, 309–318 CrossRef CAS.
- Z. Xiong, J. Ma, W. J. Ng, T. D. Waite and X. S. Zhao, Water Res., 2011, 45, 2095–2103 CrossRef CAS.
- R. Gómez, T. López, E. Ortiz-Islas, J. Navarrete, E. Sánchez, F. Tzompanztzi and X. Bokhimi, J. Molec. Catal. A - Chem., 2003, 193, 217–226 CrossRef.
- T. Umebayashi, T. Yamaki, S. Tanaka and K. Asai, Chem. Lett., 2003, 32, 330–332 CrossRef CAS.
- K. Nagaveni, M. S. Hegde, N. Ravishankar, G. N. Subbanna and G. Madras, Langmuir, 2004, 20, 2900–2907 CrossRef CAS.
- F. Zhang, J. Zhao, T. Shen, H. Hidaka, E. Pelizzetti and N. Serpone, Appl. Cat. B - Environ., 1998, 15, 147–156 CrossRef CAS.
- A. Sclafani, M.-N. Mozzanega and P. Pichat, J. Photochem. Photobiol. A - Chem., 1991, 59, 181–189 CrossRef CAS.
- K. V. Baiju, S. Shukla, K. S. Sandhya, J. James and K. G. K. Warrier, J. Phys. Chem. C, 2007, 111, 7612–7622 CAS.
- H. Zhang and J. F. Banfield, J. Mater. Chem., 1998, 8, 2073–2076 RSC.
- Y. Liu, J. Liu, Y. Lin, Y. Zhang and Y. Wei, Ceramics Internat., 2009, 35, 3061–3065 CrossRef CAS.
- Y. Zang and R. Farnood, Appl. Catal. B: Environ., 2008, 79, 334–340 CrossRef CAS.
- J. Yu, J. Xiong, B. Cheng and S. Liu, Appl. Catal. B: Environ., 2005, 60, 211–221 CrossRef CAS.
- H. Sun, Y. Bai, H. Liu, W. Jin and N. Xu, J. Photochem. Photobiol., 2009, 201, 15–22 CrossRef CAS.
- H. Li, X. Zhang, Y. Huo and J. Zhu, Environ. Sci. Technol., 2007, 41, 4410–4414 CrossRef CAS.
- E. L. D. Hebenstreit, W. Hebenstreit and U. Diebold, Surf. Sci., 2001, 470, 347–360 CrossRef CAS.
- G. Colón, M. C. Hidalgo, J. A. Navío, A. Kubacka and M. Fernández-García, Appl. Catal B - Environ., 2009, 90, 633–641 CrossRef.
- E. V. Rokhina, M. Lahtinen, M. C. M. Nolte and J. Virkutyte, Appl. Catal B - Environ., 2009, 87, 162–170 CrossRef CAS.
- M. Heinlaan, A. Ivask, I. Blinova, H.-C. Dubourguier and A. Kahru, Chemosphere, 2008, 71, 1308–1316 CrossRef CAS.
Footnote |
| † Electronic Supplementary Information available: Power rate law, BET surface area, pore volume and pore sizes, results of curve fitting of the XPS spectra for the C 1s, O 1s, Ti 2p, Ag 3d and S 2p regions and high resolution spectra of each region. See DOI: 10.1039/c2ra00790h/ |
| This journal is © The Royal Society of Chemistry 2012 |
