Mg1.5Lu1.5Al3.5Si1.5O12:Ce3+,Mn2+: A novel garnet phosphor with adjustable emission color for blue light-emitting diodes†
Yongchao
Jia
ab,
Yeju
Huang
c,
Ning
Guo
ab,
Hui
Qiao
ab,
Yuhua
Zheng
ab,
Wenzhen
Lv
ab,
Qi
Zhao
ab and
Hongpeng
You
*a
aState Key Laboratory of Rare Earth Resource Utilization, Changchun Institute of Applied Chemistry, Chinese Academy of Sciences, Changchun, 130022, P. R. China. E-mail: hpyou@ciac.jl.cn
bGraduate School of Chinese Academy of Sciences, Beijing, 100049, China
cSchool of National Defence Science and Technology, Southwest university of science and technology, Sichuan, China
First published on 15th February 2012
Abstract
Mg1.5Lu1.5Al3.5O1.5O12:Ce3+,Mn2+, a novel garnet phosphor was synthesized by solid state reaction. The obtained samples can be excited efficiently by the blue light and exhibit varied hues from green-yellow through yellow and eventually to orange by tuning the relative proportion of Ce3+/Mn2+.
Solid state lighting in the form of white light-emitting diodes (LEDs) has received increasing interest in recent years for the characteristic merits and promising application, which has potential to entirely replace both incandescent and fluorescent lamps in the near future.1–3 The commercial devices in the market use InGaN blue LED in combination with a yellow phosphor, typically Ce3+-doped yttrium aluminum garnet (YAG:Ce3+). Although the path of white light realization is inexpensive and efficient, it has poor color-rendering properties due to the deficiency of the red component. Many efforts have been devoted to improve the color rendering index (CRI), which can be grouped into two categories: one is the modification of the YAG:Ce3+ system, including codoping the Pr3+ ion and incorporation the Si4+–N3− chemical bond.4,5 The problem with this method is the enhancement of the red component efficiency is not obvious; the other is exploring the red phosphors which can be added into the above-mentioned system. The obstacle in research is that the red phosphors mainly focus on the nitride system and the corresponding synthetic process is high cost and harsh.6–8 In addition, the difference in degradation between different host phosphors will produce color aberration, an undesirable phenomenon in the real application. Accordingly, it is urgent to investigate a single-host phosphor with yellow-to red emission band for blue LEDs. Following the energy transfer mechanism, the phosphor could exhibit varied hues by codoping activators, such as Ce3+/Eu2+,9 Ce3+/Mn2+,10 and Eu2+/Mn2+.11 The Ce3+ and Mn2+ ions possess f-d and d-d electron configuration, and they are good candidates as activators in phosphor because they can emit broadband visible light. The energy transfer between Ce3+ and Mn2+ ions has been realized in many systems, however, the corresponding research in the garnet system based on the energy transfer to increase the red component is rarely reported, perhaps the reason for this may be no suitable crystallographic site for Mn2+ in the existing aluminum garnet host lattice. In this communication, we substitute the Lu–Al chemical bond with the Mg–Si chemical bond in the existing garnet Lu3Al5O12, and synthesize the compound with the formula Mg1.5Lu1.5Al3.5Si1.5O12 (MLASO) which the Ce3+ and Mn2+ ions can dope into the host lattice and substitute the Lu3+ and Mg2+ crystallographic sites, respectively. The luminescent properties of the MLASO:Ce3+,Mn2+ phosphor is also investigated as well as energy transfer phenomenon between the sensitizer (Ce3+) and activator (Mn2+).
MLASO:Ce3+,Mn2+ phosphors were prepared by solid state reactions from high purity MgO, Lu2O3, Al2O3, SiO2, CeO2, and MnCO3 starting materials sintered at 1350 °C under CO reducing atmosphere for 3 h. Photoluminescence (PL) and photoluminescence excitation (PLE) were measured by spectrophotometers (Hitachi, F-4500) using a xenon lamp. Crystal structure and phase were analyzed using X-ray diffraction (Bruker D8, Target Cu-Kα, 40 kV, 40 mA). Rietveld analysis of XRD profile made use of the general structure analysis system (GSAS) program. All the measurements mentioned above were performed at room temperature.
Fig. 1 shows a Rietveld refinement of the XRD patterns of MLASO. The initial structural model which approximates the actual structure of MLASO was constructed with crystallographic data previously reported for Lu3Al5O12 (JCPDS card No.73-1368). All of the observed peaks satisfy the reflection condition, confirming that the single-phase nature of the MLASO. Successful formation of the single phase can attribute to the fact that the end members Lu3Al5O12 and M3Al2Si3O12 (M = Mg, Mn) possess similar garnet crystal structure with the general formula {R3}[C2](D3)O12, where {}, [] and () denote dodecahedral, octahedral and tetrahedral co-ordination, respectively. Therefore, it is reasonably inferred that both Lu3+ and Mg2+ ions occupy the dodecahedral sites in our sample. This inference can be supported by the XRD result of our sample. The XRD peaks of MLASO samples shift towards higher 2θ angles, compared with the XRD peaks of Lu3Al5O12, indicating the shrinkage of the unit cell. This can be expected from the substitution of smaller Mg2+ ions (89 pm) for larger Lu3+ ions (97 pm) on dodecahedral sites, and smaller Si4+ ions (40 pm) for larger Al3+ ions (67.5 pm) on the octahedral sites.12 Similarly, the activators Ce3+ and Mn2+ have distributed into the host lattice by replacing the Lu3+ and Mg2+ ions, respectively, and the related XRD profiles are shown in Fig. S1.†
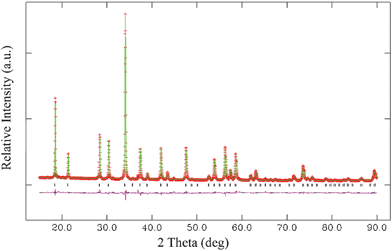 | ||
| Fig. 1 Experimental (crosses), calculated (solid line), and difference (bottom) results of XRD refinement of MLASO. | ||
The emission and excitation spectra of the MLASO:Ce3+ and MLASO:Mn2+ are represented in Fig. 2. As shown in Fig. 2(a), under blue of 430 nm excitation, the Ce3+ singly doped sample exhibits a broad asymmetric green-yellow emission centered at 525 nm, which is attributed to the 5d1→4f1 transition of the Ce3+ ions. The asymmetric emission band can be deconvoluted into two Gaussians centering at 517 and 577 nm, as indicated in Fig. S2.† The energy difference between spin–orbit splitting of 4f ground state in MLASO:Ce3+ is about 2010 cm−1, and is in agreement with the theoretical value of 2000 cm−1, indicating that the emission originated from the lowest 5d level to the 2F5/2 and 2F7/2 levels, respectively. Compared with the luminescence properties of Lu3Al5O12:Ce3+ phosphor, those of MLASO:Ce3+ exhibit some differences: the PLE and PL spectra shift to the short wavelength; the absorption sub-band at short-wavelength becomes wider. The blue-shift of Ce3+ luminescence is opposite to the work reported by Katelnikovas' group:13 the red-shift of Ce3+ luminescence can be realized in the LuAG system by the substitution Al3+–Al3+→Mg2+–Si4+, and the related reason is analyzed as below. In Katelnikovas' samples Lu3Al3MgSiO12:Ce3+, the Mg2+–Si4+ couple on the octahedrally coordinated Al3+ sites and tetrahedrally coordinated Al3+ sites. We infer that the reason for the red-shift of the Ce3+ luminescence can be ascribed to two factors: First, the Si4+ ions substituted tetrahedral Al3+ crystallographic sites. The Si4+ ions possess the higher charge and smaller size in comparison to Al3+ ions, which lead to the O–{Lu}–O bond angle for the dodecahedral-tetrahedral shared edge becoming smaller in the Lu3Al3MgSiO12 in comparison to typical aluminate garnet (Lu3Al5O12), resulting in the red-shift of Ce3+ luminescence.5 Second, the Mg2+ ions substituted octahedral Al3+ crystallographic sites. The Mg2+ ions possess the smaller charge (+2) and bigger size (72 pm) in comparison to Al3+ ions (+3, 53.5 pm), which lead to the lower charge density of the ions located onto the octahedral sites. The lower charge density results in a decrease covalent interaction between the oxygen anions and the ions located at octahedral sites, but the increased covalent interaction between the oxygen anions and the ions located at dodecahedral sites, and a red-shift of Ce3+ luminescence can be expected. In our sample Lu1.5Mg1.5Al3.5Si1.5O12:Ce3+, the Mg2+ and Si4+ ions occupy the dodecahedrally coordinated Lu3+ sites and tetrahedrally coordinated Al3+ sites, respectively. The substitution of tetrahedral Al3+ crystallographic sites by Si4+ would make a similar effect on luminescence properties as the above analysis. However, it is worth noting the occupancy of Mg2+ on the dodecahedral Lu3+ crystallographic sites. Taken into consideration the smaller size of Mg2+ (89 pm) compared to Lu3+ (97 pm), a blue-shift of Ce3+ luminescence is expected. The variation of Ce3+ luminescence in our samples can be attributed to the interaction of the two factors, and the experimental phenomenon shows that the latter one dominates the effect. Although the analysis above can explain the luminescent properties of Ce3+ ions in these garnet, further work is needed to get a better understanding for the structure-property correlation in Ce3+-doped garnet phosphors. Beside the blue-shift of the Ce3+ luminescence in MLASO:0.05Ce3+, the excitation bands in the deeper UV additional excitation bands, unlike the UV excitation bands in Lu3Al5O12:Ce3+. This additional excitation bands in the UV for these garnet could be due to silicate 2nd phases (e.g., apatites or Lu2SiO5/Lu2Si2O7) which contain Ce3+ ions, these 2nd phases could be below XRD detection limits. Similar result has been previously noted in other work for the Ce3+ luminescence in silicate garnets.14 As depicted in Fig. 2(b), the PL spectrum of MLASO:Mn2+ shows a broad red emission band centering at 620 nm ascribed to the spin-forbidden 4T1(4G)→6A1(6S) transition of the Mn2+ ions. The PLE spectra thereof cover a wide range of 200–500 nm. However, the relative intensity of the red emission from the Mn2+ is very weak, and this is attributed to the spin and parity forbidden d→d transition of Mn2+ ion. Moreover, a conspicuous spectral overlap between the emission band of the Ce3+ ions and the excitation of band the Mn2+ ions was observed between Fig. 2(a) and 2(b). Therefore, it is expected that an efficient energy transfer can occur from the Ce3+ to Mn2+ ions.
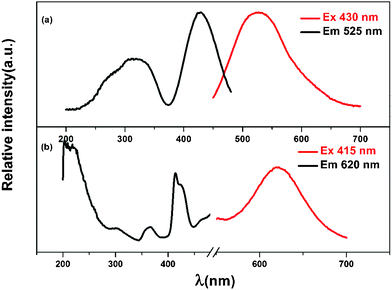 | ||
| Fig. 2 Excitation and emission spectra for phosphors with composition of MLASO:0.05Ce3+ (a), MLASO:0.15Mn2+ (b). | ||
Fig. 3 shows the emission spectra for MLASO:0.05Ce3+,xMn2+ phosphors with different x of 0, 0.02, 0.05, 0.10, 0.15, 0.20, 0.25, 0.35, 0.45 and 0.50, which were measured at excitation wavelength of 430 nm, corresponding to the optimal excitation wavelength of the energy donor Ce3+. The PL spectrum of MLASO:0.05Ce3+,xMn2+ appear not only as a green-yellow band of the Ce3+ ions but also as a red band of the Mn2+ ions. With increasing Mn2+ content (x), the emission intensity of the Mn2+ ions increases systematically and reaches saturation as x equals to about 0.10, whereas the intensity of the Ce3+ sensitizer was found to decrease remarkably from x = 0.02 to 0.50. The observed saturation in Mn2+ intensity is attributed to the concentration quenching. In addition, it is noticeable that the emission peak of the Mn2+ ions shifts to long wavelength direction with increasing the concentration thereof, which might be due to the enhancement of crystal field strength surrounding Mn2+ ions.
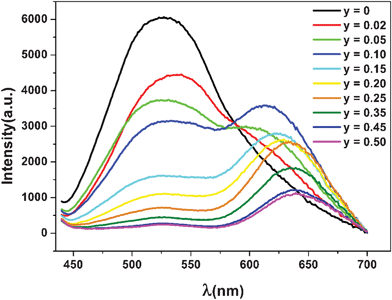 | ||
| Fig. 3 Emission spectra of MLASO:0.05Ce3+, xMn2+ phosphors. | ||
The energy transfer between the Ce3+ and Mn2+ ions in MLASO:Ce3+,Mn2+ can be confirmed by the above-described observation and calculated energy transfer efficiency (ηT) can be expressed by15
 | (1) |
 | (2) |
 | (3) |
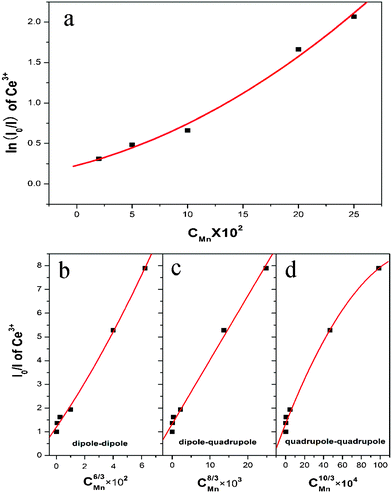 | ||
| Fig. 4 (a) Dependence of ln(IS0/IS) of Ce3+ on C; and IS0/IS of Ce3+ on (b)C6/3; (c) C8/3 and (d)C10/3. | ||

| (4) |
The Commission International de I′Eclairage (CIE) chromaticity coordinates for MLASO:0.05Ce3+, xMn2+ are represented in Fig. 5. With increasing Mn2+ content, the chromaticity coordinates (x, y) vary systematically from (0.310, 0.498) to (0.447, 0.434) and ultimately to (0.512, 0.385); corresponding color tone of the sample changes gradually from green-yellow to yellow and eventually to orange. Various white lights are expected to obtain when the tunable emission of MLASO:Ce3+,Mn2+ couple with blue LEDs. The obtained samples have more emission intensity in the red region than the commercial phosphor Y3Al5O12:Ce3+, thus, the white light with higher CRI is expected to be generated. These results indicate that this single-phased tunable-emitting phosphor may be useful for the development of white LEDs, due to the stronger emission in the red region. Although the phosphors may suffer the system-level limitation for using Mn2+ phosphor in LEDs based upon the slow decay times of Mn2+ that lead to intensity saturation, it can be overcome through reducing the incident flux on Ce3+–Mn2+ phosphors.19
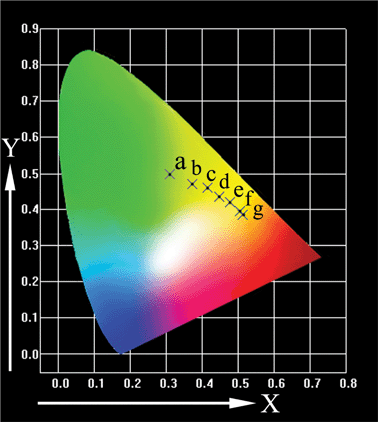 | ||
| Fig. 5 CIE chromaticity diagram for MLASO:0.05Ce3+,xMn2+ excited at 430 nm. (a) x = 0; (b) x = 0.05; (c) x = 0.10; (d) x = 0.15; (e) x = 0.20; (f) x = 0.25; (g) x = 0.35. | ||
In conclusion, a novel garnet-based phosphor Mg1.5Lu1.5Al3.5Si1.5O12:Ce3+,Mn2+ has been synthesized by solid state reaction. The phosphor shows intense blue absorption, and two emission bands centered at about 525 and 620 nm, which are attributed to Ce3+ and Mn2+ ions, respectively. We have demonstrated that the energy transfer from the Ce3+ to Mn2+ ions is dominated by the electric dipole-quadrupole interaction. Preliminary studies showed that this phosphor might have potential applications as a blue radiation-converting phosphor for white LEDs with high color rendering index.
This work is financially supported by the National Natural Science Foundation of China (grant no. 20771098) and the Fund for Creative Research Groups (grant no. 20921002), and the National Basic Research Program of China (973 Program, grant no. 2007CB935502).
References
- E. F. Schubert, J. K. Kim, H. Luo and J. Q. Xi, Rep. Prog. Phys., 2006, 69, 3069–3099 CrossRef CAS.
- H. A. Hoppe, Angew. Chem., Int. Ed., 2009, 48, 3572–3582 CrossRef.
- R. J. Xie and N. Hirosaki, Sci. Technol. Adv. Mater., 2007, 8, 588–600 CrossRef CAS.
- H. S. Jang, W. Bin Im, D. C. Lee, D. Y. Jeon and S. S. Kim, J. Lumin., 2007, 126, 371–377 CrossRef CAS.
- A. A. Setlur, W. J. Heward, M. E. Hannah and U. Happek, Chem. Mater., 2008, 20, 6277–6283 CrossRef CAS.
- C. Hecht, F. Stadler, P. J. Schmidt, J. S. A. der Guenne, V. Baumann and W. Schnick, Chem. Mater., 2009, 21, 1595–1601 CrossRef CAS.
- Y. Q. Li, J. E. J. van Steen, J. W. H. van Krevel, G. Botty, A. C. A. Delsing, F. J. DiSalvo, G. de With and H. T. Hintzen, J. Alloys Compd., 2006, 417, 273–279 CrossRef CAS.
- C. J. Duan, X. J. Wang, W. M. Otten, A. C. A. Delsing, J. T. Zhao and H. T. Hintzen, Chem. Mater., 2008, 20, 1597–1605 CrossRef CAS.
- Y. H. Song, G. Jia, M. Yang, Y. J. Huang, H. P. You and H. J. Zhang, Appl. Phys. Lett., 2009, 94 CAS.
- C. H. Huang, T. W. Kuo and T. M. Chen, ACS Appl. Mater. Interfaces, 2010, 2, 1395–1399 CAS.
- N. Guo, Y. J. Huang, H. P. You, M. Yang, Y. H. Song, K. Liu and Y. H. Zheng, Inorg. Chem., 2010, 49, 10907–10913 CrossRef CAS.
- R. D. Shannon, Acta Crystallogr., Sect. A: Cryst. Phys., Diffr., Theor. Gen. Crystallogr., 1976, 32, 751–767 CrossRef.
- A. Katelnikovas, H. Winkler, A. Kareiva and T. Jüstel, Opt. Mater., 2011, 33, 992–995 CrossRef CAS.
- A. A. Setlur, W. J. Heward, Y. Gao, A. M. Srivastava, R. G. Chandram and M. V. Shankar, Chem. Mater., 2006, 18, 3314–3322 CrossRef CAS.
- H. P. You, G. Y. Hong, X. Y. Wu, J. K. Tang and H. P. Hu, Chem. Mater., 2003, 15, 2000–2004 CrossRef CAS.
- T. F. Soules and C. B. Duke, Phys. Rev. B: Solid State, 1971, 3, 262–274 CrossRef.
- H. P. You, J. L. Zhang, G. Y. Hong and H. J. Zhang, J. Phys. Chem. C, 2007, 111, 10657–10661 CAS.
- A. A. Setlur, J. J. Shiang and U. Happek, J. Phys. Chem. C, 2011, 115, 3475–3480 CAS.
- A. A. Setlur, J. J. Shiang and U. Happek, Appl. Phys. Lett., 2008, 92, 081104 CrossRef.
Footnote |
| † Electronic supplementary information (ESI) available. See DOI: 10.1039/c2ra00894g |
| This journal is © The Royal Society of Chemistry 2012 |
