DOI:
10.1039/C2RA00991A
(Paper)
RSC Adv., 2012,
2, 3298-3308
Facile preparation and performance of mesoporous manganese oxide for supercapacitors utilizing neutral aqueous electrolytes†
Received
1st November 2011
, Accepted 16th January 2012
First published on 22nd February 2012
Abstract
A facile and green strategy based on a redox reaction between potassium permanganate and ascorbic acid was developed to synthesize mesoporous manganese oxide walnuts (MPMOW) for supercapacitors. The formation procedure was performed in a one-step fashion. The as-prepared samples were fully characterized to study the morphology, chemical composition and physical properties. An N2 adsorption-desorption test indicated that the surface area of the materials is up to 128 m2 g−1. When used as electrode materials for supercapacitors, this mesoporous manganese oxide electrode materials possessed high capacitance and good cyclic stability even after 2000 cycles at a relatively high current density (833.33 mA g−1) in three alkali metal sulfate neutral aqueous electrolytes (Li2SO4, Na2SO4 and K2SO4). Moreover, the charge storage mechanisms have been discussed in detail.
1. Introduction
Nowadays, supercapacitors (or electrochemical capacitors) are attracting keen interest in the world as electric storage devices because of their high power density and long cycle life.1–6 Over the past years, significant efforts have been devoted to the search of electrode materials for supercapacitors. Generally, the community of supercapacitors divided these electrode materials into three groups, porous carbon, conducting polymers and metal oxides, which have different charge storage mechanisms. For porous carbon, it always involves the adsorption of ions at the electric-double layers (non-faradaic process at the interface between electrode and electrolyte), so the term of electric double-layer capacitors (EDLCs) are often used in this case. On the other hand, for conducting polymers and metal oxides, the charge storage mechanism relates to redox reactions (faradaic processes) with charge transfer between the electrode and electrolyte, which is sometimes called “pseudocapacitive” behavior. Among them, metal oxides may be of particular importance in the terms of high volumetric energy density, a trait which has somehow been neglected in previous studies. Many metal oxides such as MnO2, NiO, Co2O3, SnO2, RuO2 and IrO2, etc. have been proposed as electrode materials for supercapacitors.7–17 Most of them have apparent faradaic features in the electrochemical tests, the redox peaks in cyclic voltammograms (CVs) or plateaus in the galvanostatic charge-discharge curves. By contrast, some RuO2 and MnO2 electrodes do show the non-faradaic characteristics such as nearly rectangular waves in CVs or roughly straight lines in galvanostatic charge-discharge curves. In the practical applications, non-faradaic features are preferred to the faradic ones. For instance, the residual capacity in a capacitor can be easily judged from the voltage if the corresponding galvanostatic discharge curve is linear. Therefore, manganese oxides become more promising by virtue of low cost, environmental benignity and earth abundance. Furthermore, MnO2 electrode materials can function well in neutral aqueous electrolyte solutions using neutral salts such as Li2SO4, Na2SO4, and KCl and so on. This is unlike most metal oxides such as RuO2 and NiO, which can only be used in strong acidic or alkali metal electrolytes. There have been numerous studies carried out on manganese oxides electrode materials for supercapacitors.17–27 Except for the constructive research carried out by Bélanger's group,18,19 few have reported specific capacitance values close to the theoretical one of 1370 F g−1. Typically, the specific capacitance values lie in the range from 100 to 400 F g−1 as listed in Table 1.20,21,27–45 It should be noted that the specific capacitance values at this magnitude of order are obtained from the pure manganese oxide components with high specific BET surface area (SBET). Most methods of preparing hollow and porous manganese oxides with high specific SBET commonly involve template (hard or soft) based routes,41,46 are time-consuming,26 require additives,26,41 or complex multi-step procedures.41,47 So it still remains a great challenge to develop simple and environmentally benign methods of preparing porous manganese oxides with high specific SBET for applications in supercapacitors.
Table 1 Summary of various reported porous MnO2 electrode materials for supercapacitors utilizing aqueous electrolytes
| Electrolyte |
C, (mol L−1) |
Operating voltage (V) |
Electrode materials |
Current density or scan rate |
S
BET (m2 g−1) |
SC or capacity |
References |
| K2SO4 |
0.1 |
0.9 |
birnessite |
2 mV s−1 |
17 |
110 |
20
|
| Na2SO4 |
1 |
1 |
MnO2 |
5 mV s−1 |
132 |
168 F g−1 |
21
|
| Na2SO4 |
0.1 |
1 |
MnO2 |
20 mV s−1 |
123 |
297 F g−1 |
27
|
| Na2SO4 |
1 |
1 |
δ-MnO2 |
5 mV s−1 |
230 |
265 F g−1 |
28
|
| Na2SO4 |
1 |
0.8 |
MnO2 |
2 mV s−1 |
335 |
305 F g−1 |
29
|
| Na2SO4 |
0.1 |
1 |
MnO2 |
10 mV s−1 |
230 |
250 F g−1 |
30
|
| Na2SO4 |
0.5 |
1 |
MnO2 |
1 mV s−1 |
135 |
201 F g−1 |
31
|
| Na2SO4 |
1 |
1 |
MnO2 |
2 mV s−1 |
240 |
200 F g−1 |
32
|
| K2SO4 |
0.1 |
0.9 |
substituted MnO2 |
2 mV s−1 |
184 |
68 F g−1 |
33
|
| LiOH |
1 |
0.7 |
MnO2 |
100 mA g−1 |
136.9 |
250 F g−1 |
34
|
| Na2SO4 |
1 |
1 |
MnO2 |
5 mV s−1 |
116 |
206 F g−1 |
35
|
| KCl |
2 |
1.2 |
MnO2 |
5 mV s−1 |
303 |
200 F g−1 |
36
|
| Na2SO4 |
1 |
0.8 |
MnO2 |
2 mA cm−2 |
279 |
176 F g−1 |
37
|
| KOH |
9 |
1 |
MnO2 |
250 mAg−1 |
112 |
344.26 mAh g−1 |
38
|
| Na2SO4 |
1 |
1 |
MnO2 |
2 mV s−1 |
239 |
285 F g−1 |
39
|
| Na2SO4 |
1 |
1 |
MnO2 |
5 mV s−1 |
81 |
221 F g−1 |
40
|
| Na2SO4 |
1 |
1 |
MnO2 |
10 mV s−1 |
75 |
90 F g−1 |
41
|
| Na2SO4 |
1 |
0.9 |
MnO2 |
250 mA g−1 |
318 |
169 F g−1 |
42
|
| Na2SO4 |
1 |
1 |
MnO2 |
5 mV s−1 |
119 |
152 F g−1 |
43
|
| Na2SO4 |
0.5 |
1 |
MnO2 |
5 mV s−1 |
161 |
344 F g−1 |
44
|
| LiOH |
1 |
0.8 |
MnO2 |
1000 mAg−1 |
225.93 |
121.5 F g−1 |
45
|
| Li2SO4 |
1 |
1 |
MnO2 |
1 mV s−1 |
127.98 |
284.235 F g−1 |
results in this paper |
| 2 mV s−1 |
251.8 F g−1 |
| Na2SO4 |
1 |
1 |
1 mV s−1 |
278.8 F g−1 |
| 2 mV s−1 |
239.4 F g−1 |
| K2SO4 |
0.65 |
1 |
1 mV s−1 |
224.9 F g−1 |
| 2 mV s−1 |
202.8 F g−1 |
In this paper, we developed a facile and green strategy to synthesize amorphous mesoporous manganese oxide walnuts (MPMOW) and used this material for electrochemical capacitor studies. Some remarkable advantages could be observed in preparation. Firstly, the strategy is quite a facile process based only on a redox reaction between potassium permanganate and ascorbic acid (molar ratio = 10![[thin space (1/6-em)]](https://www.rsc.org/images/entities/char_2009.gif) :
:![[thin space (1/6-em)]](https://www.rsc.org/images/entities/char_2009.gif) 3) without any other additives (such as templates or surfactants) in tens of minutes under mild conditions (room temperature). Moreover, formation of manganese oxide particles with mesoporous structures was performed in a one-step fashion, avoiding complicated apparatus or multi-step reaction processes including modification and removal of templates in traditional approaches.48,49 Secondly, it is a green process due to using water, an environmentally benign solvent and environmentally compatible ascorbic acid as the reducing agent without any toxic or organic reagent. To the best our knowledge, ascorbic acid exists abundantly in food, fruit, vegetables and pharmaceutical products. On the other hand, cyclic voltammetry utilizing three alkali metal neutral aqueous electrolytes (Li2SO4, Na2SO4 and K2SO4) shows ideal capacitive behavior of MPMOW. Thus, using the materials for assembling much safer and cleaner supercapacitors gains more choices. Moreover, the results in galvanostatic cycling tests showed a good cyclic stability in three alkali metal neutral aqueous electrolytes after 2000 cycles at a current density of 833.33 mA g−1. Further and detailed information on the charge storage mechanism was well studied by these electrochemical experiments. Anyway, we hope this procedure may be useful for practical industrial applications of manganese oxide electrode materials.
3) without any other additives (such as templates or surfactants) in tens of minutes under mild conditions (room temperature). Moreover, formation of manganese oxide particles with mesoporous structures was performed in a one-step fashion, avoiding complicated apparatus or multi-step reaction processes including modification and removal of templates in traditional approaches.48,49 Secondly, it is a green process due to using water, an environmentally benign solvent and environmentally compatible ascorbic acid as the reducing agent without any toxic or organic reagent. To the best our knowledge, ascorbic acid exists abundantly in food, fruit, vegetables and pharmaceutical products. On the other hand, cyclic voltammetry utilizing three alkali metal neutral aqueous electrolytes (Li2SO4, Na2SO4 and K2SO4) shows ideal capacitive behavior of MPMOW. Thus, using the materials for assembling much safer and cleaner supercapacitors gains more choices. Moreover, the results in galvanostatic cycling tests showed a good cyclic stability in three alkali metal neutral aqueous electrolytes after 2000 cycles at a current density of 833.33 mA g−1. Further and detailed information on the charge storage mechanism was well studied by these electrochemical experiments. Anyway, we hope this procedure may be useful for practical industrial applications of manganese oxide electrode materials.
2. Experimental
2.1. Materials
All chemicals were of analytical grade and used as received without further purification. KMnO4 and ascorbic acid were purchased from Beijing Chemicals Co. Ltd; Li2SO4, Na2SO4 and K2SO4 from Sinopharm Chemical Reagent Co. Ltd. All solutions used in this work were prepared with Millipore Milli-Q water having a resistivity of 18 MΩ cm.
2.2. Synthesis
As shown in Scheme 1, MnO2 powder was synthesized using a facile one-step method based on a redox reaction between potassium permanganate and ascorbic acid (molar ratio = 10![[thin space (1/6-em)]](https://www.rsc.org/images/entities/char_2009.gif) :
:![[thin space (1/6-em)]](https://www.rsc.org/images/entities/char_2009.gif) 3) without any other additives or complicated apparatus. All reactants and reactions were kept at and carried out at room temperature. In a typical synthesis, 0.02 mol of KMnO4 was first dissolved in 50 mL of deionized water to reach a purple solution. Then a 15 mL of 0.4 mol L−1 ascorbic acid aqueous solution was added dropwise to the above solution with continuous vigorous stirring and ultrasonication for 0.5 h. A dark brown precipitate was immediately obtained, moreover, colour fade of KMnO4 solution and numerous colourless bubbles emissions could be observed as the reaction was carried out. The colourless and scentless gas emitted from the system was carbon dioxide (CO2), an environmentally circular gas, which has been confirmed by the appearance of a white precipitate when introduced into a clear Ca(OH)2 aqueous solution (Fig. S1, ESI†). Five cycles of centrifugation/washing/re-dispersion procedures with deionized water and ethanol were required before oven drying at 65 °C for 24 h. The dried powder and uniform dispersion in water are shown in Fig. 1a and indicate the colour of the final product.
3) without any other additives or complicated apparatus. All reactants and reactions were kept at and carried out at room temperature. In a typical synthesis, 0.02 mol of KMnO4 was first dissolved in 50 mL of deionized water to reach a purple solution. Then a 15 mL of 0.4 mol L−1 ascorbic acid aqueous solution was added dropwise to the above solution with continuous vigorous stirring and ultrasonication for 0.5 h. A dark brown precipitate was immediately obtained, moreover, colour fade of KMnO4 solution and numerous colourless bubbles emissions could be observed as the reaction was carried out. The colourless and scentless gas emitted from the system was carbon dioxide (CO2), an environmentally circular gas, which has been confirmed by the appearance of a white precipitate when introduced into a clear Ca(OH)2 aqueous solution (Fig. S1, ESI†). Five cycles of centrifugation/washing/re-dispersion procedures with deionized water and ethanol were required before oven drying at 65 °C for 24 h. The dried powder and uniform dispersion in water are shown in Fig. 1a and indicate the colour of the final product.
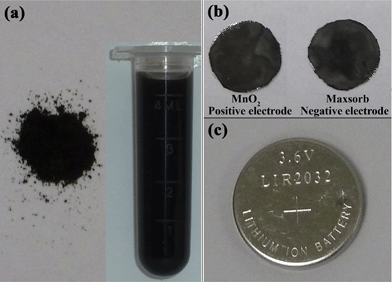 |
| | Fig. 1 (a) Photographs of MnO2 powder and dispersions in water; (b) MnO2 positive electrode and Maxsorb negative electrode; and a fabricated CR2032 coin-type cells (c). | |
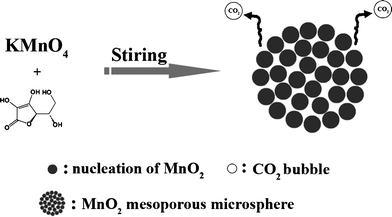 |
| | Scheme 1 Schematic illustration for preparing mesoporous MnO2 walnuts. | |
2.3. Materials characterization
Scanning electron microscopy (SEM, JEOL JSM-840 operated at 20 kV) was used to characterize the structural and morphological properties. The transmission electron microscopy (TEM) images were collected in a FEI TECNAI F20 TEM system operated with a 200 kV electron beam. X-ray diffraction spectra (XRD) were measured using a Rigaku D/max-IIB X-ray diffractometer at a scanning rate of 4 degrees per minute with 2θ ranging from 10° to 90°, using Cu-Kα radiation (λ = 1.5418 Å). IR spectra were recorded in the range 400–4000 cm−1 on an Alpha Centauri FT/IR spectrophotometer by use of KBr pellets. X-ray photoelectron spectroscopy (XPS) analysis combined with energy-dispersive X-ray analysis (EDX) has been done in order to obtain information about the chemical composition of the products. The specific surface area and porosity were measured by Brunauer–Emmett–Teller (BET) method using a Micromeritics Tristar 2020.
2.4. Electrochemical behavior
Electrodes were fabricated by mixing the active electrode materials (MnO2) and TAB (teflonized acetylene black) uniformly with the weight ratio of 2![[thin space (1/6-em)]](https://www.rsc.org/images/entities/char_2009.gif) :
:![[thin space (1/6-em)]](https://www.rsc.org/images/entities/char_2009.gif) 1. The composite mixture was pressed on a stainless mesh (1 cm2 area), with typically 6 mg active materials applied to each electrode. The electrochemical cells used here were two-electrode or three-electrode beaker cells filled with the alkali metal sulfate aqueous electrolytes (Li2SO4, Na2SO4 and K2SO4). Cyclic voltammetric (CV) were performed by a CHI660C electrochemical workstation (Shanghai CH Instrument Company, China) to assess the electrochemical performance of the MnO2-based composite electrodes. A three-electrode cell comprised a MnO2-based composite working electrode, a platinum flag counter electrode and a Ag/AgCl (saturated KCl) reference electrode. Galvanostatic charge–discharge cycle measurements were performed on a Land Battery tester (Wuhan Land Instrument Company, China) at room temperature by examining CR2032 coin-type cells with MnO2 and Maxsorb carbon electrodes (Fig. 1b) as positive and negative electrodes, respectively. The cutoff voltages were set at 0 and 1.7 V. Maxsorb is a kind of micro-porous carbon with the SBET of 1333 m2 g−1. Detailed physical parameters of it have been introduced in our precious reported papers.50,51
1. The composite mixture was pressed on a stainless mesh (1 cm2 area), with typically 6 mg active materials applied to each electrode. The electrochemical cells used here were two-electrode or three-electrode beaker cells filled with the alkali metal sulfate aqueous electrolytes (Li2SO4, Na2SO4 and K2SO4). Cyclic voltammetric (CV) were performed by a CHI660C electrochemical workstation (Shanghai CH Instrument Company, China) to assess the electrochemical performance of the MnO2-based composite electrodes. A three-electrode cell comprised a MnO2-based composite working electrode, a platinum flag counter electrode and a Ag/AgCl (saturated KCl) reference electrode. Galvanostatic charge–discharge cycle measurements were performed on a Land Battery tester (Wuhan Land Instrument Company, China) at room temperature by examining CR2032 coin-type cells with MnO2 and Maxsorb carbon electrodes (Fig. 1b) as positive and negative electrodes, respectively. The cutoff voltages were set at 0 and 1.7 V. Maxsorb is a kind of micro-porous carbon with the SBET of 1333 m2 g−1. Detailed physical parameters of it have been introduced in our precious reported papers.50,51
3. Results and discussion
A schematic process for preparing MPMOW based on a redox reaction between potassium permanganate and ascorbic acid is shown in Scheme 1. Small MnO2 crystals were formed accompanied with copious amounts of CO2 when ascorbic acid was added in a potassium permanganate aqueous solution at the early stage. The subsequent step involves aggregation of the small crystals and the formation of larger microsphere architectures driven by the minimization of the total energy of the system. Easily understood, continuous gas emissions during the crystallization and continuous growth process could result in the looseness of small crystals or larger aggregates. So, it is believed that the abundant CO2 emitted from the system throughout the reaction procedures probably played a key role in leading to the porous structures of final larger aggregates (mesoporous MnO2 walnuts).
3.1. Characterization of materials
SEM was used to investigate the morphology and size of the as-prepared MnO2 porous powder obtained via a facile redox reaction between potassium permanganate and ascorbic acid. Typical SEM micrographs of the samples with different magnification are shown in Fig. 2. It is clearly observed that the typical diameter of the MnO2 nanoparticles was in the range of 200–380 nm. The surfaces possessed lots of creases and thus a large amount of voids were apparent, which probably result from the carbon dioxide emissions in the gradual crystallization and growth process of MPMOW upon the redox reaction between KMnO4 and ascorbic acid. The TEM picture of the sample (Fig. 2c) shows some clear mesopores marked with red rings.
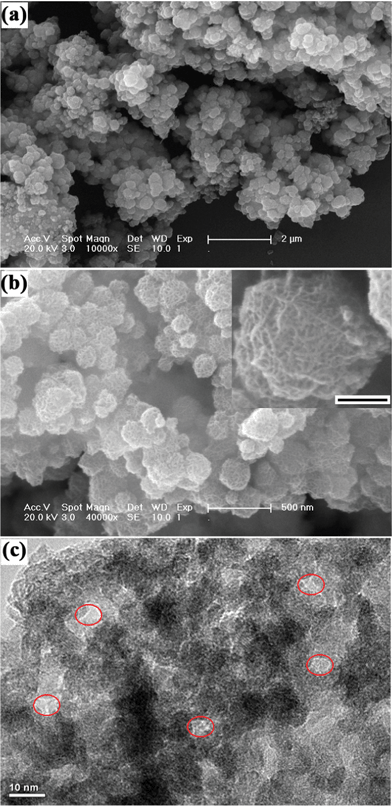 |
| | Fig. 2 (a) and (b) The typical SEM micrographs with different magnification and (c) TEM image of the mesoporous MnO2 walnuts. Scale bar in inset of (b) is 100 nm. | |
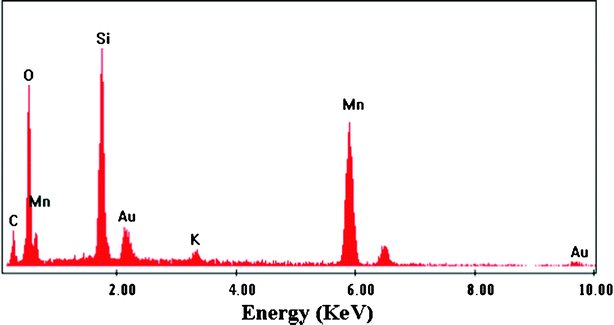
Some instrumental analyses were applied on the as-prepared products to determine the chemical component. The EDX chemical composition measurement shown in Fig. 3 confirmed that the sample of products contains the elements Mn and O (note: the Au and Si related peaks in the spectrum came from the gold coating and the silicon slide, respectively, when investigating SEM), implying that the as-prepared material is a kind of manganese oxide. Moreover, the EDX analysis carried out on other different points of the sample showed very similar spectra revealing the chemical homogeneity of the materials.
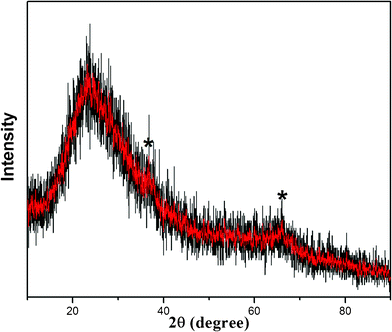
XRD analysis was used to identify the crystalline state of the as-prepared product. Fig. 4 shows the XRD pattern of the sample. The broad peak that appears between 2θ = 20° and 30° came from the peak of the glass slide when the XRD analysis was done. The other two main broad characteristic peaks at 2θ = 37.2° and 66.2° in XRD indicated the formation of MnO2 (JCPDS NO. 42-1169), the broad and low intensity of the signals imply the amorphous nature of MnO2.44,49,52–54
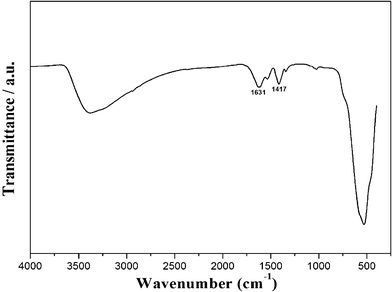
The FTIR spectrum for the as-prepared sample is shown in Fig. 5. The broad band between 400 and 800 cm−1 can be assigned to Mn–O bending vibrations. A broad band at around 3400 cm−1 is attributed to the stretching vibrations of H–O–H. The absorption bands located at about 1417 and 1631 cm−1 are attributed to bending vibrations of the OH group, related to adsorbed and crystalline water molecules.
XPS is an effective technique to analyze elements and the corresponding valence state of the material. The sample of as-prepared manganese oxide was characterized by XPS and the O1s and Mn2p core levels are shown in Fig. 6. The peak at 529.8 eV binding energies (BE) is attributed to O1s. And the peaks at 653.9 and 642.2 eV BE with a spin-energy separation of 11.7 eV are attributed to Mn2p1/2 and Mn2p3/2, respectively. Thus the XPS further indicated the chemical composition of manganese oxide. Based on the above results in accord with the previous reported literatures, MnO2 was successfully prepared by this facile strategy.
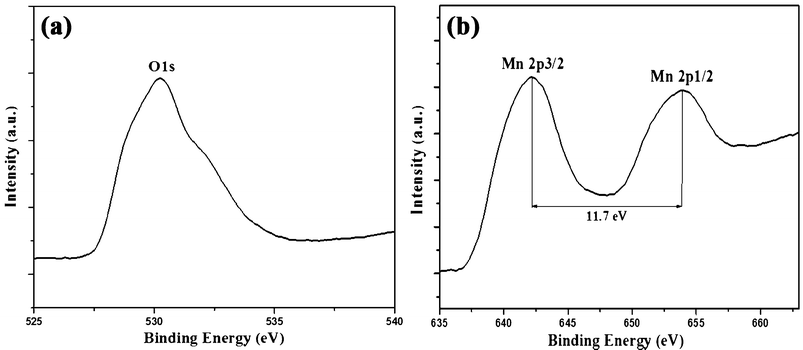 |
| | Fig. 6 (a) O1s and (b) Mn2p XPS spectrum of the mesoporous MnO2 walnuts. | |
To further investigate the porous structures of the as-prepared products, a gas absorption measurement was performed. Fig. 7 displays the N2 adsorption-desorption isotherms of the sample, indicating the porous nature of MPMOW. The isotherm has a distinct hysteresis loop observed in the P/P0 range of 0.6–0.99, which is a fingerprint of a mesoporous feature. The BET surface area of the MPMOW was found to be about 127.98 m2 g−1 calculated from the data in the P/P0 region of 0.45–0.95. The porosity of the materials was calculated by the BJH model (the inset in Fig. 7), which revealed a pore diameter of about 14 nm. Thus, the mesoporous nature of the sample was confirmed. The porosity and the rough surface always have a great influence on the electrochemical properties of the corresponding electrode materials.28–45
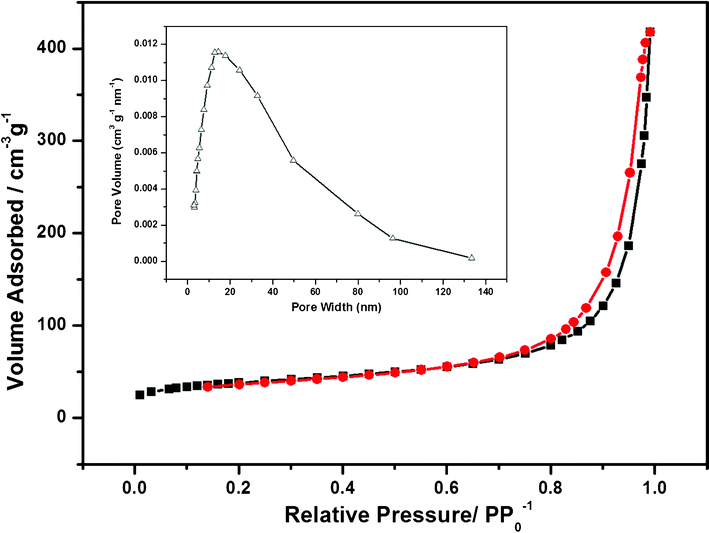 |
| | Fig. 7 Nitrogen adsorption–desorption isotherm of the mesoporous MnO2 walnuts. The inset is its BJH pore-size distribution curve. | |
3.2. Electrochemical behavior of materials
Cyclic voltammetry has turned out to be an effective experimental technique to evaluate the characteristic capacitive behavior of electrode materials in supercapacitors. Typical cyclic voltammograms of the amorphous MPMOW shown in Fig. 8 were collected between 0 and 1 V (vs. Ag/AgCl) in Na2SO4 aqueous solution with different concentrations (0.05–1 mol L−1) at varied scan rates (1–50 mV s−1) in the three-electrode cell system. Relatively rectangular and nearly mirror-image shaped CV curves without redox peaks were observed at the potential window, demonstrating that the materials possessed high electrochemical reversibility and ideal electrochemical capacitive properties in Na2SO4 aqueous solution.24,44,55 When increasing the scan rate, the area surrounded by CV curves shrinks, indicating a decrease in the capacitance value at a high scan rate. Additionally, the area surrounded by CV curves recorded at the same scan rate (1 mV s−1, for instance) becomes larger when the electrolyte concentration increased (Fig. 8f), implying the specific capacitance (SC) values of the MnO2 tended to increase when the electrolyte concentration was raised. The SC values of the electrode materials can be calculated from the CV curves using a three-electrode cell system according to the following equation:| |  | (1) |
where SC stand for the specific capacitance; Q represents the voltammetric charge obtained from the integrated area of the CV curves; m denotes the mass of active electrode material (6 mg); ΔV is the sweep potential window. Relationships between specific capacitance values and scan rates with different electrolyte concentrations are shown in Fig. 8g. At the scan rate of 1 mV−1, when concentrations of Na2SO4 solution were 1, 0.5, 0.25, 0.1 and 0.05 mol L−1, the corresponding SC values were 278.8, 244.7, 241.32, 223.1 and 200.6 F g−1, respectively.
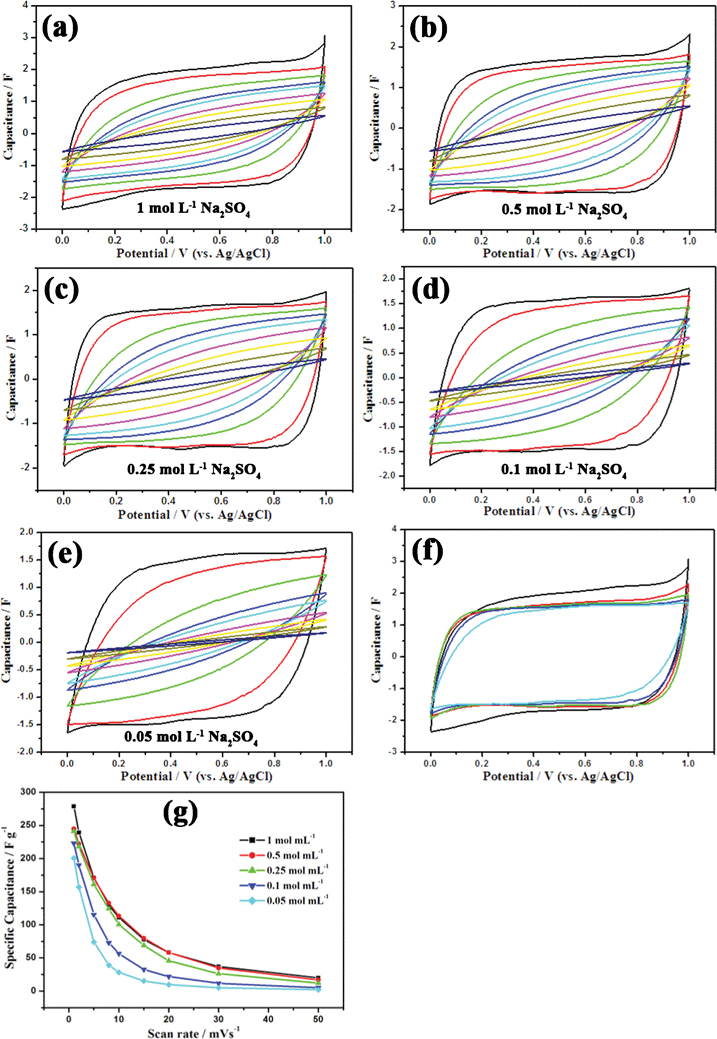 |
| | Fig. 8 (a–e) CV curves of mesoporous MnO2 walnuts at varied scan rates in Na2SO4 aqueous solutions with different concentrations (from inner to outer: 50, 30, 20, 15, 10, 8, 5, 2, 1 mV s−1). (f) Comparison of CV curves at the scan rate of 1 mV S−1 in Na2SO4 with different concentrations (from inner to outer: 0.05, 0.1, 0.25, 0.5, 1 mol L−1). (g) Relationships between specific capacitance values and scan rates with different Na2SO4 concentrations. | |
In this paper a series of cyclic voltammetry characterizations utilizing another two alkali metal salts (Li2SO4 and K2SO4) were also carried out for comparison to get further information on the charge storage mechanism of the electrode materials (see ESI†) It should be pointed out here that the concentration of saturated K2SO4 solution is about 0.65 mol L−1 at room temperature. For 1 mol L−1 Li2SO4 (Fig. S2) and 0.65 mol L−1 K2SO4 (Fig. S3) electrolytes, the highest SC values of 284.24 and 224.88 F g−1 were obtained, respectively. Fig. 9 shows the relationship between SC and scan rate in three electrolytes with same concentration (0.5 mol L−1) for comparison. It is interesting to note that these curves almost overlap together at high scan rates over 10 mV S−1. While in the low scan rate range, the SC values make apparent discriminations. The SC values with regard to alkali metal cations rank in the order as follows: Li+ > Na+ > K+. This behavior may bear a deep relationship with the charge storage mechanism of MnO2 electrodes in this study. As is well known, there are two charge storage mechanisms proposed for MnO2.18,19,31 One based on the adsorption/desorption of cations on the surface of materials is likely to be predominant in amorphous MnO2. The other involves the intercalation/de-intercalation of cations into/from MnO2 crystal lattice, and is accompanied with a faradic processes, mainly occurring in crystalline MnO2. As is well known, the size of alkali metal ions abides by the order of Li+ (0.6 Å) < Na+ (0.95 Å) < K+ (1.33 Å), while the radius of hydrated ions sticks to the order Li+ (3.82 Å) > Na+ (3.58 Å) > K+ (3.31 Å).31,50 Generally speaking, if the charge storage involves intercalation/de-intercalation of “naked” alkali metal cations, the SC values order will be Li+ > Na+ > K+. In contrast, the result would be the opposite if the adsorption/desorption of hydrated alkali metal cations at the surface of MnO2 occurred. The former are quite complex processes which may include the sluggish diffusion of alkali metal cations in the solid phase of the MnO2 bulk and the “tiresome” joint or take-off of the sheathing solvent molecules around the alkali metal cations. Only if at slow scan rates, the delicate features of this mechanism can be shown clearly. On the other hand, the latter are rather simple processes which don't cost so much activation energy, and the kinetics are very swift and smooth. Considering the small differences between the radius of hydrated alkali metal cations compared with the wide dimension of the mesoporous structures of MPMOW, we believe that the adsorption/desorption of hydrated cations contribute no big differences in SC values of MPMOW. Therefore, we think the charge storage mechanism in the MPMOW probably involved two facets: at slow scan rates, it behaves as an intercalation–deintercalation process of alkali metal cations; at high scan rates, it looks like the adsorption/desorption processes of hydrated alkali metal cations in the mesopores were predominant.
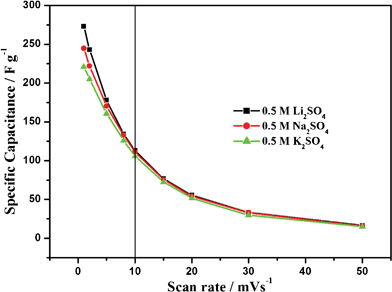 |
| | Fig. 9 Relationships between the specific capacitance values and scan rate in three electrolytes with varied concentrations. | |
Table 1 illustrates the summary of various porous MnO2 capacitor materials studied in aqueous electrolytes from the literature.21,27–45 In order to have an intuitive comparison, the relationship between specific capacitance and SBET is shown in Fig. 10. For most electrode materials, to the best of one's knowledge, the electric double-layer capacitance ranges from 10–40 μF cm−2. While in Fig. 10b, most computed capacitance data ranging from 100–250 μF cm−2 are significantly larger than the EDLC, further confirming the faradaic features of the MnO2 composite electrodes. The MPMOW (marked with red “*”) prepared by this facile and green method have a considerably high specific capacitance (both per mass and per SBET) although the surface area is not that extraordinarily big. Exactly as in the above-mentioned discussions regarding the storage mechanism, a large portion of the high capacitance of MPMOW could probably originate from pseudocapacitance in the faradaic process.
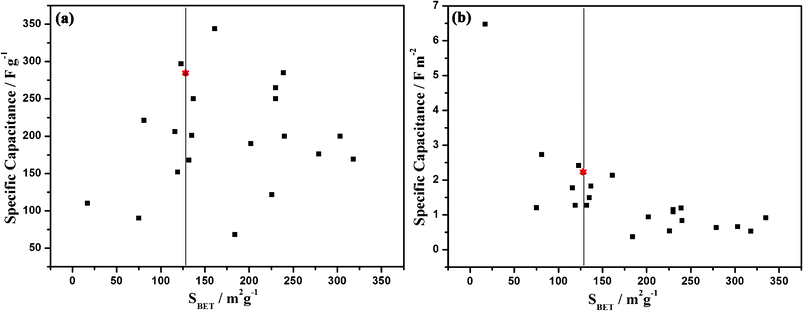 |
| | Fig. 10 Relationship between specific capacitance and SBET. | |
The overlapped CV curves of MPMOW and Maxsorb electrodes in 1 mol L−1 Na2SO4 at a scan rate of 1 mV s−1 are given in Fig. 11a. An irregularly asymmetric feature in the CV curve of Maxsorb was observed. Apparently, the region of the positive potential (0–0.5 V) is significantly smaller than that in the negative potential (−0.2 to −0.7 V). The positive portion corresponds to the adsorption/desorption of anions with bigger sizes while the negative portion relates to the adsorption/desorption of cations with smaller sizes. For MPMOW, the nearly rectangular CV curve without redox peaks was in a considerably wide potential window. Thus if the MnO2 material was used as the positive electrode and Maxsorb as the negative electrode in the fabrication of asymmetrical cells, higher positive voltages could be realized to meet the practical application of supercapacitors.
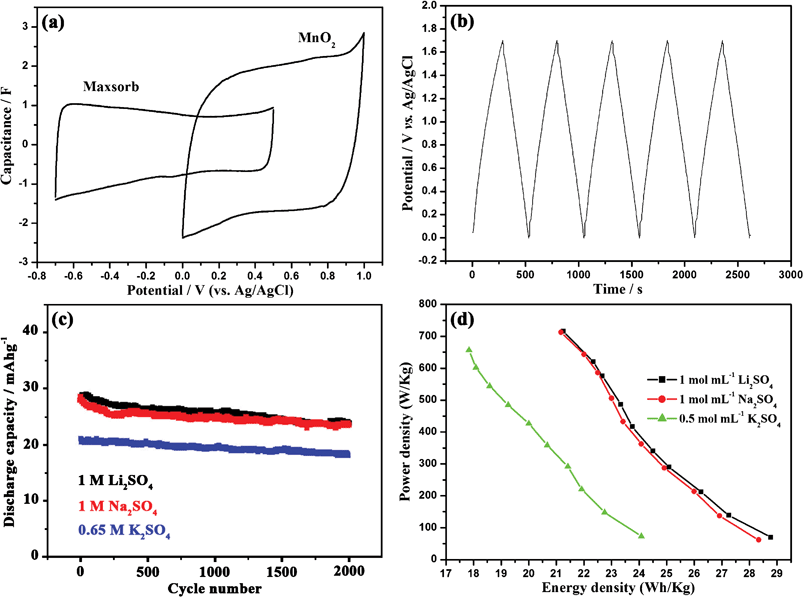 |
| | Fig. 11 (a) Overlapped CV curves of MnO2 and Maxsorb in 1 mol L−1 Na2SO4 at the scan rate of 1 mV s−1. (b) Galvanostatic charge/discharge curves and (c) long cycle performance of MnO2 electrode in 1 mol L−1 Na2SO4 at a current density of 833.33 mA g−1. The discharge capacity values were calculated by taking account of the total mass of MnO2 (6 mg) and Maxsorb (6 mg). (d) Ragone plots of supercapacitors composed of MnO2 positive electrodes and Maxsorb negative electrodes in three electrolytes with varied concentrations. | |
Galvanostatic charge–discharge curves of MnO2 electrode for the initial several cycles are shown in Fig. 11b. The variation of potential against time is linear in both charging and discharging processes. The linear relationships between potential and time also confirm the ideal capacitive property of the electrode material. Moreover, typical long cycle experiments performed in 1 mol L−1 Li2SO4, 1 mol L−1 Na2SO4, and 0.65 mol L−1 K2SO4 implied the good cyclic stability of the mesoporous MnO2. Good capacity retentions of 82.9%, 82.5% and 87.7% were achieved by the composite electrode after 2000 charge–discharge cycles in three alkali metal aqueous neutral aqueous electrolytes, respectively (Fig. 11c). Fig. 11d shows the Ragone plot of the electrochemical capacitors composed of MnO2 positive electrodes and Maxsorb negative electrodes. At the same electrolyte concentration (1 mol L−1), energy densities and power densities in Li2SO4 were somewhat higher than that in Na2SO4. By contrast with the capacitors fabricated with various carbon materials, the asymmetric capacitor of (−)Maxsorb/MPMOW(+) could also deliver much higher energy densities and power densities to meet future practical applications.50
Besides MPMOW, porous MnO2 with other morphologies could also be prepared by this strategy via tuning the molar ratio of potassium permanganate and ascorbic acid. For instance, the products obtained when the molar ratio of 10![[thin space (1/6-em)]](https://www.rsc.org/images/entities/char_2009.gif) :
:![[thin space (1/6-em)]](https://www.rsc.org/images/entities/char_2009.gif) 2 appeared as smaller particles than the MPMOW (Fig. 12a and b). The TEM image of the sample (Fig. 12c) shows similar results of Fig. 2c. In the typical XRD pattern (Fig. 13a), two broad and low intensity signals (2θ = 37.4° and 66.1°) also imply the composition and amorphous nature of manganese oxide. Furthermore, the porous structure of the sample was also investigated via gas absorption measurement (Fig. 13b). The isotherm contains an apparent hysteresis loop in the P/P0 range of 0.45–0.99, suggesting the mesoporous feature of materials. The SBET of the sample was calculated to be about 122.43 m2 g−1, and the average pore size of about 12 nm was also obtained from the BJH model. The results confirm that mesoporous MnO2 with other different morphologies could also be synthesized by simply tuning the molar ratio of two reactants. Moreover, we also utilized cyclic voltammetry to evaluate the electrochemical capacitive behavior of the electrode materials for supercapacitors. Relatively rectangular CV curves were also observed within the potential window (Fig. 13c). The SC value at the scan rate of 1 mV s−1 in 1 mol L−1 Na2SO4 aqueous was 186.3 F g−1, much smaller than that of MPMOW. The plots of specific capacitance value versus scan rate were shown in Fig. 13d. In Table S1, ESI,† on the basis of results of other comparison electrochemical tests, it could be concluded that the molar ratio of reagents at 10
2 appeared as smaller particles than the MPMOW (Fig. 12a and b). The TEM image of the sample (Fig. 12c) shows similar results of Fig. 2c. In the typical XRD pattern (Fig. 13a), two broad and low intensity signals (2θ = 37.4° and 66.1°) also imply the composition and amorphous nature of manganese oxide. Furthermore, the porous structure of the sample was also investigated via gas absorption measurement (Fig. 13b). The isotherm contains an apparent hysteresis loop in the P/P0 range of 0.45–0.99, suggesting the mesoporous feature of materials. The SBET of the sample was calculated to be about 122.43 m2 g−1, and the average pore size of about 12 nm was also obtained from the BJH model. The results confirm that mesoporous MnO2 with other different morphologies could also be synthesized by simply tuning the molar ratio of two reactants. Moreover, we also utilized cyclic voltammetry to evaluate the electrochemical capacitive behavior of the electrode materials for supercapacitors. Relatively rectangular CV curves were also observed within the potential window (Fig. 13c). The SC value at the scan rate of 1 mV s−1 in 1 mol L−1 Na2SO4 aqueous was 186.3 F g−1, much smaller than that of MPMOW. The plots of specific capacitance value versus scan rate were shown in Fig. 13d. In Table S1, ESI,† on the basis of results of other comparison electrochemical tests, it could be concluded that the molar ratio of reagents at 10![[thin space (1/6-em)]](https://www.rsc.org/images/entities/char_2009.gif) :
:![[thin space (1/6-em)]](https://www.rsc.org/images/entities/char_2009.gif) 3 was an optimized condition in terms of the SC values.
3 was an optimized condition in terms of the SC values.
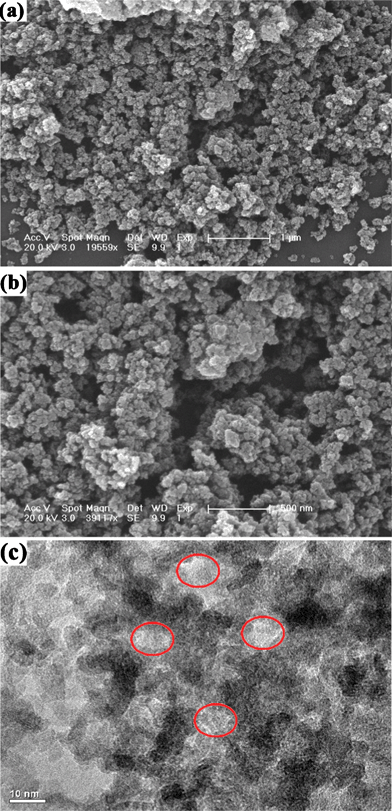 |
| | Fig. 12 (a) and (b) SEM micrographs with different magnifications and (c) TEM image of the mesoporous MnO2 prepared when molar ratio of reagents was 10![[thin space (1/6-em)]](https://www.rsc.org/images/entities/char_2009.gif) : :![[thin space (1/6-em)]](https://www.rsc.org/images/entities/char_2009.gif) 2. 2. | |
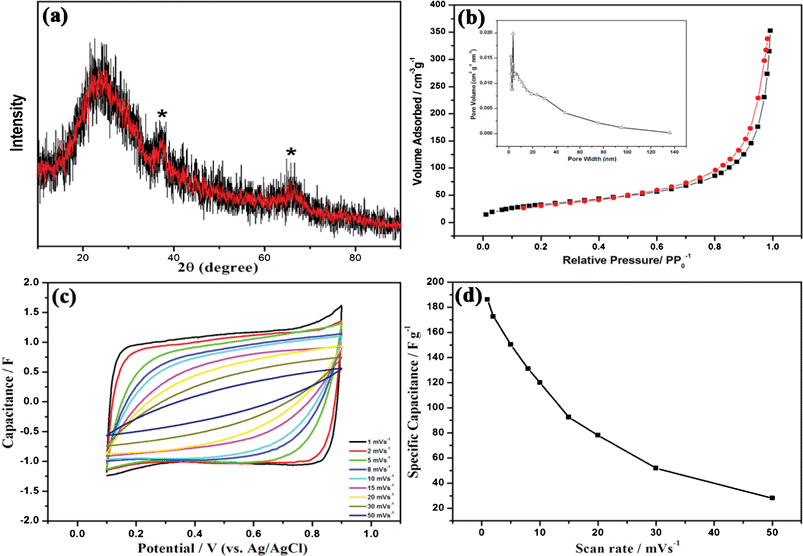 |
| | Fig. 13 (a) Typical XRD pattern, (b) N2 adsorption–desorption isotherm and BJH pore-size distribution curve (inset), and (c) CV curves at varied scan rates in 1 mol L−1 Na2SO4 aqueous solutions (from inner to outer: 50, 30, 20, 15, 10, 8, 5, 2, 1 mV s−1) of mesoporous MnO2 prepared when the molar ratio of reagents was 10![[thin space (1/6-em)]](https://www.rsc.org/images/entities/char_2009.gif) : :![[thin space (1/6-em)]](https://www.rsc.org/images/entities/char_2009.gif) 2; (d) Relationships between the specific capacitance values and scan rate with different Na2SO4 concentrations. 2; (d) Relationships between the specific capacitance values and scan rate with different Na2SO4 concentrations. | |
4. Conclusions
A simple strategy was developed to synthesize amorphous mesoporous MnO2 walnuts for supercapacitors. The whole procedure only involved quite a facile redox reaction between potassium permanganate and ascorbic acid within tens of minutes under mild condition (room temperature). The formation process of mesoporous structures was performed in a one-step process. Furthermore, it is a green process not only due to no other additives, toxic or organic reagent added, but also no pollutant was released. The electrochemical behaviors of the as synthesized materials showed a high specific capacitance and good cyclic stability in alkali metal aqueous neutral aqueous electrolytes at a high current density. We believed that the present simple method will be of great significance for commercialization and practical application of manganese oxide electrode materials in the future.
Acknowledgements
This work was supported by the Foundation of Applied science and technology of Jilin Province (20090521), and Hundred Talents Program of Chinese Academy of Sciences.
References
- S. Sarangapani, B. V. Tilak and C. P. Chen, J. Electrochem. Soc., 1996, 143, 3791 CrossRef CAS.
-
B. E. Conway, Electrochemical Supercapacitors, Kluwer Plenum Pub. Co., New York, 1999 Search PubMed.
- W. G. Pell, B. E. Conway, W. A. Adams and J. D. Oliveira, J. Power Sources, 1999, 80, 134 CrossRef CAS.
- C. M. Yang, Y. J. Kim, M. Endo, H. Kanoh, M. Yudasaka, S. Iijima and K. Kaneko, J. Am. Chem. Soc., 2007, 129, 20 CrossRef CAS.
- R. K. Selvan, I. Perelshtein, N. Perkas and A. Gedanken, J. Phys. Chem. C, 2008, 112, 1825 CAS.
- Q. L. Bao, S. J. Bao, C. M. Li, X. Qi, C. Pan, J. F. Zang, Z. S. Lu, Y. B. Li, D. Y. Tang, S. Zhang and K. J. Lian, J. Phys. Chem. C, 2008, 112, 3612 CAS.
- P. A. Nelson and J. R. Owen, J. Electrochem. Soc., 2003, 150, 1313 CrossRef.
- S. G. Kandalkar, J. L. Gunjakar and C. D. Lokhande, Appl. Surf. Sci., 2008, 254, 5540 CrossRef CAS.
- N. Miura, S. Oonishi and K. Rajendra, Electrochem. Solid-State Lett., 2004, 7, 247 CrossRef.
- W. Sugimoto, K. Yokoshima and Y. Murakami, Electrochim. Acta, 2006, 1742 CrossRef CAS.
- V. D. Patake, C. D. Lokhande and O. S. Joo, Appl. Surf. Sci., 2009, 255, 4192 CrossRef CAS.
- Y. R. Ahn, M. Y. Song, S. M. Jo and C. R. Park, Nanotechnology, 2006, 17, 2865 CrossRef CAS.
- C. Lin, J. A. Ritter and B. N. Popov, J. Electrochem. Soc., 1998, 145, 4097 CrossRef CAS.
- T. C. Liu, W. G. Pell and B. E. Conway, Electrochim. Acta, 1999, 44, 2829 CrossRef CAS.
- V. Srinivasan and J. W. Weinder, J. Electrochem. Soc., 2000, 147, 880 CrossRef CAS.
- P. Ragupathy, H. N. Vasan and N. Munichandraiahb, J. Electrochem. Soc., 2008, 155, A34 CrossRef CAS.
- S. L. Kuo and N. L. Wu, J. Electrochem. Soc., 2006, 153, A1317 CrossRef CAS.
- M. Toupin, T. Brousse and D. Bélanger, Chem. Mater., 2002, 14, 3946 CrossRef CAS.
- M. Toupin, T. Brousse and D. Bélanger, Chem. Mater., 2004, 16, 3184 CrossRef CAS.
- T. Brousse, M. Toupin, R. Dugas, L. Athouël, O. Crosnier and D. Bélanger, J. Electrochem. Soc., 2006, 153, A2171 CrossRef CAS.
- V. Subramanian, H. W. Zhu, R. Vajtai, P. M. Ajayan and B. Q. Wei, J. Phys. Chem. B, 2005, 109, 20207 CrossRef CAS.
- J. Jiang and A. Kucernak, Electrochim. Acta, 2002, 47, 2381 CrossRef CAS.
- S. Chen, J. W. Zhu, Q. F. Han, Z. J. Zheng, Y. Yang and X. Wang, Cryst. Growth Des., 2009, 9, 4356 CAS.
- C.-C. Hu and T.-W. Tsou, Electrochem. Commun., 2002, 4, 107 Search PubMed.
- O. Ghodbane, J. L. Pascal and F. Favier, ACS Appl. Mater. Interfaces, 2009, 1, 1130 CAS.
- M. W. Xu, L. B. Kong, W. J. Zhou and H. L. Li, J. Phys. Chem. C, 2007, 111, 19141 CAS.
- S. Devaraj and N. Munichandraiah, J. Phys. Chem. C, 2008, 112, 4406 CAS.
- G. Zhu, H. J. Li, L. J. Deng and Z.-H. Liu, Mater. Lett., 2010, 64, 1763 CrossRef CAS.
- A. E. Fischer, M. P. Saunders, K. A. Pettigrew, D. R. Rolison and J. W. Long, J. Electrochem. Soc., 2008, 55, A246 CrossRef.
- P. Ragupathy, D. H. Park, G. Campet, H. N. Vasan, S.-J. Hwang, J.-H. Choy and N. Munichandraiah, J. Phys. Chem. C, 2009, 113, 6303 CAS.
- Q. T. Qu, P. Zhang, B. Wang, Y. H. Chen, S. Tian, Y. P. Wu and R. Holze, J. Phys. Chem. C, 2009, 113, 14020 CAS.
- V. Subramanian, H. W. Zhu and B. Q. Wei, Chem. Phys. Lett., 2008, 453, 242 CrossRef CAS.
- E. Machefaux, T. Brousse, D. Belanger and D. Guyomard, J. Power Sources, 2007, 165, 651 CrossRef CAS.
- A. B. Yuan, X. L. Wang, Y. Q. Wang and J. Hu, Electrochim. Acta, 2009, 54, 1021 CrossRef CAS.
- J. Q. Yuan, Z.-H. Liu, S. F. Qiao, X. R. Ma and N. C. Xu, J. Power Sources, 2009, 189, 1278 CrossRef CAS.
- H. Y. Lee and J. B. Goodenough, J. Solid State Chem., 1999, 144, 220 CrossRef CAS.
- R. R. Jiang, T. Huang, J. L. Liu, J. H. Zhuang and A. S. Yu, Electrochim. Acta, 2009, 54, 3047 CrossRef CAS.
- L. X. Li, P. Hua, X. K. Tian, C. Yang and Z. B. Pi, Electrochim. Acta, 2010, 55, 1682 CrossRef CAS.
- C. Z. Yuan, B. Gao, L. H. Su and X. G. Zhang, J. Colloid Interface Sci., 2008, 322, 545 CrossRef CAS.
- M.-W. Xu, W. Jia, S.-J. Bao, Z. Su and B. Dong, Electrochim. Acta, 2010, 55, 5117 CrossRef CAS.
- X. X. He, M. Y. Yang, P. Ni, Y. Li and Z.-H. Liu, Colloids Surf., A, 2010, 363, 64 CrossRef CAS.
- P. Yu, X. Zhang, Y. Chen and Y. W. Ma, Mater. Lett., 2010, 64, 1480 CrossRef CAS.
- N. Tang, X. K. Tian, C. Yang and Z. B. Pi, Mater. Res. Bull., 2009, 44, 2062 CrossRef CAS.
- A. Zolfaghari, F. Ataherian, M. Ghaemi and A. Gholami, Electrochim. Acta, 2007, 52, 2806 CrossRef CAS.
- A. B. Yuan, X. L. Wang, Y. Q. Wang and J. Hu, Electrochim. Acta, 2009, 54, 1021 CrossRef CAS.
- Z.-R. Tian, W. Tong, J.-Y. Wang, N.-G. Duan, V. V. Krishnan and S. L. Suib, Science, 1997, 276, 926 CrossRef CAS.
- J. B. Fei, Y. Cui, X. H. Yan, W. Qi, Y. Yang, K. W. Wang, Q. He and J. B. Li, Adv. Mater., 2008, 20, 452 CrossRef.
- M. Imperor-Clerc, D. Bazin, M.-D. Appay, P. Beaunier and A. Davidson, Chem. Mater., 2004, 16, 1813 CrossRef CAS.
- J.-H. Smått, C. Weidenthaler, J. B. Rosenholm and M. Lindén, Chem. Mater., 2006, 18, 1443 CrossRef.
- C. Zheng, L. Qi, M. Yoshio and H. Y. Wang, J. Power Sources, 2010, 195, 4406 CrossRef CAS.
- J. Yin, C. Zheng, L. Qi and H. Y. Wang, J. Power Sources, 2011, 196, 4080 CrossRef CAS.
- G. Z. Shen, Y. Bando, C. C. Tang and D. Golberg, J. Phys. Chem. B, 2006, 110, 7199 CrossRef CAS.
- J. H. Zhang, H. Y. Liu, Z. L. Wang, N. B. Ming, Z. R. Li and A. S. Biris, Adv. Funct. Mater., 2007, 17, 3897 CrossRef CAS.
- Y. U. Jeong and A. Manthiram, J. Electrochem. Soc., 2002, 149, A1419 CrossRef CAS.
- V. Khomenko, E. Raymudo-Pinero and F. Béguin, J. Power Sources, 2006, 153, 183 CrossRef CAS.
Footnote |
| † Electronic supplementary information (ESI) available: Cyclic voltammograms of the MPMOW at varied scan rates in neutral Li2SO4 and K2SO4 aqueous solutions with different concentrations as well as relationships between the specific capacitance value and scan rate. See DOI: 10.1039/c2ra00991a |
|
| This journal is © The Royal Society of Chemistry 2012 |
Click here to see how this site uses Cookies. View our privacy policy here. ![[thin space (1/6-em)]](https://www.rsc.org/images/entities/char_2009.gif) :
:![[thin space (1/6-em)]](https://www.rsc.org/images/entities/char_2009.gif) 3) without any other additives (such as templates or surfactants) in tens of minutes under mild conditions (room temperature). Moreover, formation of manganese oxide particles with mesoporous structures was performed in a one-step fashion, avoiding complicated apparatus or multi-step reaction processes including modification and removal of templates in traditional approaches.48,49 Secondly, it is a green process due to using water, an environmentally benign solvent and environmentally compatible ascorbic acid as the reducing agent without any toxic or organic reagent. To the best our knowledge, ascorbic acid exists abundantly in food, fruit, vegetables and pharmaceutical products. On the other hand, cyclic voltammetry utilizing three alkali metal neutral aqueous electrolytes (Li2SO4, Na2SO4 and K2SO4) shows ideal capacitive behavior of MPMOW. Thus, using the materials for assembling much safer and cleaner supercapacitors gains more choices. Moreover, the results in galvanostatic cycling tests showed a good cyclic stability in three alkali metal neutral aqueous electrolytes after 2000 cycles at a current density of 833.33 mA g−1. Further and detailed information on the charge storage mechanism was well studied by these electrochemical experiments. Anyway, we hope this procedure may be useful for practical industrial applications of manganese oxide electrode materials.
3) without any other additives (such as templates or surfactants) in tens of minutes under mild conditions (room temperature). Moreover, formation of manganese oxide particles with mesoporous structures was performed in a one-step fashion, avoiding complicated apparatus or multi-step reaction processes including modification and removal of templates in traditional approaches.48,49 Secondly, it is a green process due to using water, an environmentally benign solvent and environmentally compatible ascorbic acid as the reducing agent without any toxic or organic reagent. To the best our knowledge, ascorbic acid exists abundantly in food, fruit, vegetables and pharmaceutical products. On the other hand, cyclic voltammetry utilizing three alkali metal neutral aqueous electrolytes (Li2SO4, Na2SO4 and K2SO4) shows ideal capacitive behavior of MPMOW. Thus, using the materials for assembling much safer and cleaner supercapacitors gains more choices. Moreover, the results in galvanostatic cycling tests showed a good cyclic stability in three alkali metal neutral aqueous electrolytes after 2000 cycles at a current density of 833.33 mA g−1. Further and detailed information on the charge storage mechanism was well studied by these electrochemical experiments. Anyway, we hope this procedure may be useful for practical industrial applications of manganese oxide electrode materials.![[thin space (1/6-em)]](https://www.rsc.org/images/entities/char_2009.gif) :
:![[thin space (1/6-em)]](https://www.rsc.org/images/entities/char_2009.gif) 3) without any other additives or complicated apparatus. All reactants and reactions were kept at and carried out at room temperature. In a typical synthesis, 0.02 mol of KMnO4 was first dissolved in 50 mL of deionized water to reach a purple solution. Then a 15 mL of 0.4 mol L−1 ascorbic acid aqueous solution was added dropwise to the above solution with continuous vigorous stirring and ultrasonication for 0.5 h. A dark brown precipitate was immediately obtained, moreover, colour fade of KMnO4 solution and numerous colourless bubbles emissions could be observed as the reaction was carried out. The colourless and scentless gas emitted from the system was carbon dioxide (CO2), an environmentally circular gas, which has been confirmed by the appearance of a white precipitate when introduced into a clear Ca(OH)2 aqueous solution (Fig. S1, ESI†). Five cycles of centrifugation/washing/re-dispersion procedures with deionized water and ethanol were required before oven drying at 65 °C for 24 h. The dried powder and uniform dispersion in water are shown in Fig. 1a and indicate the colour of the final product.
3) without any other additives or complicated apparatus. All reactants and reactions were kept at and carried out at room temperature. In a typical synthesis, 0.02 mol of KMnO4 was first dissolved in 50 mL of deionized water to reach a purple solution. Then a 15 mL of 0.4 mol L−1 ascorbic acid aqueous solution was added dropwise to the above solution with continuous vigorous stirring and ultrasonication for 0.5 h. A dark brown precipitate was immediately obtained, moreover, colour fade of KMnO4 solution and numerous colourless bubbles emissions could be observed as the reaction was carried out. The colourless and scentless gas emitted from the system was carbon dioxide (CO2), an environmentally circular gas, which has been confirmed by the appearance of a white precipitate when introduced into a clear Ca(OH)2 aqueous solution (Fig. S1, ESI†). Five cycles of centrifugation/washing/re-dispersion procedures with deionized water and ethanol were required before oven drying at 65 °C for 24 h. The dried powder and uniform dispersion in water are shown in Fig. 1a and indicate the colour of the final product.


![[thin space (1/6-em)]](https://www.rsc.org/images/entities/char_2009.gif) :
:![[thin space (1/6-em)]](https://www.rsc.org/images/entities/char_2009.gif) 1. The composite mixture was pressed on a stainless mesh (1 cm2 area), with typically 6 mg active materials applied to each electrode. The electrochemical cells used here were two-electrode or three-electrode beaker cells filled with the alkali metal sulfate aqueous electrolytes (Li2SO4, Na2SO4 and K2SO4). Cyclic voltammetric (CV) were performed by a CHI660C electrochemical workstation (Shanghai CH Instrument Company, China) to assess the electrochemical performance of the MnO2-based composite electrodes. A three-electrode cell comprised a MnO2-based composite working electrode, a platinum flag counter electrode and a Ag/AgCl (saturated KCl) reference electrode. Galvanostatic charge–discharge cycle measurements were performed on a Land Battery tester (Wuhan Land Instrument Company, China) at room temperature by examining CR2032 coin-type cells with MnO2 and Maxsorb carbon electrodes (Fig. 1b) as positive and negative electrodes, respectively. The cutoff voltages were set at 0 and 1.7 V. Maxsorb is a kind of micro-porous carbon with the SBET of 1333 m2 g−1. Detailed physical parameters of it have been introduced in our precious reported papers.50,51
1. The composite mixture was pressed on a stainless mesh (1 cm2 area), with typically 6 mg active materials applied to each electrode. The electrochemical cells used here were two-electrode or three-electrode beaker cells filled with the alkali metal sulfate aqueous electrolytes (Li2SO4, Na2SO4 and K2SO4). Cyclic voltammetric (CV) were performed by a CHI660C electrochemical workstation (Shanghai CH Instrument Company, China) to assess the electrochemical performance of the MnO2-based composite electrodes. A three-electrode cell comprised a MnO2-based composite working electrode, a platinum flag counter electrode and a Ag/AgCl (saturated KCl) reference electrode. Galvanostatic charge–discharge cycle measurements were performed on a Land Battery tester (Wuhan Land Instrument Company, China) at room temperature by examining CR2032 coin-type cells with MnO2 and Maxsorb carbon electrodes (Fig. 1b) as positive and negative electrodes, respectively. The cutoff voltages were set at 0 and 1.7 V. Maxsorb is a kind of micro-porous carbon with the SBET of 1333 m2 g−1. Detailed physical parameters of it have been introduced in our precious reported papers.50,51



![[thin space (1/6-em)]](https://www.rsc.org/images/entities/char_2009.gif) :
:![[thin space (1/6-em)]](https://www.rsc.org/images/entities/char_2009.gif) 2 appeared as smaller particles than the MPMOW (Fig. 12a and b). The TEM image of the sample (Fig. 12c) shows similar results of Fig. 2c. In the typical XRD pattern (Fig. 13a), two broad and low intensity signals (2θ = 37.4° and 66.1°) also imply the composition and amorphous nature of manganese oxide. Furthermore, the porous structure of the sample was also investigated via gas absorption measurement (Fig. 13b). The isotherm contains an apparent hysteresis loop in the P/P0 range of 0.45–0.99, suggesting the mesoporous feature of materials. The SBET of the sample was calculated to be about 122.43 m2 g−1, and the average pore size of about 12 nm was also obtained from the BJH model. The results confirm that mesoporous MnO2 with other different morphologies could also be synthesized by simply tuning the molar ratio of two reactants. Moreover, we also utilized cyclic voltammetry to evaluate the electrochemical capacitive behavior of the electrode materials for supercapacitors. Relatively rectangular CV curves were also observed within the potential window (Fig. 13c). The SC value at the scan rate of 1 mV s−1 in 1 mol L−1 Na2SO4 aqueous was 186.3 F g−1, much smaller than that of MPMOW. The plots of specific capacitance value versus scan rate were shown in Fig. 13d. In Table S1, ESI,† on the basis of results of other comparison electrochemical tests, it could be concluded that the molar ratio of reagents at 10
2 appeared as smaller particles than the MPMOW (Fig. 12a and b). The TEM image of the sample (Fig. 12c) shows similar results of Fig. 2c. In the typical XRD pattern (Fig. 13a), two broad and low intensity signals (2θ = 37.4° and 66.1°) also imply the composition and amorphous nature of manganese oxide. Furthermore, the porous structure of the sample was also investigated via gas absorption measurement (Fig. 13b). The isotherm contains an apparent hysteresis loop in the P/P0 range of 0.45–0.99, suggesting the mesoporous feature of materials. The SBET of the sample was calculated to be about 122.43 m2 g−1, and the average pore size of about 12 nm was also obtained from the BJH model. The results confirm that mesoporous MnO2 with other different morphologies could also be synthesized by simply tuning the molar ratio of two reactants. Moreover, we also utilized cyclic voltammetry to evaluate the electrochemical capacitive behavior of the electrode materials for supercapacitors. Relatively rectangular CV curves were also observed within the potential window (Fig. 13c). The SC value at the scan rate of 1 mV s−1 in 1 mol L−1 Na2SO4 aqueous was 186.3 F g−1, much smaller than that of MPMOW. The plots of specific capacitance value versus scan rate were shown in Fig. 13d. In Table S1, ESI,† on the basis of results of other comparison electrochemical tests, it could be concluded that the molar ratio of reagents at 10![[thin space (1/6-em)]](https://www.rsc.org/images/entities/char_2009.gif) :
:![[thin space (1/6-em)]](https://www.rsc.org/images/entities/char_2009.gif) 3 was an optimized condition in terms of the SC values.
3 was an optimized condition in terms of the SC values.
![[thin space (1/6-em)]](https://www.rsc.org/images/entities/char_2009.gif) :
:![[thin space (1/6-em)]](https://www.rsc.org/images/entities/char_2009.gif) 2.
2.
![[thin space (1/6-em)]](https://www.rsc.org/images/entities/char_2009.gif) :
:![[thin space (1/6-em)]](https://www.rsc.org/images/entities/char_2009.gif) 2; (d) Relationships between the specific capacitance values and scan rate with different Na2SO4 concentrations.
2; (d) Relationships between the specific capacitance values and scan rate with different Na2SO4 concentrations.